assessment of soil erosion using usle model and gis for integrated ...
assessment of soil erosion using usle model and gis for integrated ...
assessment of soil erosion using usle model and gis for integrated ...

You also want an ePaper? Increase the reach of your titles
YUMPU automatically turns print PDFs into web optimized ePapers that Google loves.
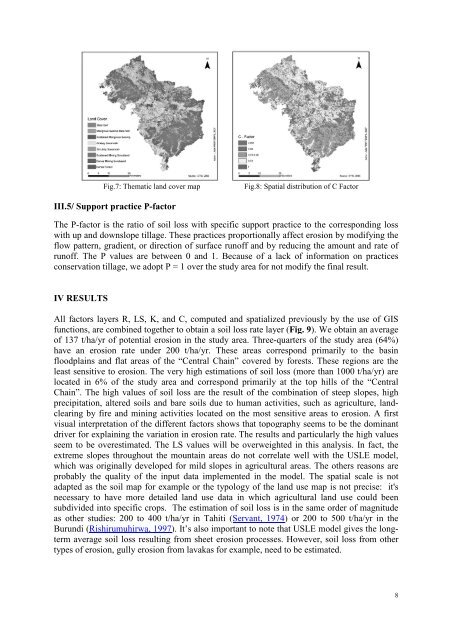
Fig.7: Thematic l<strong>and</strong> cover mapFig.8: Spatial distribution <strong>of</strong> C FactorIII.5/ Support practice P-factorThe P-factor is the ratio <strong>of</strong> <strong>soil</strong> loss with specific support practice to the corresponding losswith up <strong>and</strong> downslope tillage. These practices proportionally affect <strong>erosion</strong> by modifying theflow pattern, gradient, or direction <strong>of</strong> surface run<strong>of</strong>f <strong>and</strong> by reducing the amount <strong>and</strong> rate <strong>of</strong>run<strong>of</strong>f. The P values are between 0 <strong>and</strong> 1. Because <strong>of</strong> a lack <strong>of</strong> in<strong>for</strong>mation on practicesconservation tillage, we adopt P = 1 over the study area <strong>for</strong> not modify the final result.IV RESULTSAll factors layers R, LS, K, <strong>and</strong> C, computed <strong>and</strong> spatialized previously by the use <strong>of</strong> GISfunctions, are combined together to obtain a <strong>soil</strong> loss rate layer (Fig. 9). We obtain an average<strong>of</strong> 137 t/ha/yr <strong>of</strong> potential <strong>erosion</strong> in the study area. Three-quarters <strong>of</strong> the study area (64%)have an <strong>erosion</strong> rate under 200 t/ha/yr. These areas correspond primarily to the basinfloodplains <strong>and</strong> flat areas <strong>of</strong> the “Central Chain” covered by <strong>for</strong>ests. These regions are theleast sensitive to <strong>erosion</strong>. The very high estimations <strong>of</strong> <strong>soil</strong> loss (more than 1000 t/ha/yr) arelocated in 6% <strong>of</strong> the study area <strong>and</strong> correspond primarily at the top hills <strong>of</strong> the “CentralChain”. The high values <strong>of</strong> <strong>soil</strong> loss are the result <strong>of</strong> the combination <strong>of</strong> steep slopes, highprecipitation, altered <strong>soil</strong>s <strong>and</strong> bare <strong>soil</strong>s due to human activities, such as agriculture, l<strong>and</strong>clearingby fire <strong>and</strong> mining activities located on the most sensitive areas to <strong>erosion</strong>. A firstvisual interpretation <strong>of</strong> the different factors shows that topography seems to be the dominantdriver <strong>for</strong> explaining the variation in <strong>erosion</strong> rate. The results <strong>and</strong> particularly the high valuesseem to be overestimated. The LS values will be overweighted in this analysis. In fact, theextreme slopes throughout the mountain areas do not correlate well with the USLE <strong>model</strong>,which was originally developed <strong>for</strong> mild slopes in agricultural areas. The others reasons areprobably the quality <strong>of</strong> the input data implemented in the <strong>model</strong>. The spatial scale is notadapted as the <strong>soil</strong> map <strong>for</strong> example or the typology <strong>of</strong> the l<strong>and</strong> use map is not precise: it'snecessary to have more detailed l<strong>and</strong> use data in which agricultural l<strong>and</strong> use could beensubdivided into specific crops. The estimation <strong>of</strong> <strong>soil</strong> loss is in the same order <strong>of</strong> magnitudeas other studies: 200 to 400 t/ha/yr in Tahiti (Servant, 1974) or 200 to 500 t/ha/yr in theBurundi (Rishirumuhirwa, 1997). It’s also important to note that USLE <strong>model</strong> gives the longtermaverage <strong>soil</strong> loss resulting from sheet <strong>erosion</strong> processes. However, <strong>soil</strong> loss from othertypes <strong>of</strong> <strong>erosion</strong>, gully <strong>erosion</strong> from lavakas <strong>for</strong> example, need to be estimated.8