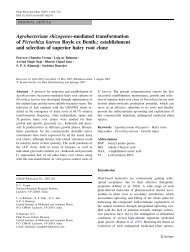
ARTICLE IN PRESS4 K. <strong>Shanker</strong> et al. / Food Chemistry xxx (2007) xxx–xxx_______Pods______________Leaves_______4035Extractibility (mg/100g)3025201510NiaziridinNiazirin500 40 80 0 40 80Ethanol Composition (%)Fig. 3. Extraction of niaziridin and niazirin with various concentrations of ethanol–aqueous composition for pods and leaves of M. oleifera.selected 40% ethanol–water solution as extracting solventfor pod in our further study. In order to optimize otherextracting conditions, we further carried out an experimenton temperature and time. Extractability (mg/100 g) of niaziridinand niazirin from M. oleifera was observed at40,60,90, and 120 °C for 60,90,120,150, and 180 min,respectively. Result shows that extraction of pods at60 °C for 120 min was the ideal for maximum extractionof 33 mg/100 g and 32 mg/100 g of the target markers i.e.niaziridin and niazirin, respectively.2.4.2. Preparation of standardized extract of M. oleiferapodsEthanol–water extract of M. oleifera pods was lyophilizedand re-dissolved in water and filtered. The insolubleportion was dissolved in methanol. The water soluble portionwas successively extracted with hexane, chloroform,ethyl acetate and n-butanol, respectively. Na 2 SO 4 (anhydrous)was added to each organic fraction for removingthe moisture. All the solvent fractions were concentratedat 40 °C under reduced pressure and tested for bioenhancingactivity of rifampicin. The results indicated that ethylacetate fraction obtained from the crude pod extract possessedthe activity enhancement property. The fractionwith maximum bioenhancing activity was termed as pharmacologicallyactive standardized extract. We further confirmedthat the HPLC method developed by us is able toensure the efficacy and quality of standardized extract.2.5. Statistical analysisData were processed and recorded as means ± standarddeviation of triplicate measurements. Analyses of variance(ANOVA), significance differences between the means andleast square regression (Steele & Torrie, 1980) were performedusing Graph PAD Prism version 3.0 for Windows,GraphPad Software, San Diego, CA.3. Result and discussion3.1. Separation and detection of niaziridin and niazirinSeparation and photodiode array spectrum of (A) standardcompounds niaziridin (1) and niazirin (2) with respectiveUV-spectra, (B) representative HPLC chromatogramsof bioenhancer enriched active fraction of pods with theiriso-absorbance map (contour plot) using ChromolithRP18e column are presented in Figs. 1 and 2 show theHPLC profiles of regenerable tissues, pods, leaves and barkby multiple monitor (220 and 275 nm) and contour plot(190–400 nm) using a photo-diode array detector. The targetedcompounds were not detected in bark sample in studiedcombinations of ethanol–water. The contour plot of theUV absorbance intensity of the compounds shows boththe compounds, which have detectable UV absorbance inthe extracts of various parts of the plant. The presence ofniaziridin and niazirin in various plant parts was confirmedby comparison with the retention time and with the UVspectra matching of the compound in respective extractof the crude drug (Fig. 2).The content (%) of bioenhancer constituent niaziridinand niazirin in various vegetative and regenerable tissuesviz. leaves, pods and bark of drumstick were studied forresearch field station and local market collected samples.Leaves and pod sample of research filed station showedniaziridin (0.015 ± 0.005) and (0.039 ± 0.006), respectivelywhere as niazirin was observed (0.038 ± 0.004) and (0.033 ±0.008), respectively. Market collected sample showed (%)content of (0.010 ± 0.008) and (0.031 ± 0.006) for niaziridinand (0.038 ± 0.010) and (0.029 ± 0.010) for niazirin,respectively. Niaziridin and niazirin were not detected inthe bark samples. Niazirin was present in slightly higheramount in leaves in comparisons to the pods while niaziridincontent was three times higher in the pods than theleaves. The content of niaziridin in market sample wasPlease cite this article in press as: <strong>Shanker</strong>, K. et al., Determination of bioactive nitrile glycoside(s) in drumstick ..., Food Chemistry(2007), doi:10.1016/j.foodchem.2006.12.034
ARTICLE IN PRESSK. <strong>Shanker</strong> et al. / Food Chemistry xxx (2007) xxx–xxx 5lower than the plant samples of research filed station. Thisstresses the importance of chemical analysis in discriminatingthe plant tissues for the isolation of bioactive constituents.From the above results, it is evident that for theisolation of niaziridin, pods of M. oleifera while for niazirinleaves may be used as potential source. Since extracts weremade immediately after drying of the plant material andextracts were stored at 4 °C, decomposition of bioenhancercompounds can be ruled out in the sample.3.2. LC method validationSeveral analytical parameters were evaluated to validatethe new LC method using recommendations defined byICH guidelines for method validation (ICH, 1994, 1996).3.2.1. Calibration graphs, limits of detection/quantification(LOD/LOQ)Standards containing methanolic mixtures of 1 and 2were prepared by dilution using 1 mg/mL stock solution.Five standard of working solutions were prepared by MeOHdilution with concentrations within the expected range ofconcentrations in the material under investigation. The calibrationcurves were determined using the least-squaresmethod, for independent variable (X) the concentration(mg/mL) and for dependent variable (Y) the peak area ofniaziridin and niazirin, respectively was used. Regressionanalyses of both the compounds were performed by GraphPAD Prism 3.0. Linear regression parameters slope =1.99 10 7 and 7.37 10 6 ; Y-intercept = 1.66 10 5 and1.29 10 5 ; X-intercept = 8.37 10 3 and 1.76 10 2 ; S y,xat 95% confidence intervals = 2.09 10 4 and 8.5 10 3 ;correlation coefficient R 2 = 0.9992 and 0.9991 were for niaziridinand niazirin, respectively. The curves confirm the significantlinear relationship between the concentration andthe peak area.LOD and LOQ were determined using the linear regressionequation. Following equations were applied:LOD = 3S y,x /b and LOQ = 10S y,x /b, where S y,x is the standarddeviation of the Y-value distribution around theregression line and b is the slope of the calibration curve.Applying the equations, we determined LODs for niaziridinand niazirin to be 0.003 and 0.004 mg/mL, respectivelyand LOQs were in the same way determined as 0.011 and0.012 mg/mL, respectively.3.2.2. Selectivity/specificityA diode array detector was applied for the selectivitytest. The test was performed on a niaziridin and niazirinin extract of M. oleifera Pods. The test was carried outusing peak purity judgment, which is part of the WatersMillennium Ò HPLC-PDA system for handling 3D chromatographicdata. The principle of peak purity judgmentis to obtain purity angle and purity threshold, of individualpeaks. The reliability of the peak purity test can further beenhanced by carrying out the test at various wavelengths.Typically, when using Waters Millennium Ò PDA software,a component with a peak purity angle lower than its puritythreshold would be considered most likely to be a pure substanceand the separation would be acceptable. Theabsorption spectra of both peaks (1 & 2) were stored inthe software. The peaks associated with niaziridin and niazirinin the extracts were identified by retention times (5.953and 8.085 respectively) and spectra between 200 and400 nm compared with the library of reference compoundsstored in the software. It was shown that in real sampleanalysis i.e. extract of M. oleifera the peak purity angle(niaziridin 0.780 and niazirin 1.981) was lower thanpeak threshold (niaziridin 1.630 and niazirin 2.187).It is evident that at 220 nm, the degree of peak purity ishigher and the absorption spectrum of both compoundswas maximum. Quantitation of compounds both in referenceand sample solution was performed at 220 nm peakarea data acquisition. The selectivity has been shown ona chromatogram for one of the sample of M. oleifera pods(Fig. 1).3.2.3. RecoveryThree different concentrations diluted from the stocksolution were added to an extract with a known contentof niaziridin and niazirin and the recovery of respectiveconstituent was calculated. The recovery (R) was calculatedas R =(C found C sample )/C added , where C found is the concentrationin spiked sample, C sample is the concentrationin the sample prior to spiking and C added is the concentrationof the added standard. Three concentrations of standardcompounds added in the range of 100–120, 180–200and 240–260 lg/mL were used during the study. Theresults of the tests were acceptable, as the average recoveryof niaziridin and niazirin were 86% and 95%, respectively.3.2.4. PrecisionPrecision is a test for the distribution of concentrationsmeasured. Two different concentrations of the stock solutionswere exposed to six determinations on the sameday. Repeatability of analysis was performed in three concentrationrange from 0.4 to 0.9 mg/mL and 0.8–1.8 mg/mL was used during the experiment for niaziridin and niazirin,respectively. All RSD values were below 2%, which isconsidered to be acceptable.3.2.5. Intermediate precisionThis test was carried out using the same equipment ondifferent days for three different samples run in triplicate.All RSD values obtained for both niaziridin and niazirinwere below 5% in the acceptable range of analysis.3.2.6. RobustnessRobustness of the method was tested by varying twoparameters viz. flow rate and column oven temperature.One parameter was kept constant during variation in otherparameter. Different flow rates (0.5,0.7 and 1.0 mL/min)and column oven temperatures (25, 27, and 29 °C) werePlease cite this article in press as: <strong>Shanker</strong>, K. et al., Determination of bioactive nitrile glycoside(s) in drumstick ..., Food Chemistry(2007), doi:10.1016/j.foodchem.2006.12.034