PART II : FINANCIAL MANAGEMENT 1. Answer the following ...
PART II : FINANCIAL MANAGEMENT 1. Answer the following ...
PART II : FINANCIAL MANAGEMENT 1. Answer the following ...
You also want an ePaper? Increase the reach of your titles
YUMPU automatically turns print PDFs into web optimized ePapers that Google loves.
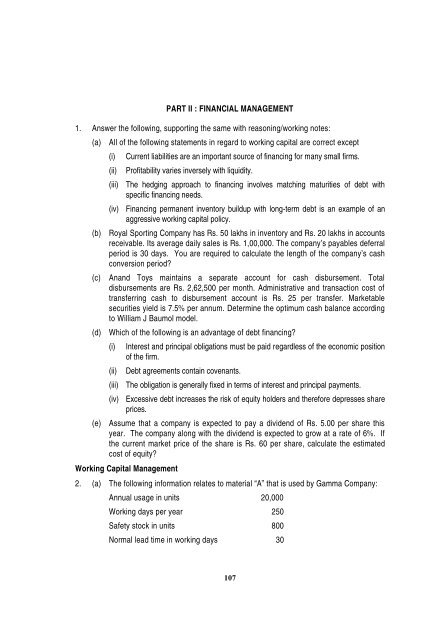
<strong>PART</strong> <strong>II</strong> : <strong>FINANCIAL</strong> <strong>MANAGEMENT</strong><br />
<strong>1.</strong> <strong>Answer</strong> <strong>the</strong> <strong>following</strong>, supporting <strong>the</strong> same with reasoning/working notes:<br />
(a) All of <strong>the</strong> <strong>following</strong> statements in regard to working capital are correct except<br />
(i) Current liabilities are an important source of financing for many small firms.<br />
(ii) Profitability varies inversely with liquidity.<br />
(iii) The hedging approach to financing involves matching maturities of debt with<br />
specific financing needs.<br />
(iv) Financing permanent inventory buildup with long-term debt is an example of an<br />
aggressive working capital policy.<br />
(b) Royal Sporting Company has Rs. 50 lakhs in inventory and Rs. 20 lakhs in accounts<br />
receivable. Its average daily sales is Rs. 1,00,000. The company’s payables deferral<br />
period is 30 days. You are required to calculate <strong>the</strong> length of <strong>the</strong> company’s cash<br />
conversion period?<br />
(c) Anand Toys maintains a separate account for cash disbursement. Total<br />
disbursements are Rs. 2,62,500 per month. Administrative and transaction cost of<br />
transferring cash to disbursement account is Rs. 25 per transfer. Marketable<br />
securities yield is 7.5% per annum. Determine <strong>the</strong> optimum cash balance according<br />
to William J Baumol model.<br />
(d) Which of <strong>the</strong> <strong>following</strong> is an advantage of debt financing?<br />
(i) Interest and principal obligations must be paid regardless of <strong>the</strong> economic position<br />
of <strong>the</strong> firm.<br />
(ii) Debt agreements contain covenants.<br />
(iii) The obligation is generally fixed in terms of interest and principal payments.<br />
(iv) Excessive debt increases <strong>the</strong> risk of equity holders and <strong>the</strong>refore depresses share<br />
prices.<br />
(e) Assume that a company is expected to pay a dividend of Rs. 5.00 per share this<br />
year. The company along with <strong>the</strong> dividend is expected to grow at a rate of 6%. If<br />
<strong>the</strong> current market price of <strong>the</strong> share is Rs. 60 per share, calculate <strong>the</strong> estimated<br />
cost of equity?<br />
Working Capital Management<br />
2. (a) The <strong>following</strong> information relates to material “A” that is used by Gamma Company:<br />
Annual usage in units 20,000<br />
Working days per year 250<br />
Safety stock in units 800<br />
Normal lead time in working days 30<br />
107
The units of <strong>the</strong> material “A” will be required evenly throughout <strong>the</strong> year. Compute<br />
<strong>the</strong> order point.<br />
(b) If Peta Company’s terms of trade are 3/10, net 45 with a particular supplier, <strong>the</strong>n<br />
calculate <strong>the</strong> cost on an annual basis of not taking <strong>the</strong> discount? Assume a 360-day<br />
year.<br />
Investment Decisions<br />
3. (a) Zion Limited is planning for <strong>the</strong> purchase of a machine that would cost Rs. 1,00,000<br />
with <strong>the</strong> expectation that Rs. 20,000 per year could be saved in after-tax cash costs<br />
if <strong>the</strong> machine was acquired. The machine’s estimated useful life is ten years, with<br />
no residual value, and would be depreciated by <strong>the</strong> straight-line method. You are<br />
required to calculate <strong>the</strong> payback period.<br />
(b) Equipment A has a cost of Rs. 75,000 and net cash flow of Rs. 20,000 per year for<br />
six years. A substitute equipment B would cost Rs. 50,000 and generate net cash<br />
flow of Rs. 14,000 per year for six years. The required rate of return of both<br />
equipments is 11 per cent. Calculate <strong>the</strong> IRR and NPV for <strong>the</strong> equipments. Which<br />
equipment should be accepted and why?<br />
Financing Decisions<br />
4. Bestvision Company requires Rs. 10,00,000 of financing and is considering two options<br />
as given under:<br />
Options Amount of Equity Amount of Debt Before–tax Cost of<br />
Raised (Rs.) Financing (Rs.) Debt (per annum)<br />
A 7,00,000 3,00,000 8%<br />
B 3,00,000 7,00,000 10%<br />
In <strong>the</strong> first year of operations, <strong>the</strong> company is expected to have sales revenues of Rs.<br />
5,00,000; cost of sales of Rs. 2,00,000; and general and administrative expenses of Rs.<br />
1,00,000. The tax rate is 30%. All earnings are paid out as dividends at year end.<br />
You are required to calculate:<br />
(a) The weighted average cost of capital under option A, if <strong>the</strong> cost of equity is 12%.<br />
(b) The return on equity and <strong>the</strong> debt ratio under <strong>the</strong> two options.<br />
Financial Analysis and Planning<br />
5. The <strong>following</strong> accounting information and financial ratios of Mahurat Limited relate to <strong>the</strong><br />
year ended 31st December, 2008:<br />
2008<br />
I Accounting Information:<br />
Gross Profit 15% of Sales<br />
Net profit 8% of sales<br />
Raw materials consumed 20% of works cost<br />
108
Direct wages 10% of works cost<br />
Stock of raw materials 3 months’ usage<br />
Stock of finished goods 6% of works cost<br />
Debt collection period 60 days<br />
All sales are on credit<br />
<strong>II</strong> Financial Ratios:<br />
Fixed assets to sales 1 : 3<br />
Fixed assets to Current assets 13 : 11<br />
Current ratio 2 : 1<br />
Long-term loans to Current liabilities 2 : 1<br />
Capital to Reserves and Surplus 1 : 4<br />
If value of fixed assets as on 31st December, 2007 amounted to Rs. 26 lakhs, you are<br />
required to prepare a summarised Profit and Loss Account of <strong>the</strong> company for <strong>the</strong> year<br />
ended 31st December, 2008 and also <strong>the</strong> Balance Sheet as on 31st December, 2008.<br />
Investment Decisions<br />
6. Zubair Electronics is considering <strong>the</strong> proposal of taking up a new project which requires<br />
an investment of Rs. 400 lakhs on machinery and o<strong>the</strong>r assets. The project is expected<br />
to yield <strong>the</strong> <strong>following</strong> earnings (before depreciation and taxes) over <strong>the</strong> next five years:<br />
Year Earnings (Rs. in lakhs)<br />
1 160<br />
2 160<br />
3 180<br />
4 180<br />
5 150<br />
The cost of raising <strong>the</strong> additional capital is 12% and assets have to be depreciated at<br />
20% on ‘Written Down Value’ basis. The scrap value at <strong>the</strong> end of <strong>the</strong> five years’ period<br />
may be taken as zero. Income-tax applicable to <strong>the</strong> company is 50%.<br />
You are required to calculate <strong>the</strong> net present value of <strong>the</strong> project and advise <strong>the</strong><br />
management to take appropriate decision. Also calculate <strong>the</strong> Internal Rate of Return of<br />
<strong>the</strong> Project.<br />
Note: Present value of Re. 1 at different rates of interest is as follows:<br />
Year 10% 12% 14% 16%<br />
1 0.91 0.89 0.88 0.86<br />
2 0.83 0.80 0.77 0.74<br />
3 0.75 0.71 0.67 0.64<br />
109
Financing Decisions<br />
4 0.68 0.64 0.59 0.55<br />
5 0.62 0.57 0.52 0.48<br />
7. Vishwabharati Limited has <strong>the</strong> <strong>following</strong> book value capital structure:<br />
Equity Capital (in shares of Rs. 10 each, fully paid up - at par) Rs. 15 crores<br />
11% Preference Capital (in shares of Rs. 100 each, fully paid up - at par) Rs. 1 crore<br />
Retained Earnings Rs. 20 crores<br />
13.5% Debentures (of Rs. 100 each) Rs. 10 crores<br />
15% Term Loans Rs. 12.5 crores<br />
The next expected dividend on equity shares per share is Rs. 3.60; <strong>the</strong> dividend per<br />
share is expected to grow at <strong>the</strong> rate of 7%. The market price per share is Rs. 40.<br />
Preference share, redeemable after ten years, is currently selling at Rs. 75 per share.<br />
Debentures, redeemable after six years, are selling at Rs. 80 per debenture. The Income<br />
tax rate for <strong>the</strong> company is 40%.<br />
You are required to calculate <strong>the</strong> weighted average cost of capital using:<br />
(a) Book value proportions; and<br />
(b) Market value proportions.<br />
Financial Analysis and Planning<br />
8. Housestores Limited<br />
Consolidated Balance Sheets<br />
Amounts in lakhs, except per share data February 2,<br />
2009<br />
Assets<br />
Current Assets:<br />
110<br />
February 2,<br />
2008<br />
Rs. Rs.<br />
Cash and Cash equivalents 2,188 2,477<br />
Short-term investments, including current<br />
maturities of long-term investments<br />
65 69<br />
Receivables, net 1,072 920<br />
Merchandise inventories 8,338 6,725
O<strong>the</strong>r current assets 254 170<br />
Total current assets 11,917 10,361<br />
Property and equipment, at cost:<br />
Land 5,560 4,972<br />
Buildings 9,197 7,698<br />
Furniture, fixtures and equipment 4,074 3,403<br />
Leasehold improvements 872 750<br />
Construction in progress 724 1,049<br />
Capital leases 306 257<br />
111<br />
20,733 18,129<br />
Less: Accumulated depreciation and amortization 3,565 2,754<br />
Net property and equipment 17,168 15,375<br />
Notes receivable 107 83<br />
Cost in excess of <strong>the</strong> fair value of net assets<br />
acquired, net of accumulated amortisation of Rs.<br />
50 at February 2, 2009, and Rs. 49 at February 3,<br />
2008<br />
575 419<br />
O<strong>the</strong>r assets 244 156<br />
Total assets 30,011 26,394<br />
Liabilities and Shareholders’ Equity<br />
Current Liabilities:<br />
Accounts payable 4,560 3,436<br />
Accrued salaries and related expenses 809 717<br />
Sales taxes payable 307 348<br />
Deferred revenue 998 851<br />
Income taxes payable 227 211<br />
O<strong>the</strong>r accrued expenses 1,134 938<br />
Total current liabilities 8,035 6,501<br />
Long-term debt, excluding current installments 1,321 1,250<br />
O<strong>the</strong>r long-term liabilities 491 372<br />
Deferred income taxes 362 189
Total liabilities 10,209 8,312<br />
Shareholders’ Equity<br />
Equity shares, par value Rs. 0.05; authorized:<br />
10,000 shares, issued and outstanding 2,362<br />
shares at February 3, 2009, and 2,346 shares at<br />
February 3, 2008 118 117<br />
Paid-in capital 5,858 5,412<br />
Retained earnings 15,971 12,799<br />
Accumulated o<strong>the</strong>r comprehensive loss (82) (220)<br />
Unearned compensation (63) (26)<br />
Treasury stock, at cost, 69 shares at February 2,<br />
2009<br />
112<br />
(2,000) �<br />
Total shareholders’ equity 19,802 18,082<br />
Total liabilities and shareholders’ equity 30,011 26,394<br />
Amounts in lakhs, except per share data<br />
Housestores Limited<br />
Consolidated Statements of Earnings<br />
Year Ended<br />
February 2,<br />
2009<br />
February3,<br />
2008<br />
January 28,<br />
2007<br />
Net Sales Rs. 58,247 Rs. 53,553 Rs. 45,738<br />
Cost of merchandise sold 40,139 37,406 32,057<br />
Gross profit 18,108 16,147 13,681<br />
Operating expenses:<br />
Selling and store operating 11,180 10,163 8,513<br />
Pre-opening 96 117 142<br />
General and administrative 1,002 935 835<br />
Total operating expenses 12,278 11,215 9,490<br />
Operating income 5,830 4,932 4,191<br />
Interest income (expense):<br />
Interest and investment income 79 53 47
Interest expense (37) (28) (21)<br />
Interest, net 42 25 26<br />
Earnings before provision for income<br />
taxes<br />
113<br />
5,872 4,957 4,217<br />
Provision for income taxes 2,208 1,913 1,636<br />
Net earnings Rs. 3,664 Rs. 3,044 Rs. 2,581<br />
Weighted-average equity shares 2,336 2,335 2,315<br />
Basic earnings per share Rs. <strong>1.</strong>57 Rs. <strong>1.</strong>30 Rs. <strong>1.</strong>11<br />
Diluted weighted-average equity shares 2,344 2,353 2,352<br />
Diluted earnings per share Rs. <strong>1.</strong>56 Rs. <strong>1.</strong>29 Rs. <strong>1.</strong>10<br />
You are required to calculate:<br />
(a) Profitability Ratios<br />
(b) Activity Ratios<br />
(c) Liquidity Ratios<br />
(d) Debt Utilisation Ratios<br />
(e) Market Ratios.<br />
Financial Analysis and Planning<br />
9. The <strong>following</strong> financial statements relate to Thermox Limited:<br />
Capital and Liabilities:<br />
Balance Sheet as on<br />
March 31, 2009 March 31, 2008<br />
Rs. Rs.<br />
Share capital, Rs. 10 par value 1,67,500 1,50,000<br />
Share premium 3,35,000 2,37,500<br />
Reserves and Surplus 1,74,300 1,23,250<br />
Debentures 2,40,000 �<br />
Long-term loans 40,000 50,000<br />
Creditors 28,800 27,100<br />
Bank Overdraft 7,500 6,250<br />
Accrued expenses 4,350 4,600<br />
Income-tax payable 48,250 16,850<br />
10,45,700 6,15,550
March 31, 2009 March 31, 2008<br />
Rs. Rs.<br />
Assets:<br />
Land 3,600 3,600<br />
Building, net of depreciation 6,01,800 1,78,400<br />
Machinery, net of depreciation 1,10,850 1,07,050<br />
Investment in ‘A’ Ltd. 75,000 �<br />
Stock 58,800 46,150<br />
Prepaid expenses 1,900 2,300<br />
Debtors 76,350 77,150<br />
Trade Investments 40,000 1,05,000<br />
Cash 77,400 95,900<br />
10,45,700 6,15,550<br />
Income Statement<br />
for <strong>the</strong> year ended March 31, 2009<br />
Net Sales 13,50,000<br />
Less: Cost of goods sold and operating expenses (including depreciation on<br />
buildings of Rs. 6,600 and depreciation on machinery of Rs. 11,400) 12,58,950<br />
Net operating profit 91,050<br />
Gain on sale of trade investments 6,400<br />
Gain on sale of machinery 1,850<br />
Profits before tax 99,300<br />
Income-tax 48,250<br />
Profits after tax 51,050<br />
Additional information:<br />
(i) Machinery with a net book value of Rs. 9,150 was sold during <strong>the</strong> year.<br />
(ii) The shares of ‘A’ Ltd. were acquired by issue of debentures.<br />
You are required to prepare a Funds Flow Statement (Statement of Changes in Financial<br />
Position on Working capital basis) for <strong>the</strong> year ended March 31, 2009.<br />
Time Value of Money<br />
10. (a) Mr. Pinto borrowed Rs. 1,00,000 from a bank on a one-year 8% term loan, with<br />
interest compounded quarterly. Determine <strong>the</strong> effective annual interest on <strong>the</strong> loan?<br />
114<br />
Rs.
(b) Suppose Adit has borrowed a 3-year loan of Rs. 10,000 at 9 per cent from his<br />
employer to buy a motorcycle. If his employer requires three equal end-of-year<br />
repayments, <strong>the</strong>n calculate <strong>the</strong> annual instalment.<br />
Working Capital Management<br />
1<strong>1.</strong> (a) Konika Electronics has total sales of Rs. 3.2 crores and its average collection period<br />
is 90 days. The past experience indicates that bad-debt losses are <strong>1.</strong>5% on sales.<br />
The expenditure incurred by <strong>the</strong> company in administering its receivable collection<br />
efforts are Rs. 5,00,000. A factor is prepared to buy <strong>the</strong> company’s receivables by<br />
charging 2% commission. The factor will pay advance on receivables to Konika<br />
Electronics at an interest rate of 18% p.a. after withholding 10% as reserve. You are<br />
required to compute <strong>the</strong> effective cost of factoring to Konika Electronics.<br />
(b) Vijaylaxmi Limited, a newly formed company, has applied to a commercial bank for<br />
<strong>the</strong> first time for financing its working capital requirements. The <strong>following</strong> information<br />
is available about <strong>the</strong> projections for <strong>the</strong> current year:<br />
Estimated level of activity: 1,04,000 completed units of production plus 4,000 units<br />
of work-in-progress. Based on <strong>the</strong> above activity, estimated cost per unit is:<br />
Raw material Rs. 80 per unit<br />
Direct wages Rs. 30 per unit<br />
Overheads (exclusive of depreciation) Rs. 60 per unit<br />
Total cost Rs. 170 per unit<br />
Selling price Rs. 200 per unit<br />
Raw materials in stock: Average 4 weeks consumption, work-in-progress (assume<br />
50% completion stage in respect of conversion cost) (materials issued at <strong>the</strong> start of<br />
<strong>the</strong> processing).<br />
Finished goods in stock 8,000 units<br />
Credit allowed by suppliers Average 4 weeks<br />
Credit allowed to debtors/receivables Average 8 weeks<br />
Lag in payment of wages<br />
115<br />
1<br />
Average 1 weeks<br />
2<br />
Cash at banks (for smooth operation) is expected to be Rs. 25,000.<br />
Assume that production is carried on evenly throughout <strong>the</strong> year (52 weeks) and<br />
wages and overheads accrue similarly. All sales are on credit basis only.<br />
You are required to determine:<br />
(i) The net working capital required;<br />
(ii) The maximum permissible bank finance under first and second methods of<br />
financing as per Tandon Committee Norms.
12. Differentiate between <strong>the</strong> <strong>following</strong>:<br />
(a) Traditional Phase and Modern Phase of Financial Management<br />
(b) Liquidity Ratios and Activity Ratios<br />
(c) Debt Financing and Equity Financing<br />
(d) Financial Lease and Operating Lease.<br />
13. Write short notes on <strong>the</strong> <strong>following</strong>:<br />
(a) Role of Chief Financial Officer (CFO)<br />
(b) Composition of ROE using Du Pont<br />
(c) Trading on Equity<br />
(d) External Commercial Borrowings (ECBs).<br />
SUGGESTED ANSWERS/HINTS<br />
<strong>1.</strong> (a) The requirement is to determine <strong>the</strong> false statement regarding working capital<br />
management. <strong>Answer</strong> (iv) is correct because financing permanent inventory buildup<br />
with long-term debt is an example of a conservative working capital policy. <strong>Answer</strong>s<br />
(i), (ii), and (iii) are all accurate statements about working capital management.<br />
(b) Calculation of <strong>the</strong> Conversion Cycle<br />
Cash Conversion Period = Inventory Conversion Period + Receivables Collection<br />
Period – Payable Deferral Period<br />
Inventory Conversion Period = Rs. 50,00,000/Rs. 100,000 = 50 days<br />
Receivable Conversion Period = Rs. 20,00,000 / Rs. 100,000 = 20 days.<br />
Therefore, Cash Conversion Cycle = 50 days + 20 days – 30 days = 40 days<br />
(c) Determination of Optimal Cash Balance according to William J. Baumol Model<br />
The formula for determining optimum cash balance is:<br />
2U�P<br />
C �<br />
S<br />
Where,<br />
C = Optimum cash balance<br />
U = Annual (or monthly) cash disbursement<br />
P = Fixed cost per transaction.<br />
S = Opportunity cost of one rupee p.a. (or p.m.)<br />
116
C =<br />
=<br />
2�2 , 62,<br />
500�12�25<br />
0.<br />
075<br />
15,<br />
75,<br />
00,<br />
000<br />
0.<br />
075<br />
= 2,<br />
10,<br />
00,<br />
00,<br />
000<br />
Optimum cash balance, C, = Rs. 45,826<br />
(d) The requirement is to identify <strong>the</strong> advantages of debt financing. <strong>Answer</strong> ( iii) is<br />
correct because <strong>the</strong> fixed obligation of interest and principal is an advantage to debt<br />
financing. <strong>Answer</strong>s (i), (ii), and (iv) are incorrect because <strong>the</strong>y are all disadvantages<br />
of debt financing.<br />
(e) Calculation of Estimated Cost of Equity using Dividend-yield-plus-growth-rate<br />
Approach<br />
Estimated cost of equity = ( Dividend / Price of <strong>the</strong> Share) + Growth rate<br />
= [(Rs. 5 ÷ Rs. 60) + 6%]<br />
= 14.3%<br />
2. (a) Determination of Order Point for Material A<br />
When safety stock is maintained, <strong>the</strong> order point is computed as follows:<br />
Order Point = Daily demand × Lead time in days + Safety stock<br />
Daily demand = 20,000 units ÷ 250 days<br />
= 80 units<br />
Order Point = [(80 × 30) + 800]<br />
= 3,200 units<br />
(b) Calculation of Cost of Not taking a Trade Discount<br />
The formula for computing <strong>the</strong> interest is as under :<br />
Interest =<br />
Discount percent<br />
360 days<br />
�<br />
100%<br />
�Discount<br />
percent Total pay period �Discount<br />
period<br />
3%<br />
360 days<br />
= �<br />
�3<strong>1.</strong><br />
81%<br />
100%<br />
�3<br />
% 45 days �10<br />
days<br />
Cost of Not taking a Trade Discount = 3<strong>1.</strong>81%<br />
3. (a) Calculation of Payback Period<br />
The payback method evaluates investments on <strong>the</strong> length of time until total amount<br />
invested are recouped in <strong>the</strong> form of cash inflows or cash outflows avoided.<br />
Payback Period = Initial investment ÷ Annual cash inflow of a project<br />
117
= Rs. 100,000 ÷ Rs. 20,000<br />
= 5 years.<br />
(b) Calculation of Net Present Value (NPV) and Internal Rate of Return (IRR) for<br />
Equipment A and Equipment B<br />
Equipment A:<br />
NPV = 20,000 � PVAF6,0.11 – 75,000<br />
= 20,000 � 4.231 – 75,000<br />
= 84,620 – 75,000 = Rs. 9,620<br />
IRR = 20,000 � PVAF6,r = 75,000<br />
PVAF6,r = 75,000 / 20,000 = 3.75<br />
From <strong>the</strong> present value of an annuity table, we find:<br />
PVAF6,0.15 = 3.784<br />
PVAF6,0.16 = 3.685<br />
� 3.784 �3.75<br />
�<br />
Therefore, IRR �r<br />
�0.15<br />
�0.01<br />
�<br />
�<br />
�3.784<br />
�3.685�<br />
Equipment B:<br />
= 0.15 + 0.0034<br />
= 0.1534 or 15.34%.<br />
NPV = 14,000 � PVAF6,0.11 – 50,000<br />
= 14,000 � 4.231 – 50,000<br />
= 59,234 – 50,000 = Rs. 9,234<br />
IRR = 14,000 � PVAF6,r = 50,000<br />
PVAF6,r = 50,000/14,000 = 3.571<br />
From <strong>the</strong> present value of an annuity table, we find:<br />
PVAF6,0.17 = 3.589<br />
PVAF6,0.18 = 3.498<br />
�3.589<br />
�3.571�<br />
Therefore, IRR �r<br />
�0.17<br />
�0.01<br />
� �<br />
�3.589<br />
�3.498�<br />
= 0.17 + 0.002 = 0.172 or 17.20%.<br />
Recommendation: Equipment A has a higher NPV but lower IRR as compared to<br />
Equipment B. Therefore, Equipment A should be preferred since <strong>the</strong> wealth of <strong>the</strong><br />
shareholders will be maximized.<br />
118
4. (a) Calculation of Weighted Average Cost of Capital (WACC)<br />
WACC = (Weight of equity) × (Cost of equity) + (Wei ght of debt) × (Before-tax cost<br />
of debt) × (1 - Tax rate)<br />
= (0.7) × (0.12) + (0.3) × (0.08) × (1 - 0.3)<br />
= 0.084 + 0.0168 = 0.1008 = 10.08%.<br />
(b) Calculation of Return on Equity (ROE) and Debt Ratio<br />
Return on Equity = Net Income ÷ Amount of Equity Invested<br />
Debt Ratio = Amount of Debt Financing ÷ Total Assets<br />
Calculations of <strong>the</strong> Two Ratios for Both Financing Arrangements<br />
119<br />
Option A Option B<br />
Sales revenue Rs. 5,00,000 Rs. 5,00,000<br />
Cost of sales 2,00,000 2,00,000<br />
General & administrative expense 1,00,000 1,00,000<br />
Interest expenses 24,000 70,000<br />
Taxable income Rs.1,76,000 Rs.1,30,000<br />
Tax payable (30%) 52,800 39,000<br />
Net income Rs.1,23,200 Rs.91,000<br />
Equity invested 7,00,000 3,00,000<br />
1,23,200 91,000<br />
Return on Equity 7,00,000 3,00,000<br />
= 17.6% = 30.3%<br />
3,00,000 7,00,000<br />
Debt Ratio 10,00,000 10,00,000<br />
5. (a) Working Notes:<br />
(i) Calculation of Sales<br />
Fixed Assets 1<br />
�<br />
Sales 3<br />
26,00,000 1<br />
� �<br />
� Sales �Rs.78,00,000<br />
Sales 3<br />
= 0.3 = 0.7
(ii) Calculation of Current Assets<br />
Fixed Assets<br />
Current Assets<br />
13<br />
�<br />
11<br />
26,00,000 13<br />
� � � Current Assets<br />
�Rs.<br />
22,00,000<br />
Current Assets<br />
11<br />
(iii) Calculation of Raw Material Consumption and Direct Wages<br />
Sales 78,00,000<br />
Less: Gross Profit 11,70,000<br />
Works Cost 66,30,000<br />
Raw Material Consumption (20% of Works Cost) Rs. 13,26,000<br />
Direct Wages (10% of Works Cost) Rs. 6,63,000<br />
(iv) Calculation of Stock of Raw Materials (= 3 months usage)<br />
3<br />
= 13,26,000 � �Rs.<br />
3,31,500<br />
12<br />
(v) Calculation of Stock of Finished Goods (= 6% of Works Cost)<br />
6<br />
= 66,30,000 � �Rs.<br />
3,97,800<br />
100<br />
(vi) Calculation of Current Liabilities<br />
Current Assets<br />
Current Liabilities<br />
�2<br />
22,00,000<br />
Current Liabilities<br />
(vii) Calculation of Debtors<br />
Debtors<br />
Average Collection Period = �365<br />
Credit Sales<br />
Debtors<br />
78,00,000<br />
�2<br />
� Current Liabilities<br />
�Rs.<br />
11,00,000<br />
�365<br />
�60<br />
� Debtors �Rs.<br />
12,82,19<strong>1.</strong> 78 or Rs. 12,82,192<br />
(viii) Calculation of Long term Loan<br />
Long termLoan<br />
2<br />
�<br />
Current Liabilities<br />
1<br />
120<br />
Rs.
Long term loan 2<br />
� � Long term loan �Rs.<br />
22,00,000.<br />
11,00,000 1<br />
(ix) Calculation of Cash Balance<br />
Current Assets 22,00,000<br />
Less: Debtors 12,82,192<br />
Raw materials stock 3,31,500<br />
121<br />
Rs.<br />
Finished goods stock 3,97,800 20,11,492<br />
Cash balance 1,88,508<br />
(x) Calculation of Net worth<br />
Fixed Assets 26,00,000<br />
Current Assets 22,00,000<br />
Total Assets 48,00,000<br />
Less: Long term Loan 22,00,000<br />
Current Liabilities 11,00,000 33,00,000<br />
Net worth 15,00,000<br />
Net worth = Share capital + Reserves = 15,00,000<br />
Capital<br />
Reserves and Surplus<br />
1<br />
1<br />
� � Share Capital �15,00,000�<br />
�Rs.<br />
3,00,000<br />
4<br />
5<br />
4<br />
Reserves and Surplus �15,00,000�<br />
�Rs.<br />
12,00,000<br />
5<br />
Profit and Loss Account of Mahurat Limited<br />
for <strong>the</strong> year ended 31st December, 2008<br />
Particulars Rs. Particulars Rs.<br />
To Direct Materials 13,26,000 By Sales 78,00,000<br />
To Direct Wages 6,63,000<br />
To Works (Overhead)<br />
Balancing figure<br />
46,41,000<br />
To Gross Profit c/d<br />
(15% of Sales) 11,70,000 ________<br />
To Selling and Distribution<br />
Expenses (Balancing figure)<br />
78,00,000 78,00,000<br />
5,46,000 By Gross Profit<br />
b/d<br />
11,70,000<br />
To Net Profit (8% of Sales) 6,24,000 ________<br />
11,70,000 11,70,000
Balance Sheet of Mahurat Limited<br />
as on 31st December, 2008<br />
Liabilities Rs. Assets Rs.<br />
Share Capital 3,00,000 Fixed Assets 26,00,000<br />
Reserves and Surplus 12,00,000 Current Assets:<br />
Long term loans 22,00,000 Stock of Raw<br />
Material<br />
122<br />
3,31,500<br />
Current liabilities 11,00,000 Stock of Finished<br />
Goods 3,97,800<br />
6. (i) Calculation of Net Cash Flow<br />
Year Profit<br />
before<br />
dep. and<br />
tax<br />
Depreciation (20% on<br />
WDV)<br />
Debtors 12,82,192<br />
________ Cash 1,88,508<br />
48,00,000 48,00,000<br />
(Rs. in lakhs)<br />
PBT PAT Net cash<br />
flow<br />
(1) (2) (3) (4) (5) (3) + (5)<br />
1 160 400 � 20% = 80 80 40 120<br />
2 160 (400 � 80)� 20% = 64 96 48 112<br />
3 180 (320 � 64)� 20% = 5<strong>1.</strong>2 128.8 64.4 115.6<br />
4 180 (256 � 5<strong>1.</strong>2)� 20% = 40.96 139.04 69.52 110.48<br />
5 150 (204.8 � 40.96) = 163.84* �13.84 �6.92 156.92<br />
*including depreciation and loss on disposal of assets.<br />
(ii) Calculation of Net Present Value (NPV)<br />
(Rs. in lakhs)<br />
Year Net Cash<br />
12% 14% 16%<br />
Flow D.F P.V D.F P.V D.F P.V<br />
1 120 .89 106.8 .88 105.60 .86 103.2<br />
2 112 .80 89.6 .77 86.24 .74 82.88<br />
3 115.6 .71 82.08 .67 77.45 .64 73.98<br />
4 110.48 .64 70.70 .59 65.18 .55 60.76<br />
5 156.92 .57 89.44 .52 8<strong>1.</strong>60 .48 75.32<br />
438.62 416.07 396.14
Less: Initial Investment 400.00 400.00 400.00<br />
NPV 38.62 16.07 (3.86)<br />
(iii) Advise: Since Net Present Value of <strong>the</strong> project is maximum at 12% = 38.62 lakhs,<br />
<strong>the</strong>refore <strong>the</strong> project should be implemented.<br />
(iv) Calculation of Internal Rate of Return (IRR)<br />
16.07�2%<br />
IRR �14%<br />
�<br />
16.07 �(<br />
�3.86)<br />
32.14<br />
�14%<br />
�<br />
19.93<br />
= 14% + <strong>1.</strong>61% = 15.61%.<br />
7. (a) Statement showing Computation of Weighted Average Cost of Capital by<br />
using Book Value Proportions<br />
Source of Finance Amount<br />
(Book value)<br />
(Rs. in<br />
crores)<br />
Weight<br />
(Book<br />
value<br />
proportion)<br />
123<br />
Cost of Capital Weighted<br />
Cost of<br />
Capital<br />
(a) (b) (c)= (a)x(b)<br />
Equity capital 15 0.256 0.16<br />
(Refer to working note 1)<br />
0.04096<br />
11% Preference<br />
capital<br />
1 0.017 0.1543<br />
(Refer to working note 2)<br />
0.00262<br />
Retained earnings 20 0.342 0.16<br />
(Refer to working note 1)<br />
0.05472<br />
13.5% Debentures 10 0.171 0.127<br />
(Refer to working note 3)<br />
0.02171<br />
15% term loans 12.5 0.214 0.09 0.01926<br />
____ ____ (Refer to working note 4) ________<br />
58.5 <strong>1.</strong>00 0.013927<br />
Weighted Average Cost of Capital 13.93%<br />
(b) Statement showing Computation of Weighted Average Cost of Capital by<br />
using Market Value Proportions<br />
Source of Finance Amount<br />
(Rs. in crores)<br />
Weight<br />
(Market<br />
value<br />
proportions)<br />
Cost of Capital Weighted<br />
Cost of<br />
Capital<br />
(a) (b) (c)=(a)x(b)<br />
Equity capital 60.00 0.739 0.16 0.11824
(Rs. <strong>1.</strong>5 crores x Rs. 40) (Refer to working note 1)<br />
11% Preference capital 0.75 0.009 0.1543 0.00138<br />
(Rs. 1 lakh x Rs. 75) (Refer to working note 2)<br />
13.5% Debentures 8.00 0.098 0.127 0.01245<br />
(Rs. 10 lakhs x Rs. 80) (Refer to working note 3)<br />
15% Term loans 12.50 0.154 0.09 0.01386<br />
____ ____ (Refer to working note 4) ________<br />
8<strong>1.</strong>25 <strong>1.</strong>00 0.14593<br />
Weighted Average Cost of Capital 14.59%<br />
Note: Since retained earnings are treated as equity capital for purposes of calculation of<br />
cost of specific source of finance, <strong>the</strong> market value of <strong>the</strong> ordinary shares may be taken<br />
to represent <strong>the</strong> combined market value of equity shares and retained earnings. The<br />
separate market values of retained earnings and ordinary shares may also be worked out<br />
by allocating to each of <strong>the</strong>se a percentage of total market value equal to <strong>the</strong>ir<br />
percentage share of <strong>the</strong> total based on book value.<br />
Working Notes:<br />
<strong>1.</strong> Cost of Equity Capital and Retained Earnings (Ke)<br />
D �<br />
1<br />
Ke = g<br />
P0<br />
Where,<br />
Ke = Cost of equity capital<br />
D1 = Expected dividend at <strong>the</strong> end of year 1<br />
P0 = Current market price of equity share<br />
g = Growth rate of dividend<br />
Now, it is given that D1 = Rs. 3.60, P0 = Rs. 40 and g= 7%<br />
Rs. 3.60<br />
�<br />
Rs. 40<br />
Therefore, Ke = 0.<br />
07<br />
or Ke = 16%<br />
2. Cost of Preference Capital (Kp)<br />
Where,<br />
Kp =<br />
�� F P�<br />
D �<br />
�<br />
� n �<br />
�<br />
�� F P�<br />
�<br />
� 2 �<br />
�<br />
D = Preference dividend<br />
124
F = Face value of preference shares<br />
P = Current market price of preference shares<br />
N = Redemption period of preference shares<br />
Now, it is given that D= 11%, F=Rs. 100, P= Rs. 75 and n= 10 years<br />
�Rs.<br />
100 – Rs. 75�<br />
11�<br />
�<br />
� 10 �<br />
�<br />
�Rs. 100 �Rs.<br />
75�<br />
�<br />
� 2 �<br />
�<br />
Therefore Kp = �100<br />
3. Cost of Debentures (Kd)<br />
Where,<br />
Kd =<br />
= 15.43 %<br />
�� F P�<br />
r(<br />
1�t<br />
)<br />
�<br />
� n �<br />
�<br />
�� F P�<br />
�<br />
� 2 �<br />
�<br />
r = Rate of interest<br />
t = Tax rate applicable to <strong>the</strong> company<br />
F = Face value of debentures<br />
P = Current market price of debentures<br />
n = Redemption period of debentures<br />
Now it is given that r= 13.5%, t=40%, F=Rs. 100, P=Rs. 80 and n=6 years<br />
�Rs.<br />
100 – Rs. 80�<br />
13.<br />
5(<br />
1�0<br />
. 40)<br />
�<br />
�<br />
� 6 �<br />
�<br />
�Rs. 100 �Rs.<br />
80�<br />
�<br />
� 2 �<br />
�<br />
Therefore, Kd = �100<br />
4. Cost of Term Loans (Kt)<br />
Where,<br />
Kt = r (1 – t)<br />
= 12.70%<br />
r = Rate of interest on term loans<br />
t = Tax rate applicable to <strong>the</strong> company<br />
Now, r = 15% and t= 40%<br />
Therefore, Kt = 15% (1 – 0.40) = 9%<br />
125
8. (a) Profitability Ratios<br />
Profitability ratios measure how effective a firm is at generating profit from<br />
operations. They are some of <strong>the</strong> most closely watched and widely quoted financial<br />
ratios. Management attempts to maximize <strong>the</strong>se ratios to maximize firm value.<br />
(i) Gross margin measures <strong>the</strong> percentage of each sale in rupees remaining after<br />
payment for <strong>the</strong> goods sold.<br />
Gross profit Rs. 18,108<br />
Gross margin � � �3<strong>1.</strong>09%.<br />
Net sales Rs. 58,247<br />
Remember that gross profit is equal to net sales minus cost of goods sold.<br />
(ii) Profit margin finds <strong>the</strong> proportion of revenue that finds its way into profits. Profit<br />
margin is calculated as net income divided by net sales, as shown below:<br />
Net income after interest and taxes Rs. 3,664<br />
Profit margin �<br />
� �6.29%.<br />
Net sales<br />
Rs. 58,247<br />
(iii) Operating profit margin measures <strong>the</strong> percentage of each sales in rupees that<br />
remains after <strong>the</strong> payment of all costs and expenses except for interest and taxes.<br />
This ratio is followed closely by analysts because it focuses on operating results.<br />
Operating profit is often referred to as earnings before interest and taxes or EBIT.<br />
Operatingprofit<br />
Rs. 5,830<br />
Operating profit margin �<br />
� �10.01%.<br />
Net sales Rs. 58,247<br />
(iv) Return on assets (return on investment) measures <strong>the</strong> percentage return<br />
generated on <strong>the</strong> assets available (investment). This ratio may be calculated as:<br />
Net income after interest and taxes Rs. 3,664<br />
Return on assets �<br />
� �12.99%.<br />
Average total assets Rs. 28,203<br />
Average total assets<br />
(Ending total assets �Beginning<br />
total assets)<br />
�<br />
2<br />
(Rs. 30,011�Rs.26,394)<br />
�<br />
2<br />
= Rs. 28,203.<br />
(v) Return on equity measures <strong>the</strong> percentage return generated to equity<br />
shareholders.<br />
Net income after interest and taxes Rs. 3,664<br />
Return on equity �<br />
� �19.34%.<br />
Average shareholders'<br />
equity Rs. 18,942<br />
(EndingSE<br />
�BeginningSE)<br />
Average shareholders'<br />
equity (SE) �<br />
2<br />
126
(Rs. 19,802 �Rs.<br />
18,082)<br />
�<br />
2<br />
= Rs. 18,942.<br />
(vi) The dividend payout ratio measures <strong>the</strong> dividend paid in relation to net earnings.<br />
If Housestores Limited’s dividend for <strong>the</strong> year was Rs. 0.22, <strong>the</strong> dividend payout is<br />
calculated as:<br />
Cash dividend per share<br />
Dividend payout ratio �<br />
Earnings per share<br />
Rs. 0.22<br />
�<br />
Rs. <strong>1.</strong>57<br />
= 0.14 or 14%.<br />
(b) Asset Utilisation (Activity) Ratios<br />
Asset utilization ratios measure <strong>the</strong> time it takes to convert various assets to sales<br />
or cash. Asset utilisation ratios are used to measure <strong>the</strong> efficiency with which<br />
assets are managed. For this reason, <strong>the</strong>y are often called asset management<br />
ratios.<br />
(i) Receivables turnover measures <strong>the</strong> number of times per year <strong>the</strong> balance of<br />
receivables is collected. This is a very important measure of <strong>the</strong> efficiency with<br />
which management is managing accounts receivables.<br />
Net credit sales<br />
Receivables turnover �<br />
Average accounts receivable<br />
This ratio cannot be computed for Housestores Limited since <strong>the</strong> company does<br />
not break out <strong>the</strong> amount of credit sales.<br />
(ii) The average collection period measures <strong>the</strong> average number of days it takes to<br />
collect an account receivable. This ratio is also referred to as <strong>the</strong> number of days<br />
of receivable and <strong>the</strong> number of day’s sales in receivables.<br />
Average accounts receivable<br />
Average collection period �<br />
Average sales per day<br />
Again, this ratio cannot be calculated for Housestores Limited because <strong>the</strong><br />
company does not break out <strong>the</strong> amount of credit sales.<br />
(iii) Inventory turnover measures <strong>the</strong> efficiency with which a firm utilizes (manages)<br />
its inventory.<br />
Cost of goods sold Rs. 40,139<br />
Inventory turnover �<br />
� �5.33<br />
times<br />
Average inventory Rs. 7,532<br />
127
Average inventory<br />
(Endinginventory<br />
�Beginninginventory)<br />
�<br />
2<br />
(Rs. 8,338 �Rs.<br />
6,725)<br />
�<br />
2<br />
= Rs. 7,532.<br />
(iv) A related measure is <strong>the</strong> number of days’ sales in inventory.<br />
Average inventory<br />
Number of days' sales in inventory �<br />
Cost of goods sold / 365<br />
128<br />
Rs. 7,532<br />
�<br />
Rs. 40,139 / 365<br />
= 68.49 days.<br />
(v) Fixed asset turnover measures <strong>the</strong> efficiency with which <strong>the</strong> firm uses its fixed<br />
assets.<br />
Sales Rs. 58,247<br />
Fixed asset turnover �<br />
� �3.58<br />
times<br />
Average net fixed assets Rs. 16,272<br />
Average fixed assets<br />
(Ending fixed assets �Beginning<br />
fixed assets)<br />
�<br />
2<br />
(Rs. 17,168 �Rs.<br />
15,375)<br />
�<br />
2<br />
= Rs. 16,272.<br />
(vi) Total asset turnover measures <strong>the</strong> efficiency with which <strong>the</strong> firm uses its total<br />
assets.<br />
Sales Rs. 58,247<br />
Total asset turnover �<br />
� �2.07<br />
times<br />
Average total assets Rs. 28,203<br />
(c) Liquidity Ratios<br />
Liquidity ratios measure <strong>the</strong> firm’s ability to meet its short-term obligations as <strong>the</strong>y<br />
come due.<br />
(i) The current ratio is <strong>the</strong> most common measure of short-term liquidity. It is<br />
sometimes referred to as <strong>the</strong> working capital ratio because net working capital is<br />
<strong>the</strong> difference between current assets and current liabilities.<br />
Current assets Rs. 11,917<br />
Current ratio �<br />
� �<strong>1.</strong>48<br />
Current liabilities<br />
Rs. 8,035<br />
Where,
Current assets include cash and cash equivalents, net accounts receivable,<br />
marketable securities classified as current, inventories and prepaid expenses.<br />
Current liabilities include accounts payable, short-term notes payable, current<br />
maturities of long-term debt, unearned revenue, and o<strong>the</strong>r accrued liabilities.<br />
(ii) The quick (acid) ratio provides a more conservative measure of short-term<br />
liquidity. It takes out inventory because in times of financial difficulty inventory may<br />
be saleable only at liquidation value.<br />
Current assets �Inventory<br />
Rs. 11,917 �8,338<br />
Quick ratio �<br />
�<br />
�0.45<br />
Current liabilities<br />
Rs. 8,035<br />
(d) Debt Utilisation Ratios<br />
Debt utilisation ratios measure <strong>the</strong> effectiveness with which management finances<br />
<strong>the</strong> assets of <strong>the</strong> firm. They are used to evaluate <strong>the</strong> financial leverage of <strong>the</strong> firm.<br />
(i) The debt to total assets measures <strong>the</strong> proportion of total assets financed with<br />
debt and, <strong>the</strong>refore, <strong>the</strong> extent of financial leverage.<br />
Total liabilities<br />
Rs. 10,209<br />
Debt to total assets �<br />
� �34.02%<br />
Total assets Rs. 30,011<br />
(ii) The debt to equity ratios also measures <strong>the</strong> extent of <strong>the</strong> firm‘s financial<br />
leverage.<br />
Total liabilities<br />
Rs. 10,209<br />
Debt to equity ratio �<br />
� �5<strong>1.</strong>56%<br />
Total equity Rs. 19,802<br />
(iii) The times interest earned measures <strong>the</strong> firm‘s ability to make contractual interest<br />
payments.<br />
(e) Market Ratios<br />
Earnings before interest and taxes Rs. 5,830<br />
Times interest earned �<br />
� �157.57<br />
Interest expense<br />
Rs. 37<br />
Market ratios involve measures that consider <strong>the</strong> market value of <strong>the</strong> company’s<br />
shares.<br />
(i) The price/earnings (PE) ratio is <strong>the</strong> most commonly quoted market measure.<br />
Assuming that Housestores Limited’s share price is Rs. 34.00, <strong>the</strong> price/earnings<br />
ratio would be computed as follows:<br />
Market price per share Rs. 34<br />
Price / earnings �<br />
� �2<strong>1.</strong>66<br />
Earnings per share Rs. <strong>1.</strong>57<br />
(ii) The market / book ratio provides ano<strong>the</strong>r evaluation of how investors view <strong>the</strong><br />
company’s past and future performance. To calculate <strong>the</strong> ratio, <strong>the</strong> book value per<br />
share must first be calculated.<br />
129
Total equity<br />
Book value per share �<br />
Number of shares outstanding<br />
Rs. 19,802<br />
�<br />
2,362<br />
130<br />
�<br />
Rs. 8.38 per share<br />
Again, assuming a Rs. 34 market price per share, <strong>the</strong> market / book ratio is<br />
calculated as follows:<br />
Market value per share<br />
Market / Book ratio �<br />
Book value per share<br />
Rs. 34.00<br />
� �4.06.<br />
Rs. 8.38<br />
9. Schedule of Changes in Working Capital<br />
Current Assets<br />
March 31,<br />
2009<br />
March 31, 2008<br />
Impact on Working Capital<br />
Increase Decrease<br />
Stock 58,800 46,150 12,650 �<br />
Prepaid expenses 1,900 2,300 � 400<br />
Debtors 76,350 77,150 � 800<br />
Trade Investments 40,000 1,05,000 � 65,000<br />
Cash 77,400 95,900 � 18,500<br />
Current Liabilities<br />
2,54,450 3,26,500 12,650 84,700<br />
Creditors 28,800 27,100 � 1,700<br />
Bank overdraft 7,500 6,250 � 1,250<br />
Accrued expenses 4,350 4,600 250 �<br />
Income tax payable 48,250 16,850 � 31,400<br />
88,900 54,800 250 34,350<br />
Net Working Capital 1,65,550 2,71,700 12,900 1,19,050<br />
Decrease in net working<br />
capital 1,06,150 � 1,06,150 �<br />
2,71,700 2,71,700 1,19,050 1,19,050
Machinery Account<br />
Rs. Rs.<br />
Balance b/d 1,07,050 Sale of machinery (given) 9,150<br />
Purchase of machinery (plug) 24,350 Depreciation (given) 11,400<br />
________ Balance c/d 1,10,850<br />
1,31,400 1,31,400<br />
Trade Investments Account<br />
Rs. Rs.<br />
Balance b/d 1,05,000 Cash (sale of trade investments) 65,000<br />
_______ Balance c/d 40,000<br />
1,05,000 1,05,000<br />
Estimation of Funds flow from Operations<br />
Profit after tax<br />
Rs.<br />
51,050<br />
Add: Depreciation on Buildings 6,600<br />
Depreciation on Machinery 11,400 18,000<br />
69,050<br />
Less: Gain on sale of machinery 1,850<br />
Funds from Operations 67,200<br />
Note: Gain on sale of trade investment has been considered as an operating income.<br />
Trade investments have been considered as part of current assets.<br />
Sources:<br />
Uses:<br />
Statement of Changes in Financial Position (Working Capital basis)<br />
for <strong>the</strong> year ended March 31, 2009<br />
Funds from operations 67,200<br />
Sale of machinery on gain (9,150 + 1,850) 11,000<br />
Debentures issued (Rs. 2,40,000 – 75,000) 1,65,000<br />
Investment in ‘A’ Ltd. financial transaction and hence not affecting working capital<br />
Issue of share capital (including share premium) 1,15,000<br />
Financial Resources Provided 3,58,200<br />
Purchase of building (6,01,800 + 6,600 � 1,78,400) 4,30,000<br />
Purchase of machinery 24,350<br />
Payment of long-term loan 10,000<br />
Financial Resources Applied 4,64,350<br />
Net Decrease in Working Capital 1,06,150<br />
131<br />
Rs.
10. (a) Calculation of Effective Annual Interest Rate<br />
Effective Interest Rate (EAR) is calculated as follows:<br />
m<br />
� r �<br />
EAR = �1<br />
� � �1<br />
� m �<br />
Where,<br />
r = Stated interest rate<br />
m = Compounding frequency<br />
� 0.08 �<br />
EAR = �1<br />
� �-<br />
1<br />
� 4 �<br />
= <strong>1.</strong>0824 – 1 = 0.0824<br />
= 8.24%<br />
Effective Annual Interest Rate = 8.24%.<br />
(b) Calculation of Annual Installment<br />
10,000 = A � PVFA3,0.09<br />
10,000 = A � 2.531<br />
10,000<br />
A � �Rs.<br />
3,951<br />
2.531<br />
4<br />
By paying Rs. 3,951 each year for three years, Adit shall completely pay-off his loan<br />
with 9 per cent interest. This can be observed from <strong>the</strong> loan-amortisation schedule<br />
given under:<br />
Loan Amortisation Schedule<br />
End of Year Payment Interest Principal Outstanding<br />
Repayment Balance<br />
0 10,000<br />
1 3,951 900 3,051 6,949<br />
2 3,951 625 3,326 3,623<br />
3 3,951 326 3,625* 0<br />
*Rounding off error.<br />
He pays Rs. 3,951 at <strong>the</strong> end of each year. At <strong>the</strong> end of <strong>the</strong> first year, Rs. 900 of<br />
this amount is interest (Rs. 10,000 � 0.09), and <strong>the</strong> remaining amount (Rs. 3,051) is<br />
applied towards <strong>the</strong> repayment of principal. The balance of loan at <strong>the</strong> beginning of<br />
<strong>the</strong> second year is Rs. 6,949 (Rs. 10,000 – Rs. 3,051). As for <strong>the</strong> first year,<br />
calculations for interest and principal repayment can be made for <strong>the</strong> second and<br />
third years. At <strong>the</strong> end of <strong>the</strong> third year, <strong>the</strong> loan is completely paid-off.<br />
132
1<strong>1.</strong> (a) Computation of Effective Cost of Factoring to Konika Electronics<br />
Average level of Receivables = 3,20,00,000 � 90/360 80,00,000<br />
Factoring commission = 80,00,000 � 2/100 1,60,000<br />
Factoring reserve = 80,00,000 � 10/100 8,00,000<br />
Amount available for advance<br />
= Rs. 80,00,000 – (1,60,000+8,00,000) 70,40,000<br />
Factor will deduct his interest @ 18% :-<br />
Interest =<br />
Rs.<br />
70,<br />
40,<br />
000�18�90<br />
Rs. 3,16,800<br />
100�360<br />
Advance to be paid = Rs. 70,40,000 – Rs. 3,16,800 = Rs. 67,23,200<br />
Annual Cost of Factoring to Konika Electronics: Rs.<br />
Factoring commission (Rs. 1,60,000 � 360/90) 6,40,000<br />
Interest charges (Rs. 3,16,800 � 360/90) 12,67,200<br />
Total 19,07,200<br />
Konika Electronics’s Savings on taking Factoring Service: Rs.<br />
Cost of credit administration saved 5,00,000<br />
Cost of Bad Debts (Rs. 3,20,00,000 x <strong>1.</strong>5/100) avoided 4,80,000<br />
Total 9,80,000<br />
Net Cost to Konika Electronics (Rs. 19,07,200 – Rs. 9,80,000) 9,27,200<br />
Rs. 9,<br />
27,<br />
200�100<br />
Effective rate of interest to Konika =<br />
67,<br />
23,<br />
200<br />
13.79%*<br />
*Note: The number of days in a year has been assumed to be 360 days.<br />
(b) (i) Estimate of <strong>the</strong> Requirement of Working Capital<br />
Rs. Rs.<br />
A. Current Assets:<br />
Raw material stock<br />
(Refer to Working note 3)<br />
6,64,615<br />
Work in progress stock<br />
(Refer to Working note 2)<br />
5,00,000<br />
Finished goods stock<br />
(Refer to Working note 4)<br />
13,60,000<br />
Debtors<br />
(Refer to Working note 5)<br />
29,53,846<br />
Cash and Bank balance 25,000 55,03,461<br />
133
B. Current Liabilities:<br />
Creditors for raw materials 7,15,740<br />
(Refer to Working note 6)<br />
Creditors for wages 91,731 8,07,471<br />
(Refer to Working note 7) ________<br />
Net Working Capital (A-B) 46,95,990<br />
(ii) The Maximum Permissible Bank Finance as per Tandon Committee Norms<br />
First Method:<br />
75% of <strong>the</strong> net working capital financed by bank i.e. 75% of Rs. 46,95,990<br />
(Refer to (i) above)<br />
= Rs. 35,21,993<br />
Second Method:<br />
(75% of Current Assets)- Current liabilities (i.e. 75% of Rs. 55,03,461)-Rs. 8,07,471<br />
(Refer to (i) above)<br />
= Rs. 41,27,596 – Rs. 8,07,471<br />
= Rs. 33,20,125<br />
Working Notes:<br />
<strong>1.</strong> Annual Cost of Production<br />
Rs.<br />
Raw material requirements (1,04,000 units � Rs. 80) 83,20,000<br />
Direct wages (1,04,000 units � Rs. 30) 31,20,000<br />
Overheads (exclusive of depreciation)(1,04,000 � Rs. 60) 62,40,000<br />
1,76,80,000<br />
2. Work in progress Stock<br />
Rs.<br />
Raw material requirements (4,000 units � Rs. 80) 3,20,000<br />
Direct wages (50% � 4,000 units � Rs. 30) 60,000<br />
Overheads (50% � 4,000 units � Rs. 60) 1,20,000<br />
5,00,000<br />
3. Raw material Stock<br />
It is given that raw material in stock is average 4 weeks consumption. Since, <strong>the</strong><br />
company is newly formed, <strong>the</strong> raw material requirement for production and work in<br />
progress will be issued and consumed during <strong>the</strong> year.<br />
134
Hence, <strong>the</strong> raw material consumption for <strong>the</strong> year (52 weeks) is as follows:<br />
Rs.<br />
For Finished goods 83,20,000<br />
For Work in progress 3,20,000<br />
86,40,000<br />
Rs. 86,40,000<br />
Raw material stock �4<br />
weeks<br />
52 weeks<br />
4. Finished Goods Stock<br />
i.e. Rs. 6,64,615<br />
8,000 units @ Rs. 170 per unit = Rs. 13,60,000<br />
5. Debtors for Sale<br />
Credit allowed to debtors Average 8 weeks<br />
Credit sales for year (52 weeks) i.e. (1,04,000 units -8,000<br />
units)<br />
96,000 units<br />
Selling price per unit Rs. 200<br />
Credit sales for <strong>the</strong> year (96,000 units � Rs. 200) Rs. 1,92,00,000<br />
Debtors<br />
Rs. 1,92,00,000<br />
�8<br />
weeks<br />
52 weeks<br />
i.e Rs. 29,53,846<br />
6. Creditors for Raw material:<br />
Credit allowed by suppliers Average 4 weeks<br />
Purchases during <strong>the</strong> year (52 weeks) i.e.<br />
Rs. 93,04,615<br />
(Rs. 83,20,000 + Rs. 3,20,000 + Rs. 6,64,615)<br />
(Refer to Working notes 1,2 and 3 above)<br />
Creditors<br />
Rs. 93.04.615<br />
�4<br />
weeks<br />
52 weeks<br />
i.e Rs. 7,15,740<br />
7. Creditors for Wages<br />
Lag in payment of wages<br />
Direct wages for <strong>the</strong> year (52 weeks) i.e.<br />
(Rs. 31,20,000 + Rs. 60,000)<br />
(Refer to Working notes 1 and 2 above)<br />
Creditors<br />
135<br />
1<br />
Average 1 weeks<br />
2<br />
Rs. 31,80,000<br />
Rs. 31,80,000 1<br />
�1<br />
weeks<br />
52 weeks 2<br />
i.e. Rs. 91,731
12. (a) Traditional Phase and Modern Phase of Financial Management<br />
During <strong>the</strong> Traditional Phase, financial management was considered necessary<br />
only during occasional events such as takeovers, mergers, expansion, liquidation,<br />
etc. Also, when taking financial decisions in <strong>the</strong> organisation, <strong>the</strong> needs of outsiders<br />
(investment bankers, people who lend money to <strong>the</strong> business and o<strong>the</strong>r such<br />
people) to <strong>the</strong> business was kept in mind.<br />
Whereas, on <strong>the</strong> o<strong>the</strong>r hand, Modern Phase is still going on. The scope of financial<br />
management has greatly increased now. It is important to carry out financial<br />
analysis for a company. This analysis helps in decision-making. During this phase,<br />
many <strong>the</strong>ories have been developed regarding efficient markets, capital budgeting,<br />
option pricing, valuation models and also in several o<strong>the</strong>r important fields in<br />
financial management.<br />
(b) Liquidity Ratios and Activity Ratios<br />
Liquidity or short-term solvency means ability of <strong>the</strong> business to pay its short-term<br />
liabilities. Inability to pay-off short-term liabilities affects its credibility as well as its<br />
credit rating. Continuous default on <strong>the</strong> part of <strong>the</strong> business leads to commercial<br />
bankruptcy. Eventually such commercial bankruptcy may lead to its sickness and<br />
dissolution. Short-term lenders and creditors of a business are very much interested<br />
to know its state of liquidity because of <strong>the</strong>ir financial stake. Therefore, liquidity<br />
ratios provide information about a company’s ability to meet its short-term financial<br />
obligations.<br />
Whereas, on <strong>the</strong> o<strong>the</strong>r hand, <strong>the</strong> activity ratios, also called <strong>the</strong> Turnover ratios or<br />
Performance ratios, are employed to evaluate <strong>the</strong> efficiency with which <strong>the</strong> firm<br />
manages and utilises its assets. These ratios usually indicate <strong>the</strong> frequency of sales<br />
with respect to its assets. These assets may be capital assets or working capital or<br />
average inventory. These ratios are usually calculated with reference to sales/cost of<br />
goods sold and are expressed in terms of rate or times.<br />
(c) Debt Financing and Equity Financing<br />
Financing a business through borrowing is cheaper than using equity. This is<br />
because:<br />
� Lenders require a lower rate of return than ordinary shareholders. Debt<br />
financial securities present a lower risk than shares for <strong>the</strong> finance providers<br />
because <strong>the</strong>y have prior claims on annual income and liquidation.<br />
� A profitable business effectively pays less for debt capital than equity for<br />
ano<strong>the</strong>r reason: <strong>the</strong> debt interest can be offset against pre-tax profits before<br />
<strong>the</strong> calculation of <strong>the</strong> corporate tax, thus reducing <strong>the</strong> tax paid.<br />
� Issuing and transaction costs associated with raising and servicing debt are<br />
generally less than for ordinary shares.<br />
136
These are some of <strong>the</strong> benefits from financing a firm with debt. Still firms tend to<br />
avoid very high gearing levels. One reason is financial distress risk. This could be<br />
induced by <strong>the</strong> requirement to pay interest regardless of <strong>the</strong> cash flow of <strong>the</strong><br />
business. If <strong>the</strong> firm goes through a rough period in its business activities it may<br />
have trouble paying its bondholders, bankers and o<strong>the</strong>r creditors <strong>the</strong>ir entitlement.<br />
(d) Financial Lease and Operating Lease<br />
Financial Lease Operating Lease<br />
<strong>1.</strong> The risk and reward incident to<br />
ownership are passed on to <strong>the</strong><br />
lessee. The lessor only remains <strong>the</strong><br />
legal owner of <strong>the</strong> asset.<br />
2. The lessee bears <strong>the</strong> risk of<br />
obsolescence.<br />
3. The lessor is interested in his rentals<br />
and not in <strong>the</strong> asset. He must get his<br />
principal back along with interest.<br />
Therefore, <strong>the</strong> lease is non-<br />
4.<br />
cancellable by ei<strong>the</strong>r party.<br />
The lessor enters into <strong>the</strong> transaction<br />
only as financier. He does not bear<br />
<strong>the</strong> cost of repairs, maintenance or<br />
operations.<br />
5. The lease is usually fully paid out, that<br />
is, <strong>the</strong> single lease repays <strong>the</strong> cost of<br />
<strong>the</strong> asset toge<strong>the</strong>r with <strong>the</strong> interest.<br />
13 (a) Role of Chief Financial Officer (CFO)<br />
137<br />
The lessee is only provided <strong>the</strong> use of<br />
<strong>the</strong> asset for a certain time. Risk<br />
incident to ownership belongs wholly<br />
to <strong>the</strong> lessor.<br />
The lessee is only provided <strong>the</strong> use of<br />
asset for a certain time. Risks<br />
incidental to ownership belongs<br />
wholly to <strong>the</strong> lessor.<br />
As <strong>the</strong> lessor does not have difficulty<br />
in leasing <strong>the</strong> same asset to o<strong>the</strong>r<br />
willing lessee, <strong>the</strong> lease is kept<br />
cancellable by <strong>the</strong> lessor.<br />
Usually, <strong>the</strong> lessor bears <strong>the</strong> cost of<br />
repairs, maintenance or operations.<br />
The lease is usually non-payout,<br />
since <strong>the</strong> lessor expects to lease <strong>the</strong><br />
same asset over and over again to<br />
several users.<br />
The chief financial officer of an organisation plays an important role in <strong>the</strong><br />
company’s goals, policies, and financial success. His responsibilities include:<br />
(i) Financial analysis and planning: Determining <strong>the</strong> proper amount of funds to<br />
employ in <strong>the</strong> firm, i.e. designating <strong>the</strong> size of <strong>the</strong> firm and its rate of growth.<br />
(ii) Investment decisions: The efficient allocation of funds to specific assets.<br />
(iii) Financing and capital structure decisions: Raising funds on favourable terms as<br />
possible, i.e., determining <strong>the</strong> composition of liabilities.<br />
(iv) Management of financial resources (such as working capital).<br />
(v) Risk management: Protecting assets.
(b) Composition of ROE using Du Pont<br />
There are three components in <strong>the</strong> calculation of return on equity using <strong>the</strong> traditional<br />
DuPont model- <strong>the</strong> net profit margin, asset turnover, and <strong>the</strong> equity multiplier. By<br />
examining each input individually, <strong>the</strong> sources of a company's return on equity can be<br />
discovered and compared to its competitors.<br />
(i) Net Profit Margin: The net profit margin is simply <strong>the</strong> after-tax profit a company<br />
generates for each rupee of revenue.<br />
Net profit margin = Net Income ÷ Revenue<br />
Net profit margin is a safety cushion; <strong>the</strong> lower <strong>the</strong> margin, lesser <strong>the</strong> room for<br />
error.<br />
(ii) Asset Turnover: The asset turnover ratio is a measure of how effectively a<br />
company converts its assets into sales. It is calculated as follows:<br />
Asset Turnover = Revenue ÷ Assets<br />
The asset turnover ratio tends to be inversely related to <strong>the</strong> net profit margin; i.e.,<br />
<strong>the</strong> higher <strong>the</strong> net profit margin, <strong>the</strong> lower <strong>the</strong> asset turnover.<br />
(iii) Equity Multiplier: It is possible for a company with terrible sales and margins to<br />
take on excessive debt and artificially increase its return on equity. The equity<br />
multiplier, a measure of financial leverage, allows <strong>the</strong> investor to see what portion<br />
of <strong>the</strong> return on equity is <strong>the</strong> result of debt. The equity multiplier is calculated as<br />
follows:<br />
Equity Multiplier = Assets ÷ Shareholders’ Equity.<br />
Calculation of Return on Equity<br />
To calculate <strong>the</strong> return on equity using <strong>the</strong> DuPont model, simply multiply <strong>the</strong> three<br />
components (net profit margin, asset turnover, and equity multiplier.)<br />
Return on Equity = Net profit margin× Asset turnover × Equity multiplier<br />
(c) Trading on Equity<br />
The term ‘trading on equity’ is derived from <strong>the</strong> fact that debts are contracted and<br />
loans are raised mainly on <strong>the</strong> basis of equity capital. Those who provide debt have<br />
a limited share in <strong>the</strong> firm’s earnings and hence want to be protected in terms of<br />
earnings and values represented by equity capital. Since fixed charges do not vary<br />
with <strong>the</strong> firms earnings before interest and tax, a magnified effect is produced on<br />
earnings per share. Whe<strong>the</strong>r <strong>the</strong> leverage is favourable in <strong>the</strong> sense increase in<br />
earnings per share more proportionately to <strong>the</strong> increased earnings before interest<br />
and tax depends on <strong>the</strong> profitability of investment proposals. If <strong>the</strong> rate of return on<br />
investment exceeds <strong>the</strong>ir explicit cost financial leverage is said to be positive.<br />
In o<strong>the</strong>r words, it can be stated that trading on equity means using borrowed funds<br />
to generate returns in anticipation that <strong>the</strong> return would be more than <strong>the</strong> interest<br />
paid on those funds. Therefore, trading on equity occurs when a company uses<br />
138
onds, preference shares or any o<strong>the</strong>r type of debt to increase its earnings on<br />
equity shares. For example, a company may use long term debt to purchase assets<br />
that are expected to generate earnings more than <strong>the</strong> interest on <strong>the</strong> debt. The<br />
earnings in excess of <strong>the</strong> interest on <strong>the</strong> debt will increase <strong>the</strong> earnings of <strong>the</strong><br />
company’s equity shareholders. This increase in earnings indicates that <strong>the</strong><br />
company was successful in trading on equity.<br />
(d) External Commercial Borrowings (ECBs)<br />
External Commercial Borrowings (ECBs) refer to commercial loans (in <strong>the</strong> form of<br />
bank loans, buyers credit, suppliers credit, securitised instruments ( e.g. floating<br />
rate notes and fixed rate bonds) availed from non-resident lenders with minimum<br />
average maturity of 3 years. Borrowers can raise ECBs through internationally<br />
recognised sources like (i) international banks, (ii) international capital markets, (iii)<br />
multilateral financial institutions such as <strong>the</strong> IFC, ADB etc, (iv) export credit<br />
agencies, (v) suppliers of equipment, (vi) foreign collaborators and (vii) foreign<br />
equity holders.<br />
External Commercial Borrowings can be accessed under two routes viz (i)<br />
Automatic route and (ii) Approval route. Under <strong>the</strong> Automatic route <strong>the</strong>re is no need<br />
to take <strong>the</strong> RBI/Government approval whereas such approval is necessary under<br />
<strong>the</strong> Approval route. Company’s registered under <strong>the</strong> Companies Act and NGOs<br />
engaged in micro finance activities are eligible for <strong>the</strong> Automatic Route whereas<br />
Financial Institutions and Banks dealing exclusively in infrastructure or export<br />
finance and <strong>the</strong> ones which had participated in <strong>the</strong> textile and steel sector<br />
restructuring packages as approved by <strong>the</strong> government are required to take <strong>the</strong><br />
Approval Route.<br />
139


