Reading Test 1 - Rising Stars
Reading Test 1 - Rising Stars
Reading Test 1 - Rising Stars

You also want an ePaper? Increase the reach of your titles
YUMPU automatically turns print PDFs into web optimized ePapers that Google loves.
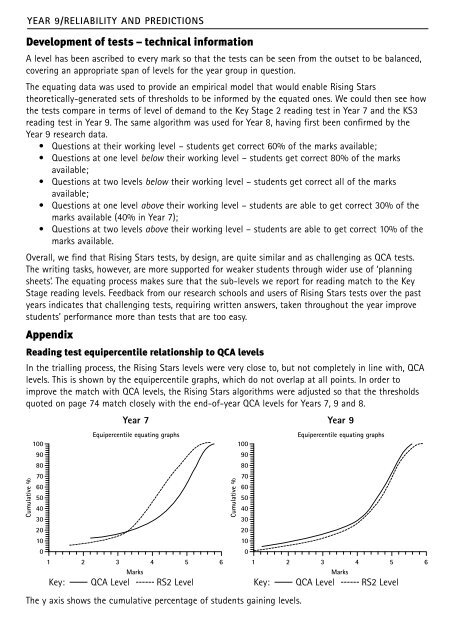
YEAR 9/RELIABILITY AND PREDICTIONSDevelopment of tests – technical informationA level has been ascribed to every mark so that the tests can be seen from the outset to be balanced,covering an appropriate span of levels for the year group in question.The equating data was used to provide an empirical model that would enable <strong>Rising</strong> <strong>Stars</strong>theoretically-generated sets of thresholds to be informed by the equated ones. We could then see howthe tests compare in terms of level of demand to the Key Stage 2 reading test in Year 7 and the KS3reading test in Year 9. The same algorithm was used for Year 8, having first been confirmed by theYear 9 research data.• Questions at their working level – students get correct 60% of the marks available;• Questions at one level below their working level – students get correct 80% of the marksavailable;• Questions at two levels below their working level – students get correct all of the marksavailable;• Questions at one level above their working level – students are able to get correct 30% of themarks available (40% in Year 7);• Questions at two levels above their working level – students are able to get correct 10% of themarks available.Overall, we find that <strong>Rising</strong> <strong>Stars</strong> tests, by design, are quite similar and as challenging as QCA tests.The writing tasks, however, are more supported for weaker students through wider use of ‘planningsheets’. The equating process makes sure that the sub-levels we report for reading match to the KeyStage reading levels. Feedback from our research schools and users of <strong>Rising</strong> <strong>Stars</strong> tests over the pastyears indicates that challenging tests, requiring written answers, taken throughout the year improvestudents’ performance more than tests that are too easy.Appendix<strong>Reading</strong> test equipercentile relationship to QCA levelsIn the trialling process, the <strong>Rising</strong> <strong>Stars</strong> levels were very close to, but not completely in line with, QCAlevels. This is shown by the equipercentile graphs, which do not overlap at all points. In order toimprove the match with QCA levels, the <strong>Rising</strong> <strong>Stars</strong> algorithms were adjusted so that the thresholdsquoted on page 74 match closely with the end-of-year QCA levels for Years 7, 9 and 8.Cumulative %1009080706050403020100Year 7Equipercentile equating graphs1 2 3 4 5 6MarksKey: QCA Level RS2 LevelThe y axis shows the cumulative percentage of students gaining levels.Cumulative %1009080706050403020100Year 9Equipercentile equating graphs1 2 3 4 5 6MarksKey: QCA Level RS2 Level