
You also want an ePaper? Increase the reach of your titles
YUMPU automatically turns print PDFs into web optimized ePapers that Google loves.
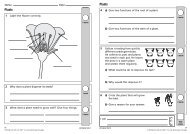
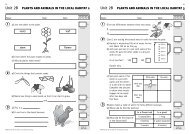
U N I T 3ATeeth and eating 3Name: Class: Date:1How are these two teeth different?☺☹11 mark2What is the mass of this tooth?21 markg1 g2g 3g 4g 5g 6g 7g 8g 9g 10 g3Ali and Carys test how different amounts of sugaraffect teeth. They put teeth into water and add sugar.a) Write down two things they must keep the same to help make theirtest fair.i)ii)b) What thing do they change in their test?2 marks1 mark3a3bTotal forthis pagePage 1 of 2©<strong>Rising</strong> <strong>Stars</strong> UK Ltd 2008. You may photocopy this page.
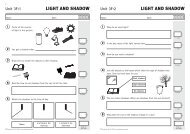
U N I T 3ATeeth and eating 34Ali and Carys make a bar chart of their results.10How sugar affects teeth☺☹987Level of decay65432100 1 2 3 4 5Spoons of sugara) How many spoons of sugar give a decay level of 8?b) Draw the bar for the decay level for 3 spoons of sugar.c) What does the bar chart show?1 mark1 mark4a4b2 marks4cd) Ben says that eating a little bit of sugar is not bad for your teeth.Use the graph to explain if he is right or not.1 mark4d©<strong>Rising</strong> <strong>Stars</strong> UK Ltd 2008. You may photocopy this page. Page 2 of 2/10Total forthis test
U N I T 3ATeeth and eating 42Savas brushes his teeth in the morning and at night.Give two other ways he can look after his teeth.i)☺☹2 marks23ii)What substance causes tooth decay?34a) Choose one word from the boxes to finish the two sentences.1 markcaninesmolarsincisorsi) A lion tears off meat.Lions need strong .2 marks4aii) A sheep bites off grass.Sheep need very sharp .b) Humans need all three kinds of teeth because.1 mark4b/10Total forthis testPage 2 of 2©<strong>Rising</strong> <strong>Stars</strong> UK Ltd 2008. You may photocopy this page.
Answers and mark schemes for Tests 1–33A 1 Teeth and eatingMark Extra information1aba suitable food added to each group, e.g.pasta or cakesfish or poultryany fruit22three groups for both markstwo groups 1 markthree labels joined correctly 2 marksone label joined correctly 1 markfood for growthfood for activity2 an incisor1cut and/or bite1front13aba description involving another tooth growinga description making it clear that another toothwill not grow4 any one from:1get rid of loose food; remove plaque;clean teeth; stop decay; prevent gum disease113A 2 Teeth and eatingMark Extra information1 activity1growth12 any one from:1brush your teeth; visit the dentist; floss;chew sugar-free gumaccept keep our bodies goingaccept healing3 2 three labels joined correctly 2 marksone label joined correctly 1 mark4abcincisorscaninescanine — tears or rips foodmolar — grinds foodincisor — cuts or bites foodmolars5 2 three labels joined correctly 2 marksone label joined correctly 1 mark111accept chews foodeats only plantseats plants and meateats only meat
3A 3 Teeth and eatingMark Extra information1 a relevant difference, e.g. single or double root, 1single or double tooth, one twice as big asother, one flat on top, the other pointed2 713ab4abcdany two from:same amount of water or temperature or placeor time in waterthe amount of sugarfive spoonfuls5the more sugar there is, the more decay thereis or the less sugar, the less decayyes — a small amount causes only a smallamount of decayno — even a small amount of sugar causesdecay21 do not accept sugar on its own1121a bar in the range 4 to 6accept a lot of sugar causes decay for1 markeither yes or no with appropriatejustification
The marks and level thresholds for Year 3Mark ranges for sub-levels for all six summative Test 4s (end-of-year tests)2c 2b 2a 3c 3b 3a 4c 4b 4a*15–19 20–25 26–30 31–35 36–41 42–46 47–51 52–57 58–60* For marks between 8 and 14 award a level 1aTopic ATeeth and eatingNC level Test 1 Test 2 Test 3 Test 41 0 0 0 02 3 3 5 23 7 7 3 64 0 0 2 2Overall mark ranges for sub-levels for Tests 1-4Mark ranges for sub-levels for Test 1 (prior learning)2c 2b 2a 3c 3b 3a 4c 4b 4a3 4 5 6 6 7 8 9 10Mark ranges for sub-levels for Test 2 (knowledge and understanding)2c 2b 2a 3c 3b 3a 4c 4b 4a2 3 4 5 6 7 8 9 10Mark ranges for sub-levels for Test 3 (mainly Sc1)2c 2b 2a 3c 3b 3a 4c 4b 4a3 4 5 6 6 7 8 9 10Mark ranges for sub-levels for Test 4 (part of end-of-year summative Test 4s)2c 2b 2a 3c 3b 3a 4c 4b 4a2 3 4 5 6 7 8 9 10Mark ranges for sub-levels for summative Tests 2 and 32c 2b 2a 3c 3b 3a 4c 4b 4a6 7–8 9–10 11 12–13 14–15 16 17–18 19–20
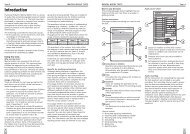
Reliability and predictionsThe first and most critical step in producing high-quality tests is to ensure that each questionaddresses the part of the topic that has been taught. Equally importantly, a reliable level needs to beattributed to every mark. Finally, every test must cover the content of the topic in a fair and balancedmanner. That is, it should contain some easy, some medium and some hard questions. It is thenpossible to work out a set of theoretical pass mark thresholds and these are discussed below. Theoryand practice must come together, however, and the <strong>Rising</strong> <strong>Stars</strong> tests need to be standardised andlinked to the National Curriculum levels established by QCA for the tests to be reliable and valid.These equated sub-levels are given on pages 59–62.Standardising the tests<strong>Rising</strong> <strong>Stars</strong> conducted research with a sample of schools in April, May and June 2008. Pupils sat anumber of the end-of-year tests in science (i.e. the Test 4s) of the topics they had been taught thatyear. The scores the pupils obtained on each test were used to generate an overall score – equivalentto taking all six end-of-year tests for the year.In Year 6, this score was then standardised by equating to the results the pupils obtained in the KS2national tests.In other years, the standardisation process involved averaging sub-levels obtained from the QCAoptional tests in mathematics, reading and writing and equating to them. (In Year 1, this was teacherassessment.)This method was chosen to provide an externally validated test-based comparison for the levels. Inaddition, a check was made in each year of the average science teacher assessment to this averagelevel of the combined reading, writing and mathematics levels from the optional tests. See theAppendix for further details. There is a strong similarity, year on year, but as all teachers know, somechildren are more talented at science than English or mathematics. This difference will be highlightedby the teacher’s own assessment, which draws on a wider range of information and evidence.The table below summarises the number of schools and pupils participating in the research.Year 1 2 3 4 5 6Number of pupils 238 256 303 301 386 483Number of schools 8 9 8 7 8 10Some of the schools were unable to complete the research or could only provide partial data.Consequently, the final sample was approximately one third of the above numbers in each year.Teachers and pupils in the schools also commented on the language, illustrations and suitability of thequestions in the tests. A number of the questions were refined and improved thanks to this advice.The equating data for the end-of-year testsThe raw scores from the schools for the end-of-year tests (Test 4s) were collated and equated to theaverage of the sub-levels and reported by the schools for the relevant year. These standardisingexercises were undertaken by an independent specialist, who for many years undertook similar workfor QCA.
YEAR 3/RELIABILITY AND PREDICTIONSStandardisation of tests – technical informationThe equating data was used to validate an algorithm that could then be applied to Tests 1, 2 and 3.This algorithm is shown below. The algorithm works on the understanding that pupils will do better oneasier questions and score less well on harder ones.• Questions at their working level – pupils get correct 50% of the marks available;• Questions at one level below their working level – pupils get correct 70% of the marksavailable;• Questions at two levels below their working level – pupils get correct all of the marks available;• Questions at one level above their working level – pupils are able to get correct 20% of themarks available;• Questions at two levels above their working level – are too hard for pupils and they get correctnone of the marks available.By applying the above algorithm to the test scores, they can be translated into a consistent set ofindicative levels and sub-levels from a standardised theoretical base.A word of warningLevel threshold information is provided for all tests, but it is recommended that at least two tests –e.g. Tests 2 and 3 – be used to ensure there is sufficient coverage and balance for a valid and reliablesummative level for the topic.AppendixComparison of science levels and the average of reading, writing and mathematicsThe table below is a comparison of the average science TA sub-levels with the average sub-level ofreading, writing and mathematics obtained from the QCA optional tests in Years 2 to 5 and betweenKS2 levels in Year 6. The sub-levels are expressed as decimals as follows:• sub-level a being worth 0.7;• sub-level b being worth 0.3;• sub level c being the whole number for the level.There is close agreement between the two sets of averages. The pattern also shows a steady increasein levels from Year 1 to Year 6, as might be expected. Note that the level for Year 1 is close to 2. Thissuggests rapid progress in Year 1 or pupils now start school with a significant amount of priorlearning.YearAverage science TA sub-levelAverage English andmathematics sub-level1 1.84 1.802 2.08 2.083 2.98 2.874 3.25 3.065 3.99 4.036 4.59 4.48
YEAR 3/RELIABILITY AND PREDICTIONSPercentiles and standard scores for end-of-year science Test 4sThe standard score and percentile table below shows the distribution of marks and provides relativeinformation about a pupil’s performance against his or her year group. Standard scores greater than115 are well above average, while those less than 85 are well below average.Standard score 70 80 85 90 100 110 115 120 130Percentile 2% 9% 16% 26% 50% 74% 84% 91% 98%End-of-year testscore (out of 60marks)10 17 18 24 30 36 37 42 48This combined end-of-year Test 4s has a reasonably good correlation of pupils' levels with their testscore giving Pearson's r= 0.44 and a reasonably good correlation of pupils' science TA levels with theirtest score giving Pearson's r= 0.48. There was a fairly weak correlation between pupils' ages and theirtest score, giving Pearson's r=0.25.Overall, the tests have a number of fairly easy marks. They also contain a significant proportion ofdemanding marks, however, which enable the tests to differentiate able pupils.QCAlevel5.004.003.002.001.000.00QCA level equated with RS test mark0.00 10.00 20.00 30.00 40.00 50.00 60.00RS test mark