
Create successful ePaper yourself
Turn your PDF publications into a flip-book with our unique Google optimized e-Paper software.
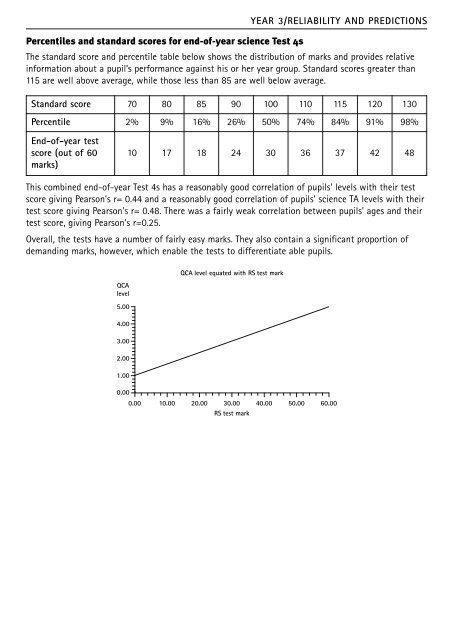
YEAR 3/RELIABILITY AND PREDICTIONSPercentiles and standard scores for end-of-year science Test 4sThe standard score and percentile table below shows the distribution of marks and provides relativeinformation about a pupil’s performance against his or her year group. Standard scores greater than115 are well above average, while those less than 85 are well below average.Standard score 70 80 85 90 100 110 115 120 130Percentile 2% 9% 16% 26% 50% 74% 84% 91% 98%End-of-year testscore (out of 60marks)10 17 18 24 30 36 37 42 48This combined end-of-year Test 4s has a reasonably good correlation of pupils' levels with their testscore giving Pearson's r= 0.44 and a reasonably good correlation of pupils' science TA levels with theirtest score giving Pearson's r= 0.48. There was a fairly weak correlation between pupils' ages and theirtest score, giving Pearson's r=0.25.Overall, the tests have a number of fairly easy marks. They also contain a significant proportion ofdemanding marks, however, which enable the tests to differentiate able pupils.QCAlevel5.004.003.002.001.000.00QCA level equated with RS test mark0.00 10.00 20.00 30.00 40.00 50.00 60.00RS test mark