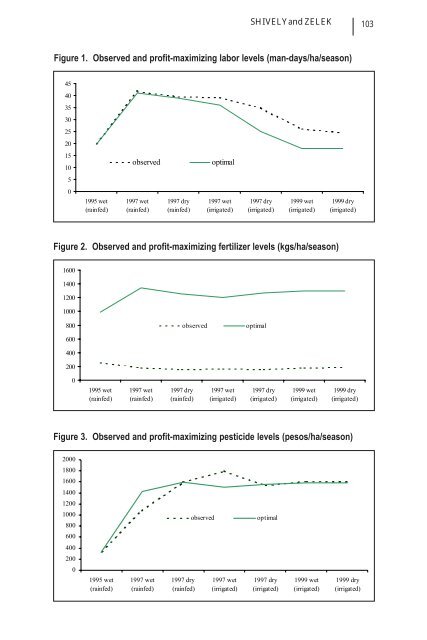
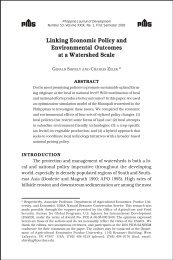
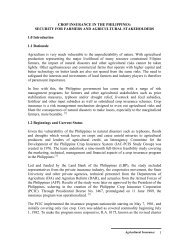
102 PHILIPPINE JOURNAL OF DEVELOPMENTacross all site, year, season, and irrigation comb<strong>in</strong>ations. In conduct<strong>in</strong>g thisexercise us<strong>in</strong>g results of Model 3, we implicitly assume that the bs <strong>in</strong> equations(5) to (7) are time-<strong>in</strong>variant. In other words, any computed adjustments <strong>in</strong>the optimal levels of <strong>in</strong>puts are driven by either changes <strong>in</strong> price ratios, orelements of a, which <strong>in</strong> this case <strong>in</strong>cludes change <strong>in</strong> season, year, and irrigationstatus.The computed <strong>in</strong>put demands suggest that, prior to irrigation, optimalra<strong>in</strong>y season <strong>in</strong>put demands were much higher than dry season <strong>in</strong>putdemands. Post-irrigation <strong>in</strong>put demands <strong>in</strong> the ra<strong>in</strong>y and dry seasons werevirtually identical. Observed and predicted yields follow similar patterns. Weconclude that a dramatic rise <strong>in</strong> dry season productivity <strong>in</strong> the sampleprecipitated the observed <strong>in</strong>crease <strong>in</strong> cropp<strong>in</strong>g <strong>in</strong>tensity, which rose <strong>from</strong>1.04 <strong>in</strong> 1995 to 1.77 <strong>in</strong> 1999. 5Previous researchers have argued that, even though irrigation may nothave a “built-<strong>in</strong>” bias aga<strong>in</strong>st labor, farmers who have access to irrigation alsotend to adopt labor-sav<strong>in</strong>g methods such as mechanization or chemical-basedweed control (L<strong>in</strong>gard 1994; Coxhead and Jayasuriya 1986). Our results areconsistent with this view of a technology-<strong>in</strong>duced bias. We f<strong>in</strong>d strong empiricalevidence that per-hectare labor use decreased follow<strong>in</strong>g irrigation. Observedlevels of fertilizer and pesticide use rose slightly follow<strong>in</strong>g irrigation. Irrigationprecipitated the release of labor and an <strong>in</strong>crease <strong>in</strong> the use of fertilizers andpesticides. However, our data show that <strong>in</strong> the aggregate, labor use <strong>in</strong>creasedon an annual basis due to the rise <strong>in</strong> the <strong>in</strong>cidence of multiple crop. In thisrespect, irrigation <strong>in</strong>creased overall annual farm employment while at thesame time seasonal labor shedd<strong>in</strong>g took place.Insights <strong>in</strong>to the observed and optimal outcomes are provided bycompar<strong>in</strong>g <strong>in</strong>put demands and yields under profit maximization with thoseactually observed. These comparisons are displayed graphically <strong>in</strong> figures 1to 4. Figure 1 shows labor use across years and seasons. Although average andprofit-maximiz<strong>in</strong>g labor levels were virtually identical on ra<strong>in</strong>fed farms <strong>in</strong>1995, follow<strong>in</strong>g irrigation adoption, observed levels of labor use exceededthose that are profit maximiz<strong>in</strong>g. <strong>Data</strong> displayed <strong>in</strong> Figure 2 show that,regardless of irrigation status, fertilizer was consistently under appliedcompared with profit-maximiz<strong>in</strong>g levels. Figure 3 shows that pesticides wereunderapplied on ra<strong>in</strong>fed farms; overapplied on 1997 irrigated farms; andthen applied <strong>in</strong> nearly profit-maximiz<strong>in</strong>g levels on 1999 irrigated farms. Whileit is possible that changes <strong>in</strong> relative <strong>in</strong>put-<strong>in</strong>put and <strong>in</strong>put-output prices5In 1995, the most popular crop grown <strong>in</strong> the area was corn. By 1999 virtually all corn hadall disappeared <strong>from</strong> the study site. Observations for corn production are not <strong>in</strong>cluded <strong>in</strong> thisanalysis. Their omission results <strong>in</strong> a small sample size for 1995 (see Table 1), s<strong>in</strong>ce themajority of parcels <strong>in</strong> that year - even those planted <strong>in</strong> the ra<strong>in</strong>y season - were used for cornproduction. For more discussion on the topic, see Mart<strong>in</strong>ez and Shively (1998).
SHIVELY and ZELEK103Figure 1. Observed and profit-maximiz<strong>in</strong>g labor levels (man-days/ha/season)4540353025201510observedoptimal501995 wet(ra<strong>in</strong>fed)1997 wet(ra<strong>in</strong>fed)1997 dry(ra<strong>in</strong>fed)1997 wet(irrigated)1997 dry(irrigated)1999 wet(irrigated)1999 dry(irrigated)Figure 2. Observed and profit-maximiz<strong>in</strong>g fertilizer levels (kgs/ha/season)1600140012001000800observedoptimal60040020001995 wet(ra<strong>in</strong>fed)1997 wet(ra<strong>in</strong>fed)1997 dry(ra<strong>in</strong>fed)1997 wet(irrigated)1997 dry(irrigated)1999 wet(irrigated)1999 dry(irrigated)Figure 3. Observed and profit-maximiz<strong>in</strong>g pesticide levels (pesos/ha/season)200018001600140012001000800600observedoptimal40020001995 wet(ra<strong>in</strong>fed)1997 wet(ra<strong>in</strong>fed)1997 dry(ra<strong>in</strong>fed)1997 wet(irrigated)1997 dry(irrigated)1999 wet(irrigated)1999 dry(irrigated)