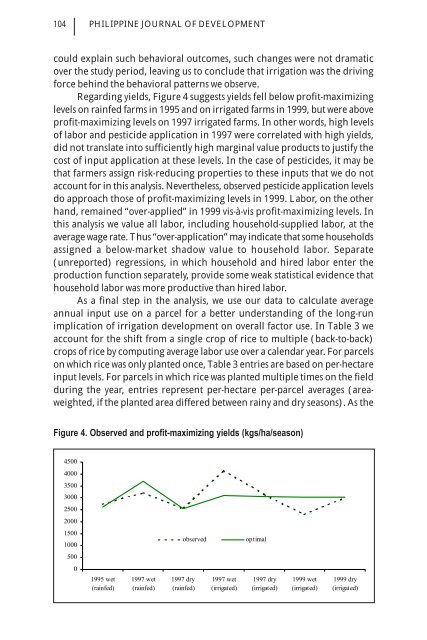
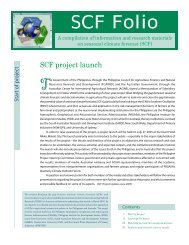
104 PHILIPPINE JOURNAL OF DEVELOPMENTcould expla<strong>in</strong> such behavioral outcomes, such changes were not dramaticover the study period, leav<strong>in</strong>g us to conclude that irrigation was the driv<strong>in</strong>gforce beh<strong>in</strong>d the behavioral patterns we observe.Regard<strong>in</strong>g yields, Figure 4 suggests yields fell below profit-maximiz<strong>in</strong>glevels on ra<strong>in</strong>fed farms <strong>in</strong> 1995 and on irrigated farms <strong>in</strong> 1999, but were aboveprofit-maximiz<strong>in</strong>g levels on 1997 irrigated farms. In other words, high levelsof labor and pesticide application <strong>in</strong> 1997 were correlated with high yields,did not translate <strong>in</strong>to sufficiently high marg<strong>in</strong>al value products to justify thecost of <strong>in</strong>put application at these levels. In the case of pesticides, it may bethat farmers assign risk-reduc<strong>in</strong>g properties to these <strong>in</strong>puts that we do notaccount for <strong>in</strong> this analysis. Nevertheless, observed pesticide application levelsdo approach those of profit-maximiz<strong>in</strong>g levels <strong>in</strong> 1999. Labor, on the otherhand, rema<strong>in</strong>ed “over-applied” <strong>in</strong> 1999 vis-à-vis profit-maximiz<strong>in</strong>g levels. Inthis analysis we value all labor, <strong>in</strong>clud<strong>in</strong>g household-supplied labor, at theaverage wage rate. Thus “over-application” may <strong>in</strong>dicate that some householdsassigned a below-market shadow value to household labor. Separate(unreported) regressions, <strong>in</strong> which household and hired labor enter theproduction function separately, provide some weak statistical evidence thathousehold labor was more productive than hired labor.As a f<strong>in</strong>al step <strong>in</strong> the analysis, we use our data to calculate averageannual <strong>in</strong>put use on a parcel for a better understand<strong>in</strong>g of the long-runimplication of irrigation development on overall factor use. In Table 3 weaccount for the shift <strong>from</strong> a s<strong>in</strong>gle crop of rice to multiple (back-to-back)crops of rice by comput<strong>in</strong>g average labor use over a calendar year. For parcelson which rice was only planted once, Table 3 entries are based on per-hectare<strong>in</strong>put levels. For parcels <strong>in</strong> which rice was planted multiple times on the fielddur<strong>in</strong>g the year, entries represent per-hectare per-parcel averages (areaweighted,if the planted area differed between ra<strong>in</strong>y and dry seasons). As theFigure 4. Observed and profit-maximiz<strong>in</strong>g yields (kgs/ha/season)45004000350030002500200015001000observedoptimal50001995 wet(ra<strong>in</strong>fed)1997 wet(ra<strong>in</strong>fed)1997 dry(ra<strong>in</strong>fed)1997 wet(irrigated)1997 dry(irrigated)1999 wet(irrigated)1999 dry(irrigated)
SHIVELY and ZELEK105f<strong>in</strong>al column of Table 3 <strong>in</strong>dicates, virtually no dry-season cropp<strong>in</strong>g was observed<strong>in</strong> 1995. By 1999, 77 percent of parcels were planted <strong>in</strong> both ra<strong>in</strong>y and dryseasons. In read<strong>in</strong>g Table 3, it is important to note that data <strong>in</strong> the f<strong>in</strong>alcolumn reflect the <strong>in</strong>crease <strong>in</strong> cropp<strong>in</strong>g <strong>in</strong>tensity.In the case of labor, <strong>from</strong> 1995 to 1997 annual labor use <strong>in</strong>creased by afactor of 3, <strong>from</strong> 21 days/hectare/year <strong>in</strong> 1995 to 63 days/hectare/year <strong>in</strong> 1997.This <strong>in</strong>crease reflects both an <strong>in</strong>crease <strong>in</strong> the <strong>in</strong>cidence of multiple cropp<strong>in</strong>g <strong>in</strong>1997 and a tendency to use much higher amounts of labor <strong>in</strong> 1997 (asdocumented <strong>in</strong> Figure 1). By 1999, significant labor shedd<strong>in</strong>g had occurred <strong>in</strong>both seasons, but multiple cropp<strong>in</strong>g had expanded further, and annual laboruse rema<strong>in</strong>ed 50 percent higher than <strong>in</strong> 1995. As a result, a hypothesis thatirrigation <strong>in</strong>creased overall employment is supported by the data.From 1995 to 1997 annual fertilizer use rema<strong>in</strong>ed stagnant, imply<strong>in</strong>g areduction <strong>in</strong> per-season fertilizer use (see Figure 2). Fertilizer use recoveredsomewhat by 1999, but per-season levels of fertilizer use rema<strong>in</strong>ed lower <strong>in</strong>1999 than <strong>in</strong> 1995. No clear reason for this pattern is apparent—especially <strong>in</strong>light of evidence that these low levels of fertilizer use are sub-optimal—apart<strong>from</strong> the usual explanations that rely on cash and credit constra<strong>in</strong>ts. Theseexplanations notwithstand<strong>in</strong>g, the <strong>in</strong>crease <strong>in</strong> pesticide use follow<strong>in</strong>g the<strong>in</strong>troduction of irrigation, <strong>from</strong> 341 pesos/hectare/year <strong>in</strong> 1995 to 2700pesos/hectare/year <strong>in</strong> 1999 is dramatic. A shift toward the use ofmolluskacides <strong>in</strong> response to problems with snails is partly responsible forthis <strong>in</strong>crease <strong>in</strong> expenditure, as is a slight <strong>in</strong>crease <strong>in</strong> pesticide prices overthe sample period, but neither factor fully expla<strong>in</strong>s the rapid rise of outlayson pesticides among these farmers.Conclusions and policy implicationsPopulation growth <strong>in</strong> frontier regions of the Philipp<strong>in</strong>es, as elsewhere, createsa significant problem for policymakers, and leads to deforestation andagricultural expansion <strong>in</strong> environmentally sensitive upland areas (Western1988). Annual crop production <strong>in</strong> upland areas is associated with biodiversityloss, high rates of soil erosion, and potential poverty traps (Barbier and Burgess1996; Shively 2001a; Shively 2001b). Results <strong>from</strong> this study suggest that oneway to <strong>in</strong>crease labor absorption <strong>in</strong> exist<strong>in</strong>g agricultural areas is through<strong>in</strong>tensification of farm<strong>in</strong>g <strong>in</strong> lowland areas. This study supports the hypothesisthat aggregate annual labor demand <strong>in</strong>creases with the implementation ofirrigation on lowland farms. Although the observed per-hectare level of labordecreased, annual labor use actually <strong>in</strong>creased due to an <strong>in</strong>crease <strong>in</strong> the<strong>in</strong>cidence of multiple cropp<strong>in</strong>g of rice. The question of where necessarylabor has come <strong>from</strong> is an <strong>in</strong>terest<strong>in</strong>g one. One hypothesis would be thatlabor had been <strong>in</strong> surplus <strong>in</strong> lowland households and that, follow<strong>in</strong>g irrigation,lowland households substituted work for leisure. However, among lowland