Recreation and large mammal activity in an urban nature reserve
Recreation and large mammal activity in an urban nature reserve
Recreation and large mammal activity in an urban nature reserve

Create successful ePaper yourself
Turn your PDF publications into a flip-book with our unique Google optimized e-Paper software.
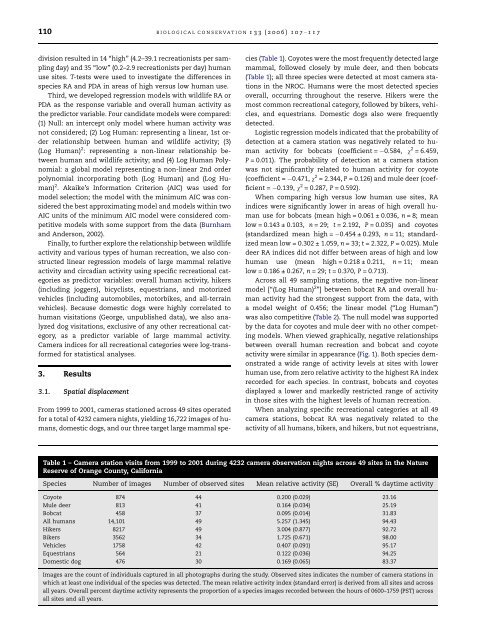
110 BIOLOGICAL CONSERVATION 133 (2006) 107– 117division resulted <strong>in</strong> 14 ‘‘high’’ (4.2–39.1 recreationists per sampl<strong>in</strong>gday) <strong><strong>an</strong>d</strong> 35 ‘‘low’’ (0.2–2.9 recreationists per day) hum<strong>an</strong>use sites. T-tests were used to <strong>in</strong>vestigate the differences <strong>in</strong>species RA <strong><strong>an</strong>d</strong> PDA <strong>in</strong> areas of high versus low hum<strong>an</strong> use.Third, we developed regression models with wildlife RA orPDA as the response variable <strong><strong>an</strong>d</strong> overall hum<strong>an</strong> <strong>activity</strong> asthe predictor variable. Four c<strong><strong>an</strong>d</strong>idate models were compared:(1) Null: <strong>an</strong> <strong>in</strong>tercept only model where hum<strong>an</strong> <strong>activity</strong> wasnot considered; (2) Log Hum<strong>an</strong>: represent<strong>in</strong>g a l<strong>in</strong>ear, 1st orderrelationship between hum<strong>an</strong> <strong><strong>an</strong>d</strong> wildlife <strong>activity</strong>; (3)(Log Hum<strong>an</strong>) 2 : represent<strong>in</strong>g a non-l<strong>in</strong>ear relationship betweenhum<strong>an</strong> <strong><strong>an</strong>d</strong> wildlife <strong>activity</strong>; <strong><strong>an</strong>d</strong> (4) Log Hum<strong>an</strong> Polynomial:a global model represent<strong>in</strong>g a non-l<strong>in</strong>ear 2nd orderpolynomial <strong>in</strong>corporat<strong>in</strong>g both (Log Hum<strong>an</strong>) <strong><strong>an</strong>d</strong> (Log Hum<strong>an</strong>)2 . Akaike’s Information Criterion (AIC) was used formodel selection; the model with the m<strong>in</strong>imum AIC was consideredthe best approximat<strong>in</strong>g model <strong><strong>an</strong>d</strong> models with<strong>in</strong> twoAIC units of the m<strong>in</strong>imum AIC model were considered competitivemodels with some support from the data (Burnham<strong><strong>an</strong>d</strong> Anderson, 2002).F<strong>in</strong>ally, to further explore the relationship between wildlife<strong>activity</strong> <strong><strong>an</strong>d</strong> various types of hum<strong>an</strong> recreation, we also constructedl<strong>in</strong>ear regression models of <strong>large</strong> <strong>mammal</strong> relative<strong>activity</strong> <strong><strong>an</strong>d</strong> circadi<strong>an</strong> <strong>activity</strong> us<strong>in</strong>g specific recreational categoriesas predictor variables: overall hum<strong>an</strong> <strong>activity</strong>, hikers(<strong>in</strong>clud<strong>in</strong>g joggers), bicyclists, equestri<strong>an</strong>s, <strong><strong>an</strong>d</strong> motorizedvehicles (<strong>in</strong>clud<strong>in</strong>g automobiles, motorbikes, <strong><strong>an</strong>d</strong> all-terra<strong>in</strong>vehicles). Because domestic dogs were highly correlated tohum<strong>an</strong> visitations (George, unpublished data), we also <strong>an</strong>alyzeddog visitations, exclusive of <strong>an</strong>y other recreational category,as a predictor variable of <strong>large</strong> <strong>mammal</strong> <strong>activity</strong>.Camera <strong>in</strong>dices for all recreational categories were log-tr<strong>an</strong>sformedfor statistical <strong>an</strong>alyses.3. Results3.1. Spatial displacementFrom 1999 to 2001, cameras stationed across 49 sites operatedfor a total of 4232 camera nights, yield<strong>in</strong>g 16,722 images of hum<strong>an</strong>s,domestic dogs, <strong><strong>an</strong>d</strong> our three target <strong>large</strong> <strong>mammal</strong> species(Table 1). Coyotes were the most frequently detected <strong>large</strong><strong>mammal</strong>, followed closely by mule deer, <strong><strong>an</strong>d</strong> then bobcats(Table 1); all three species were detected at most camera stations<strong>in</strong> the NROC. Hum<strong>an</strong>s were the most detected speciesoverall, occurr<strong>in</strong>g throughout the <strong>reserve</strong>. Hikers were themost common recreational category, followed by bikers, vehicles,<strong><strong>an</strong>d</strong> equestri<strong>an</strong>s. Domestic dogs also were frequentlydetected.Logistic regression models <strong>in</strong>dicated that the probability ofdetection at a camera station was negatively related to hum<strong>an</strong><strong>activity</strong> for bobcats (coefficient = 0.584, v 2 = 6.459,P = 0.011). The probability of detection at a camera stationwas not signific<strong>an</strong>tly related to hum<strong>an</strong> <strong>activity</strong> for coyote(coefficient = 0.471, v 2 = 2.344, P = 0.126) <strong><strong>an</strong>d</strong> mule deer (coefficient= 0.139, v 2 = 0.287, P = 0.592).When compar<strong>in</strong>g high versus low hum<strong>an</strong> use sites, RA<strong>in</strong>dices were signific<strong>an</strong>tly lower <strong>in</strong> areas of high overall hum<strong>an</strong>use for bobcats (me<strong>an</strong> high = 0.061 ± 0.036, n = 8; me<strong>an</strong>low = 0.143 ± 0.103, n = 29; t = 2.192, P = 0.035) <strong><strong>an</strong>d</strong> coyotes(st<strong><strong>an</strong>d</strong>ardized me<strong>an</strong> high = 0.454 ± 0.293, n = 11; st<strong><strong>an</strong>d</strong>ardizedme<strong>an</strong> low = 0.302 ± 1.059, n = 33; t = 2.322, P = 0.025). Muledeer RA <strong>in</strong>dices did not differ between areas of high <strong><strong>an</strong>d</strong> lowhum<strong>an</strong> use (me<strong>an</strong> high = 0.218 ± 0.211, n = 11; me<strong>an</strong>low = 0.186 ± 0.267, n = 29; t = 0.370, P = 0.713).Across all 49 sampl<strong>in</strong>g stations, the negative non-l<strong>in</strong>earmodel [‘‘(Log Hum<strong>an</strong>) 2 ’’] between bobcat RA <strong><strong>an</strong>d</strong> overall hum<strong>an</strong><strong>activity</strong> had the strongest support from the data, witha model weight of 0.456; the l<strong>in</strong>ear model (‘‘Log Hum<strong>an</strong>’’)was also competitive (Table 2). The null model was supportedby the data for coyotes <strong><strong>an</strong>d</strong> mule deer with no other compet<strong>in</strong>gmodels. When viewed graphically, negative relationshipsbetween overall hum<strong>an</strong> recreation <strong><strong>an</strong>d</strong> bobcat <strong><strong>an</strong>d</strong> coyote<strong>activity</strong> were similar <strong>in</strong> appear<strong>an</strong>ce (Fig. 1). Both species demonstrateda wide r<strong>an</strong>ge of <strong>activity</strong> levels at sites with lowerhum<strong>an</strong> use, from zero relative <strong>activity</strong> to the highest RA <strong>in</strong>dexrecorded for each species. In contrast, bobcats <strong><strong>an</strong>d</strong> coyotesdisplayed a lower <strong><strong>an</strong>d</strong> markedly restricted r<strong>an</strong>ge of <strong>activity</strong><strong>in</strong> those sites with the highest levels of hum<strong>an</strong> recreation.When <strong>an</strong>alyz<strong>in</strong>g specific recreational categories at all 49camera stations, bobcat RA was negatively related to the<strong>activity</strong> of all hum<strong>an</strong>s, bikers, <strong><strong>an</strong>d</strong> hikers, but not equestri<strong>an</strong>s,Table 1 – Camera station visits from 1999 to 2001 dur<strong>in</strong>g 4232 camera observation nights across 49 sites <strong>in</strong> the NatureReserve of Or<strong>an</strong>ge County, CaliforniaSpecies Number of images Number of observed sites Me<strong>an</strong> relative <strong>activity</strong> (SE) Overall % daytime <strong>activity</strong>Coyote 874 44 0.200 (0.029) 23.16Mule deer 813 41 0.164 (0.034) 25.19Bobcat 458 37 0.095 (0.014) 31.83All hum<strong>an</strong>s 14,101 49 5.257 (1.345) 94.43Hikers 8217 49 3.004 (0.877) 92.72Bikers 3562 34 1.725 (0.671) 98.00Vehicles 1758 42 0.407 (0.091) 95.17Equestri<strong>an</strong>s 564 21 0.122 (0.036) 94.25Domestic dog 476 30 0.169 (0.065) 83.37Images are the count of <strong>in</strong>dividuals captured <strong>in</strong> all photographs dur<strong>in</strong>g the study. Observed sites <strong>in</strong>dicates the number of camera stations <strong>in</strong>which at least one <strong>in</strong>dividual of the species was detected. The me<strong>an</strong> relative <strong>activity</strong> <strong>in</strong>dex (st<strong><strong>an</strong>d</strong>ard error) is derived from all sites <strong><strong>an</strong>d</strong> acrossall years. Overall percent daytime <strong>activity</strong> represents the proportion of a species images recorded between the hours of 0600–1759 (PST) acrossall sites <strong><strong>an</strong>d</strong> all years.