SLQS-Journal Vol. 1 - Slqs-uae.org
SLQS-Journal Vol. 1 - Slqs-uae.org
SLQS-Journal Vol. 1 - Slqs-uae.org
Create successful ePaper yourself
Turn your PDF publications into a flip-book with our unique Google optimized e-Paper software.
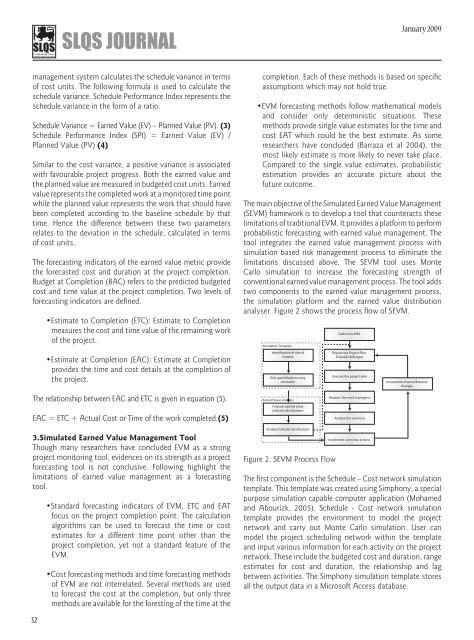
<strong>SLQS</strong> JOURNALJanuary 2009management system calculates the schedule variance in termsof cost units. The following formula is used to calculate theschedule variance. Schedule Performance Index represents theschedule variance in the form of a ratio.Schedule Variance = Earned Value (EV) – Planned Value (PV). (3)Schedule Performance Index (SPI) = Earned Value (EV) /Planned Value (PV) (4)Similar to the cost variance, a positive variance is associatedwith favourable project progress. Both the earned value andthe planned value are measured in budgeted cost units. Earnedvalue represents the completed work at a monitored time pointwhile the planned value represents the work that should havebeen completed according to the baseline schedule by thattime. Hence the difference between these two parametersrelates to the deviation in the schedule, calculated in termsof cost units.The forecasting indicators of the earned value metric providethe forecasted cost and duration at the project completion.Budget at Completion (BAC) refers to the predicted budgetedcost and time value at the project completion. Two levels offorecasting indicators are defined.•Estimate to Completion (ETC): Estimate to Completionmeasures the cost and time value of the remaining workof the project.completion. Each of these methods is based on specificassumptions which may not hold true.•EVM forecasting methods follow mathematical modelsand consider only deterministic situations. Thesemethods provide single value estimates for the time andcost EAT which could be the best estimate. As someresearchers have concluded (Barraza et al 2004), themost likely estimate is more likely to never take place.Compared to the single value estimates, probabilisticestimation provides an accurate picture about thefuture outcome.The main objective of the Simulated Earned Value Management(SEVM) framework is to develop a tool that counteracts theselimitations of traditional EVM. It provides a platform to performprobabilistic forecasting with earned value management. Thetool integrates the earned value management process withsimulation based risk management process to eliminate thelimitations discussed above. The SEVM tool uses MonteCarlo simulation to increase the forecasting strength ofconventional earned value management process. The tool addstwo components to the earned value management process,the simulation platform and the earned value distributionanalyser. Figure 2 shows the process flow of SEVM.Simulation TemplateDefine the WBS•Estimate at Completion (EAC): Estimate at Completionprovides the time and cost details at the completion ofthe project.Identification of risks &impactsRisk quantification usingsimulationPrepare the Project Plan-Schedule & BudgetExecute the project planIncorporate Internal/ExternalchangesThe relationship between EAC and ETC is given in equation (5).Earned Value AnalyzerMeasure the work in progressForecast earned valueindicator distributionsEAC = ETC + Actual Cost or Time of the work completed.(5)Analyze the variances3.Simulated Earned Value Management ToolThough many researchers have concluded EVM as a strongproject monitoring tool, evidences on its strength as a projectforecasting tool is not conclusive. Following highlight thelimitations of earned value management as a forecastingtool.•Standard forecasting indicators of EVM, ETC and EATfocus on the project completion point. The calculationalgorithms can be used to forecast the time or costestimates for a different time point other than theproject completion, yet not a standard feature of theEVM.•Cost forecasting methods and time forecasting methodsof EVM are not interrelated. Several methods are usedto forecast the cost at the completion, but only threemethods are available for the foresting of the time at theAnalyze indicator distributionsFigure 2: SEVM Process FlowImplement corrective actionsThe first component is the Schedule – Cost network simulationtemplate. This template was created using Simphony, a specialpurpose simulation capable computer application (Mohamedand Abourizk, 2005). Schedule - Cost network simulationtemplate provides the environment to model the projectnetwork and carry out Monte Carlo simulation. User canmodel the project scheduling network within the templateand input various information for each activity on the projectnetwork. These include the budgeted cost and duration, rangeestimates for cost and duration, the relationship and lagbetween activities. The Simphony simulation template storesall the output data in a Microsoft Access database.32


