Las Vegas Wash Tributaries Water Quality Report, 2003-2007
Las Vegas Wash Tributaries Water Quality Report, 2003-2007
Las Vegas Wash Tributaries Water Quality Report, 2003-2007
- No tags were found...

Create successful ePaper yourself
Turn your PDF publications into a flip-book with our unique Google optimized e-Paper software.
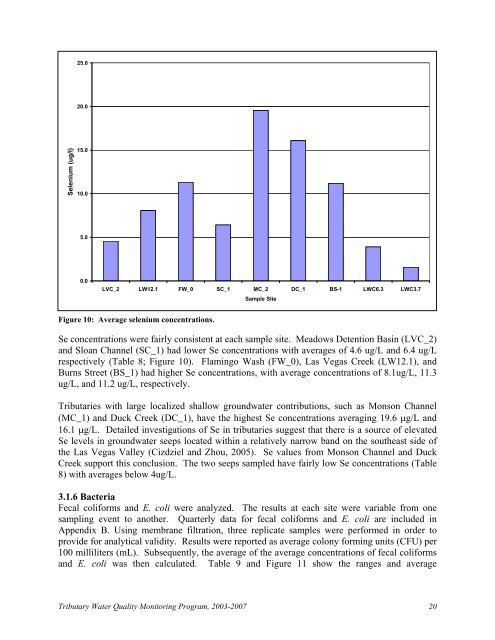
25.020.0Selenium (ug/l)15.010.05.00.0LVC_2 LW12.1 FW_0 SC_1 MC_2 DC_1 BS-1 LWC6.3 LWC3.7Sample SiteFigure 10: Average selenium concentrations.Se concentrations were fairly consistent at each sample site. Meadows Detention Basin (LVC_2)and Sloan Channel (SC_1) had lower Se concentrations with averages of 4.6 ug/L and 6.4 ug/Lrespectively (Table 8; Figure 10). Flamingo <strong>Wash</strong> (FW_0), <strong>Las</strong> <strong>Vegas</strong> Creek (LW12.1), andBurns Street (BS_1) had higher Se concentrations, with average concentrations of 8.1ug/L, 11.3ug/L, and 11.2 ug/L, respectively.<strong>Tributaries</strong> with large localized shallow groundwater contributions, such as Monson Channel(MC_1) and Duck Creek (DC_1), have the highest Se concentrations averaging 19.6 g/L and16.1 g/L. Detailed investigations of Se in tributaries suggest that there is a source of elevatedSe levels in groundwater seeps located within a relatively narrow band on the southeast side ofthe <strong>Las</strong> <strong>Vegas</strong> Valley (Cizdziel and Zhou, 2005). Se values from Monson Channel and DuckCreek support this conclusion. The two seeps sampled have fairly low Se concentrations (Table8) with averages below 4ug/L.3.1.6 BacteriaFecal coliforms and E. coli were analyzed. The results at each site were variable from onesampling event to another. Quarterly data for fecal coliforms and E. coli are included inAppendix B. Using membrane filtration, three replicate samples were performed in order toprovide for analytical validity. Results were reported as average colony forming units (CFU) per100 milliliters (mL). Subsequently, the average of the average concentrations of fecal coliformsand E. coli was then calculated. Table 9 and Figure 11 show the ranges and averageTributary <strong>Water</strong> <strong>Quality</strong> Monitoring Program, <strong>2003</strong>-<strong>2007</strong> 20