Las Vegas Wash Tributaries Water Quality Report, 2003-2007
Las Vegas Wash Tributaries Water Quality Report, 2003-2007
Las Vegas Wash Tributaries Water Quality Report, 2003-2007
- No tags were found...

Create successful ePaper yourself
Turn your PDF publications into a flip-book with our unique Google optimized e-Paper software.
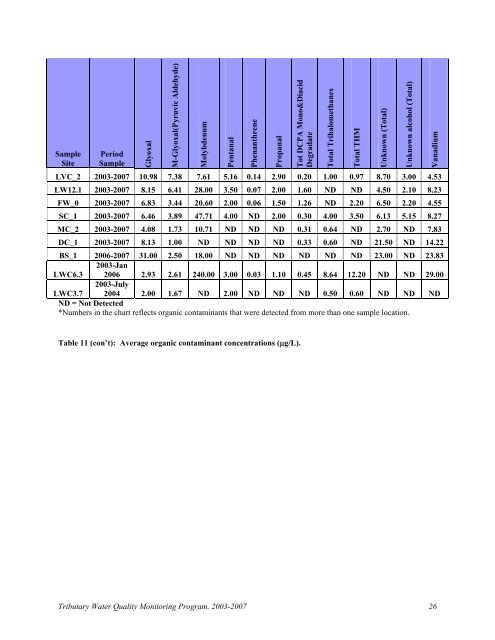
SampleSitePeriodSampleGlyoxalM-Glyoxal(Pyruvic Aldehyde)MolybdenumPentanalPhenanthrenePropanalTot DCPA Mono&DiacidDegradateLVC_2 <strong>2003</strong>-<strong>2007</strong> 10.98 7.38 7.61 5.16 0.14 2.90 0.20 1.00 0.97 8.70 3.00 4.53LW12.1 <strong>2003</strong>-<strong>2007</strong> 8.15 6.41 28.00 3.50 0.07 2.00 1.60 ND ND 4.50 2.10 8.23FW_0 <strong>2003</strong>-<strong>2007</strong> 6.83 3.44 20.60 2.00 0.06 1.50 1.26 ND 2.20 6.50 2.20 4.55SC_1 <strong>2003</strong>-<strong>2007</strong> 6.46 3.89 47.71 4.00 ND 2.00 0.30 4.00 3.50 6.13 5.15 8.27MC_2 <strong>2003</strong>-<strong>2007</strong> 4.08 1.73 10.71 ND ND ND 0.31 0.64 ND 2.70 ND 7.83DC_1 <strong>2003</strong>-<strong>2007</strong> 8.13 1.00 ND ND ND ND 0.33 0.60 ND 21.50 ND 14.22BS_1 2006-<strong>2007</strong> 31.00 2.50 18.00 ND ND ND ND ND ND 23.00 ND 23.83LWC6.3<strong>2003</strong>-Jan2006 2.93 2.61 240.00 3.00 0.03 1.10 0.45 8.64 12.20 ND ND 29.00LWC3.7<strong>2003</strong>-July2004 2.00 1.67 ND 2.00 ND ND ND 0.50 0.60 ND ND NDND = Not Detected*Numbers in the chart reflects organic contaminants that were detected from more than one sample location.Total TrihalomethanesTotal THMUnknown (Total)Unknown alcohol (Total)VanadiumTable 11 (con’t): Average organic contaminant concentrations (g/L).Tributary <strong>Water</strong> <strong>Quality</strong> Monitoring Program, <strong>2003</strong>-<strong>2007</strong> 26