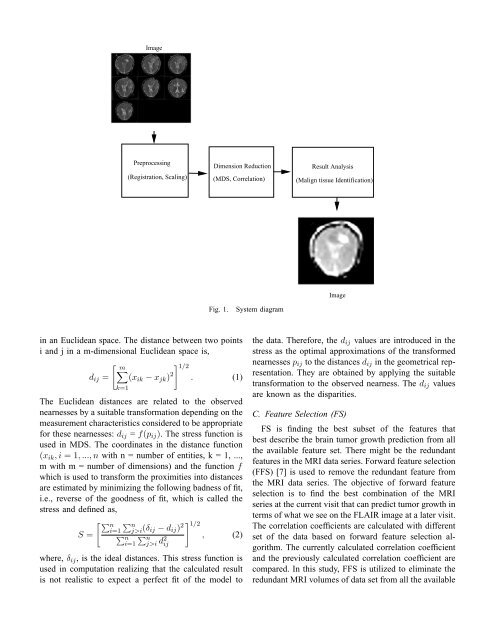
one-dimensional vector using multidimensional scalingto assist the analysis.The aim of this study is to design a tool to analyzethe tumor growth based on a computationally efficientdimensionality reduction technique. We compress theten dimensional data to one dimensional at current visitand visualize the compressed data on a two dimensionalplane to show where the tumor will grow at the nextvisit, if it is possible.The rest of the paper is organized as follows. Theproposed frame work of brain tumor growth predictionis detailed in Section II. Experiment setup is describedin Section III. Prediction results of the proposed DRMmethod followed by the discussion of the result are presentedin Section IV and V respectively. Final concludingremarks are presented in Section VI.II. THE PROPOSED FRAMEWORKIn this section, we describe the registration, featureextraction and DRM that are used in this paper. Aconceptually simple dimension reduction image analysistechnique has been used to analyze MRI brain tumorgrowth prediction with relatively lower computationalrequirements. The process flow of our proposed methodologyis shown in Fig. 1. We first register the 10 MRIseries to the DTI at visit one. We then combine the datainto a ten dimensional matrix and compress the matrix toone dimensional vector, using the MDS algorithm. Theone dimensional vector is then mapped to the originalimage space to analyze tumor progression.A. RegistrationFor a particular visit, all series were first rigidlyregistered to the T1 scan of that visit to remove any intravisitmotion. This process was repeated for all visits.As a post processing step, for all registrations, the brainwas automatically extracted from the T1 reference scan(using the <strong>Brain</strong> Extraction Tool (BET)) so that only thebrain was aligned during the registration process. Due tothe multimodal nature of the registration task, normalizedmutual information was the similarity measure chosen.All registrations were performed using the free warevtkCISG registration toolkit, developed at King’s CollegeLondon [6]. By combining the registration transformsfrom the intra- and inter- subject registration results, wehave the ability to align every series from every visit tovisit and series of our choice. For this study, we choseto align every series from every visit to the DTI scan atthe first visit. Since it is possible to align derived seriesfrom DTI to T1 by utilizing transforms methods, it isnot necessary to separately register DTI derived series(FA, ADC, Max, Min and Middle Eigen value).B. <strong>Dimensionality</strong> <strong>Reduction</strong> Method (DRM)DRM is a well known method which is a automaticmethod of discovering hidden structure in data from thestatistical regularities of large data sets. There are mainlytwo main goals of the algorithm: dimension reductionand density estimation. The goal of dimension reductionis to obtain more compact representations of the originaldata that capture the information necessary for higherleveldecision making while density estimation is utilizedto learn the parameters of a probabilistic model that canbe used to predict the uniqueness of future observations.The problem of dimension reduction appear in manyfields such as neural network, machine learning, patternrecognition, data compression, scientific visualization,and information processing. Principal component analysis(PCA) and MDS are two popular methods utilizedfor dimension reduction in the unsupervised learningprocess. Most applications of PCA and MDS involvethe modeling of linear variability in multidimensionaldata. In PCA, the linear projections of greatest variancefrom the top eigenvectors of the data covariance matrixcalculated while in MDS, the low dimensional embeddingcomputed that best preserves the pair wise distancesbetween data points. If such calculated distances correspondto Euclidean space that is called the classicalscaling. Both methods of dimension reduction are simpleto realize in practice, and their optimizations are wellunderstood and not prone to local minima.1) Multidimensional Scaling (MDS): In this section,brief description about the MDS is presented. MDS isa method of finding the nearness among the entities ina low dimensional space. It makes easy to interpret theprocesses underlying the perceived proximity of entities.MDS includes a collection of methods which allowgaining insight in the underlying structure of relationsbetween entities by providing a geometrical representationof these relations. So, MDS can be considered asthe category of methods for multivariate data analysis.MDS can be characterized by the generality of the typeof observed relations which can be submitted to the dataanalysis and it also specifies the type of geometricalrepresentation of these relations. MDS can measure ofrelation between a pair of entities either that can betranslated into a proximity measure, or conversely intoa dissimilarity measure. We use the symbol p ij to referto the proximity measure between entities i and j. Theproximities are represented in a geometrical space, e.g.
ImagePreprocessing(Registration, Scaling)Dimension <strong>Reduction</strong>(MDS, Correlation)Result <strong>Analysis</strong>(Malign tissue Identification)ImageFig. 1.System diagramin an Euclidean space. The distance between two pointsi and j in a m-dimensional Euclidean space is,[ m]∑ 1/2d ij = (x ik −x jk ) 2 . (1)k=1The Euclidean distances are related to the observednearnesses by a suitable transformation depending on themeasurement characteristics considered to be appropriatefor these nearnesses: d ij = f(p ij ). The stress function isused in MDS. The coordinates in the distance function(x ik ,i = 1,...,n with n = number of entities, k = 1, ...,m with m = number of dimensions) and the function fwhich is used to transform the proximities into distancesare estimated by minimizing the following badness of fit,i.e., reverse of the goodness of fit, which is called thestress and defined as,[∑ ni=1 ∑ nj>i(δ ij −d ij ) 2 ] 1/2S = ∑ ni=1 ∑ nj>id 2 , (2)ijwhere, δ ij , is the ideal distances. This stress function isused in computation realizing that the calculated resultis not realistic to expect a perfect fit of the model tothe data. Therefore, the d ij values are introduced in thestress as the optimal approximations of the transformednearnesses p ij to the distances d ij in the geometrical representation.They are obtained by applying the suitabletransformation to the observed nearness. The d ij valuesare known as the disparities.C. Feature Selection (FS)FS is finding the best subset of the features thatbest describe the brain tumor growth prediction from allthe available feature set. There might be the redundantfeatures in the MRI data series. Forward feature selection(FFS) [7] is used to remove the redundant feature fromthe MRI data series. The objective of forward featureselection is to find the best combination of the MRIseries at the current visit that can predict tumor growth interms of what we see on the FLAIR image at a later visit.The correlation coefficients are calculated with differentset of the data based on forward feature selection algorithm.The currently calculated correlation coefficientand the previously calculated correlation coefficient arecompared. In this study, FFS is utilized to eliminate theredundant MRI volumes of data set from all the available