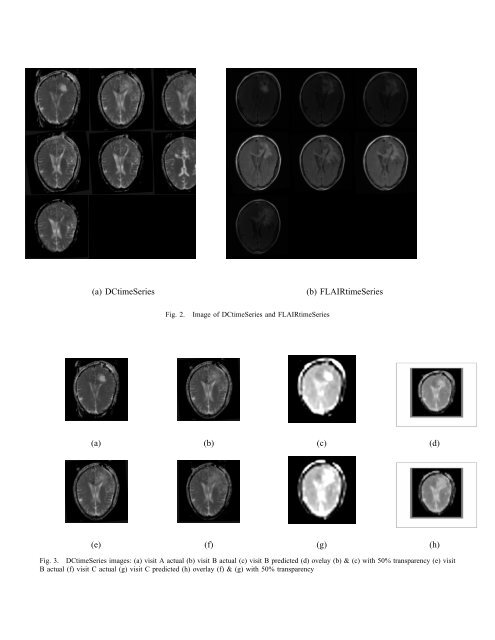
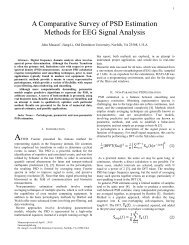
MRI data series.D. PredictionA prediction is a strong guessing about a future eventbased on the available data with some reasoning. Predictionof brain tumor growth is important in diagnosis andtreatment. <strong>Brain</strong> tumor growth prediction can be donebased on the multidimensional MRI data series. The10-dimensional matrix converted to the 2-dimensionalmatrix and it is compared with FLAIR data series afterthe redundant MRI volumes data set are discarded usingthe forward feature selection method. The accuracy ofthe prediction can be verified analyzing the differencebetween actual and predicted data.Our goal in this setup is to present an preliminarywork for brain tumor identification and growth predictionusing DRM. MDS is used to reduce the dimension of theMRI data and correlation coefficients are calculated tosee relationship among the data of the patient in differenttime visits.III. EXPERIMENTSIn this preliminary study, we focused on the feasibilitystudy of brain tumor growth prediction based on DRM.FLAIR images of the patient were used for analysispurposes. The MRI data of the brain tumor patient aretaken in multiple visits over the time span of two years.At each visit, patient underwent multiple MR imagingstudies including FLAIR, T1-weighted, post-contrast T1-weighted, T2-weighted, and DTI. For each DTI scan,five calculated scalar maps, e.g., ADC, FA, Max, Minand Middle Eigen Value, were derived yielding 10 imageseries for each patient. The interval between twoconsecutive visits was one or two months. All serieswere co-registered to the corresponding DTI series atthe first visit. The intensity-based features of each pixelof brain tissues at each visit were extracted across all10 co-registered imaging series and concatenated to a10-dimensional matrix. The multidimensional scalingis performed on the matrix resulting one dimensionalvector. The one dimensional vector is converted to thetwo dimensional matrix as in the MRI image space tocalculate the correlation. The correlation coefficient iscalculated with FLAIR date series based on the FFS. Thealgorithm stop once the current correlation coefficient isless or equal to the previously calculated correlation coefficients.The pseudo code of the procedure is outlinedas shown in algorithm 1.Algorithm 1 : <strong>Dimensionality</strong> <strong>Reduction</strong>• Input MRI data.• Construct the 10 dimensional matrix based on 10slices of MRI data.• Perform MDS.• Find the combination of MRI series that bestcorrelates the tumor growth at the later visit basedon a forward feature selection algorithm.• Keep the maximum correlation coefficient.• Stop, once correlation coefficient equal or lessthan previous one.IV. RESULTSFig. 2 shows some sample images of the MRI seriesafter registration. Fig. 3 and Fig. 4 show the imagesof the DCtimeSeries and FLAIRtimeSeries respectively.Fig. 3 (a) and Fig. 3 (b) are the images of DCtimeSeriesof visit A and visit B respectively. Fig. 3 (c) is thepredicted images for visit B. Fig. 3 (d) and Fig. 3 (e)are the images of DCtimeSeries of visit B and visit Crespectively. Fig. 3 (f) is the predicted images for visitC. Similarly, Fig. 4 (a) and Fig. 4 (b) are the imagesof FLAIRtimeSeries of visit A and visit B respectively.Fig. 4 (c) is the predicted images for visit B. Fig. 4(d) and Fig. 4 (e) are the images of FLAIRtimeSeriesof visit B and visit C respectively. Fig. 4 (f) is thepredicted images for visit C. It is clear that most ofthe tumor growth regions at different time of visits,e.g., visit B and visit C, were correctly predicted. Thecorrelation coefficients calculated based on the forwardfeature selection method which are shown as, r max =[0.7055 0.7457 0.7476 0.7641 0.7791]. We observedthat the correlation coefficients after certain iteration isrepeated as we assumed before performing the experiment.It showed that the MRI data might contain theredundant data sets. The proposed algorithm is stoppedif the presently calculated correlation coefficient is lessor equal to previous one. The simulation time to runthe proposed algorithm is nearly equal to 2967.214119seconds.V. DISCUSSIONIn this study, growth of normal and tumor tissues,were manually interpreted on FLAIR images, since braintumors in FLAIR images are, relatively, the most visuallydistinguishable. However, even in FLAIR images, theboundaries of brain tumors are still often not clear, whichis a characteristic of malignant brain tumors [8].
(a) DCtimeSeries(b) FLAIRtimeSeriesFig. 2.Image of DCtimeSeries and FLAIRtimeSeries(a) (b) (c) (d)(e) (f) (g) (h)Fig. 3. DCtimeSeries images: (a) visit A actual (b) visit B actual (c) visit B predicted (d) ovelay (b) & (c) with 50% transparency (e) visitB actual (f) visit C actual (g) visit C predicted (h) overlay (f) & (g) with 50% transparency