Dealing with User Experience and Affective Evaluation in HCI ... - SICS
Dealing with User Experience and Affective Evaluation in HCI ... - SICS
Dealing with User Experience and Affective Evaluation in HCI ... - SICS
You also want an ePaper? Increase the reach of your titles
YUMPU automatically turns print PDFs into web optimized ePapers that Google loves.
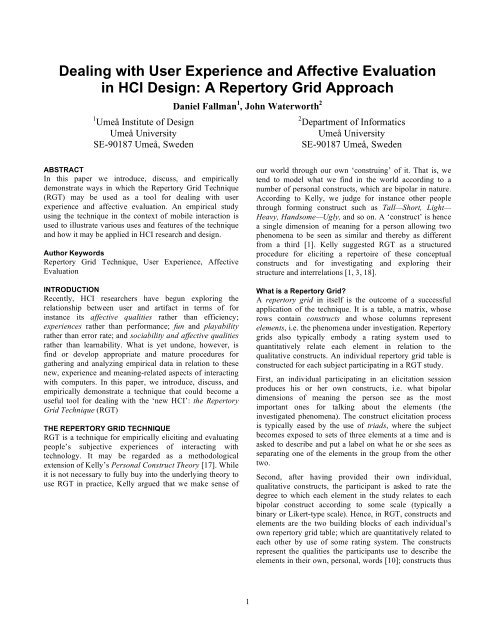
<strong>Deal<strong>in</strong>g</strong> <strong>with</strong> <strong>User</strong> <strong>Experience</strong> <strong>and</strong> <strong>Affective</strong> <strong>Evaluation</strong><strong>in</strong> <strong>HCI</strong> Design: A Repertory Grid Approach1 Umeå Institute of DesignUmeå UniversitySE-90187 Umeå, SwedenDaniel Fallman 1 , John Waterworth 22 Department of InformaticsUmeå UniversitySE-90187 Umeå, SwedenABSTRACTIn this paper we <strong>in</strong>troduce, discuss, <strong>and</strong> empiricallydemonstrate ways <strong>in</strong> which the Repertory Grid Technique(RGT) may be used as a tool for deal<strong>in</strong>g <strong>with</strong> userexperience <strong>and</strong> affective evaluation. An empirical studyus<strong>in</strong>g the technique <strong>in</strong> the context of mobile <strong>in</strong>teraction isused to illustrate various uses <strong>and</strong> features of the technique<strong>and</strong> how it may be applied <strong>in</strong> <strong>HCI</strong> research <strong>and</strong> design.Author KeywordsRepertory Grid Technique, <strong>User</strong> <strong>Experience</strong>, <strong>Affective</strong><strong>Evaluation</strong>INTRODUCTIONRecently, <strong>HCI</strong> researchers have begun explor<strong>in</strong>g therelationship between user <strong>and</strong> artifact <strong>in</strong> terms of for<strong>in</strong>stance its affective qualities rather than efficiency;experiences rather than performance; fun <strong>and</strong> playabilityrather than error rate; <strong>and</strong> sociability <strong>and</strong> affective qualitiesrather than learnability. What is yet undone, however, isf<strong>in</strong>d or develop appropriate <strong>and</strong> mature procedures forgather<strong>in</strong>g <strong>and</strong> analyz<strong>in</strong>g empirical data <strong>in</strong> relation to thesenew, experience <strong>and</strong> mean<strong>in</strong>g-related aspects of <strong>in</strong>teract<strong>in</strong>g<strong>with</strong> computers. In this paper, we <strong>in</strong>troduce, discuss, <strong>and</strong>empirically demonstrate a technique that could become auseful tool for deal<strong>in</strong>g <strong>with</strong> the ‘new <strong>HCI</strong>’: the RepertoryGrid Technique (RGT)THE REPERTORY GRID TECHNIQUERGT is a technique for empirically elicit<strong>in</strong>g <strong>and</strong> evaluat<strong>in</strong>gpeople’s subjective experiences of <strong>in</strong>teract<strong>in</strong>g <strong>with</strong>technology. It may be regarded as a methodologicalextension of Kelly’s Personal Construct Theory [17]. Whileit is not necessary to fully buy <strong>in</strong>to the underly<strong>in</strong>g theory touse RGT <strong>in</strong> practice, Kelly argued that we make sense ofour world through our own ‘constru<strong>in</strong>g’ of it. That is, wetend to model what we f<strong>in</strong>d <strong>in</strong> the world accord<strong>in</strong>g to anumber of personal constructs, which are bipolar <strong>in</strong> nature.Accord<strong>in</strong>g to Kelly, we judge for <strong>in</strong>stance other peoplethrough form<strong>in</strong>g construct such as Tall—Short, Light—Heavy, H<strong>and</strong>some—Ugly, <strong>and</strong> so on. A ‘construct’ is hencea s<strong>in</strong>gle dimension of mean<strong>in</strong>g for a person allow<strong>in</strong>g twophenomena to be seen as similar <strong>and</strong> thereby as differentfrom a third [1]. Kelly suggested RGT as a structuredprocedure for elicit<strong>in</strong>g a repertoire of these conceptualconstructs <strong>and</strong> for <strong>in</strong>vestigat<strong>in</strong>g <strong>and</strong> explor<strong>in</strong>g theirstructure <strong>and</strong> <strong>in</strong>terrelations [1, 3, 18].What is a Repertory Grid?A repertory grid <strong>in</strong> itself is the outcome of a successfulapplication of the technique. It is a table, a matrix, whoserows conta<strong>in</strong> constructs <strong>and</strong> whose columns representelements, i.e. the phenomena under <strong>in</strong>vestigation. Repertorygrids also typically embody a rat<strong>in</strong>g system used toquantitatively relate each element <strong>in</strong> relation to thequalitative constructs. An <strong>in</strong>dividual repertory grid table isconstructed for each subject participat<strong>in</strong>g <strong>in</strong> a RGT study.First, an <strong>in</strong>dividual participat<strong>in</strong>g <strong>in</strong> an elicitation sessionproduces his or her own constructs, i.e. what bipolardimensions of mean<strong>in</strong>g the person see as the mostimportant ones for talk<strong>in</strong>g about the elements (the<strong>in</strong>vestigated phenomena). The construct elicitation processis typically eased by the use of triads, where the subjectbecomes exposed to sets of three elements at a time <strong>and</strong> isasked to describe <strong>and</strong> put a label on what he or she sees asseparat<strong>in</strong>g one of the elements <strong>in</strong> the group from the othertwo.Second, after hav<strong>in</strong>g provided their own <strong>in</strong>dividual,qualitative constructs, the participant is asked to rate thedegree to which each element <strong>in</strong> the study relates to eachbipolar construct accord<strong>in</strong>g to some scale (typically ab<strong>in</strong>ary or Likert-type scale). Hence, <strong>in</strong> RGT, constructs <strong>and</strong>elements are the two build<strong>in</strong>g blocks of each <strong>in</strong>dividual’sown repertory grid table; which are quantitatively related toeach other by use of some rat<strong>in</strong>g system. The constructsrepresent the qualities the participants use to describe theelements <strong>in</strong> their own, personal, words [10]; constructs thus1
embody the participant’s mean<strong>in</strong>g <strong>and</strong> experience <strong>in</strong>relation to the study’s elements.RGT <strong>in</strong> Human—Computer InteractionDespite its popularity <strong>in</strong> fields such as organizationalmanagement, education, cl<strong>in</strong>ical psychology, <strong>and</strong>particularly <strong>in</strong> the development of knowledge-basedsystems [2, 20, 21, 22], the <strong>in</strong>terest <strong>in</strong> it from an <strong>HCI</strong>perspective did peak <strong>in</strong> the 1980s, <strong>with</strong> a special issuedevoted to the topic <strong>in</strong> the International Journal of Man—Mach<strong>in</strong>e Studies (Vol. 13, No. 1, 1980). But s<strong>in</strong>ce then, thetechnique’s appearance <strong>in</strong> <strong>HCI</strong>-related literature has beensparse, while not completely <strong>in</strong>existent [e.g. 4, 15, 16].AN EXAMPLE STUDY USING RGT: THE EXPERIENCEOF USING MOBILE INFORMATION TECHNOLOGYIn a study us<strong>in</strong>g RGT, we were <strong>in</strong>terested <strong>in</strong> people’sexperiences <strong>and</strong> affective responses to mobile <strong>in</strong>formationtechnology, <strong>and</strong> to ga<strong>in</strong> empirical <strong>in</strong>sight <strong>in</strong>to what k<strong>in</strong>ds ofmean<strong>in</strong>gs people ascribed to the different styles of<strong>in</strong>teraction the various devices of the study embodied. Todo this, the study <strong>in</strong>volved exist<strong>in</strong>g, off-the-shelf devices, aswell as a number of research prototypes that represent arange of alternative means of <strong>in</strong>teraction.In total 18 participants took part <strong>in</strong> the study, all of whichhad previously volunteered by sign<strong>in</strong>g up for a scheduledtime slot. There were 14 (78%) males <strong>and</strong> 4 (22%) females.Eight of the participants were <strong>in</strong> the age span of 20—29(44%), seven were 30—39 years of age (39%), while twowere 40—49 (11%), <strong>and</strong> one was 50—59 (6%). On anpreparatory questionnaire, three participants ratedthemselves as 3 on a 5-graded scale on self-estimatedcomputer literacy (16%), 14 stated 4 (78%), while only onesaid 5 (6%). On a similar scale 1 to 5, when asked to ratetheir previous exposure to mobile <strong>in</strong>formation technology,one participant responded <strong>with</strong> a 2 (6%), 6 rated themselvesas 3 (33%), 9 participant thought they were <strong>in</strong> the 4’s(50%), while two considered themselves to be 5 out of 5(11%). Each session lasted from 45 m<strong>in</strong>utes up to twohours, averag<strong>in</strong>g at slightly more than an hour. Allparticipants took part <strong>in</strong> the study <strong>in</strong>dividually.Element FamiliarizationAll 18 sessions began <strong>with</strong> the participant be<strong>in</strong>g exposed toseven different mobile <strong>in</strong>formation technology devices.Three of them were examples of exist<strong>in</strong>g devices; aCompaq iPaq H3660 Personal Digital Assistant (PDA,known <strong>in</strong> the study as E0), a Canon Digital Ixus 300 digitalcamera (E1); <strong>and</strong> a Sony Ericsson T68i mobile phone (E2).Four research prototypes were also part of the study. TheABB Mobile Service Technician (E5) is a wearable supporttool for service technicians <strong>in</strong> vehicle manufactur<strong>in</strong>g [5].The Dupliance prototype (E4) is a physical/virtualcommunication device for pre-school aged children [8]. TheSlide Scroller (E3) comb<strong>in</strong>es a PDA <strong>with</strong> an optical mouseto form a novel way of <strong>in</strong>teract<strong>in</strong>g <strong>with</strong> web pages onpalmtop-size displays [7]. F<strong>in</strong>ally, the Reality Helmet (E6)is a wearable <strong>in</strong>teractive experience that seeks to alter itsuser’s perceptual experience [6].Construct Elicit<strong>in</strong>gEach participant sat at a table opposite to the experimenter.On the table, seven palm-sized cardboard cards wheredisplayed. Every card conta<strong>in</strong>ed a photograph of one of thefour prototypes or one of the three exist<strong>in</strong>g devices; a labelon which the name of the device was pr<strong>in</strong>ted; <strong>and</strong> theidentification number used for organiz<strong>in</strong>g the study (i.e. E0to E6). In each session, the participant was exposed to theseven devices <strong>in</strong> groups of three—triad<strong>in</strong>g <strong>in</strong> RGT’stechnical language.For each triad presented to her/him, the participant wasasked to th<strong>in</strong>k of a property or quality that he or sheconsidered notably enough to s<strong>in</strong>gle out one of the threeelements (devices) <strong>in</strong> the group, <strong>and</strong> to put a name or labelon that property. For <strong>in</strong>stance, among a group of E1, E2,<strong>and</strong> E3, participant 10 s<strong>in</strong>gled out E1, <strong>and</strong> labeled herexperience as ‘Warm’. The participant was then asked toput a name or label on the property or quality that the othertwo devices <strong>in</strong> the triad shared <strong>in</strong> relation to the experienceof E1. Participant 10 then labeled E2’s <strong>and</strong> E3’s sharedquality—as an opposite to ‘Warm’—as ‘Cold’. To be ableto keep the relation between construct <strong>and</strong> orig<strong>in</strong>atorthroughout the study, the suffix ‘(S10)’ was added to eachconstruct elicited from participant 10. Hence, <strong>in</strong> this casethe elicited personal construct was ‘Warm (S10)—Cold(S10)’.The participant was then asked to grade each of the sevenelements accord<strong>in</strong>g to the bipolar scale that had just beenconstructed from the participant’s own concepts. That is,for each element of the study as a whole—also those thatdid not appear <strong>in</strong> the specific triad from which a particularconstruct pair was established—the participant was asked torate or grade that element on a seven-graded scale, whereleft (e.g. 1 of 7) would represented a high degree of theproperty found to be embodied by the s<strong>in</strong>gled out device (<strong>in</strong>the case of participant 10: ‘Warm’), <strong>and</strong> right (e.g. 7 of 7)would represent a high degree of the property embodied bythe two other devices <strong>in</strong> the specific triad (i.e. ‘Cold’).Thus, for each triad exposed to a participant two k<strong>in</strong>ds ofdata were be<strong>in</strong>g collected. First, a personal construct waselicited, i.e. a one-dimensional semantical space that theparticipant thought mean<strong>in</strong>gful <strong>and</strong> important for discuss<strong>in</strong>g<strong>and</strong> differentiat<strong>in</strong>g between the elements of a triad. Thisprocess provides the study <strong>with</strong> qualitative data; <strong>in</strong>sight<strong>in</strong>to the participant’s own mean<strong>in</strong>g structures, values, <strong>and</strong>preferences.Second, as each elicited personal bipolar construct was thenused as the scale by which the participant rated all of theseven elements <strong>in</strong> the study, data was also gathered aboutthe degree to which participants thought their construct hadrelevance to a specific element. This provided the study<strong>with</strong> quantitative data.2
ANALYSIS OF REPERTORY GRID DATAWhile RGT is an open approach that results <strong>in</strong> a number ofhighly <strong>in</strong>dividual repertory grid tables, some basicstructures are shared among the participants. Each table <strong>in</strong>this study consists of a number of bipolar constructs; a fixednumber of elements (7); <strong>and</strong> a shared rat<strong>in</strong>g system (a scaleof 1 to 7). From this setup, there are at least two basic ways<strong>in</strong> which different people’s repertory grid tables may becompared <strong>and</strong> analyzed <strong>in</strong>terpersonally.First, the f<strong>in</strong>ite number of elements <strong>and</strong> the shared rat<strong>in</strong>gsystem provide the basis for apply<strong>in</strong>g statistical methodsthat search for variations, similarities, <strong>and</strong> other k<strong>in</strong>ds ofpatterns <strong>in</strong> the series of numbers occurr<strong>in</strong>g <strong>in</strong> the numericaldata (the rat<strong>in</strong>gs). Us<strong>in</strong>g relational statistical methods, itbecomes possible to compare <strong>and</strong> divide all constructs fromall participants <strong>in</strong>to groups of constructs show<strong>in</strong>g somedegree of similarity. This may result <strong>in</strong> <strong>in</strong>terest<strong>in</strong>g <strong>and</strong>unexpected correlations between constructs whose relationwould likely have rema<strong>in</strong>ed unnoticed if one had onlylooked for semantical similarity. This method may hence becalled semantically bl<strong>in</strong>d, as it is driven primarily by eachconstruct pair’s quantitative data <strong>in</strong> relation to elements.Second, what appear to be several semantically related <strong>and</strong>overlapp<strong>in</strong>g groups of construct pairs appear across thestudy’s participants. Some similar bipolar scales, e.g.‘Young—Old’, ‘Appliance—Multifunctional’, <strong>and</strong> ‘Work—Leisure’, can be spotted among several of the participants.It would hence be possible to go through the list of allparticipants’ constructs <strong>and</strong> gather <strong>in</strong> groups those that bearsemantical resemblance to each other, <strong>and</strong> analyze thesegroups (e.g. us<strong>in</strong>g discourse analysis). This approach couldbe regarded as statistically bl<strong>in</strong>d, as it is driven by an<strong>in</strong>terpretation of the semantical content of the constructs,not tak<strong>in</strong>g the numerical rat<strong>in</strong>gs <strong>in</strong>to account.Participant Level AnalysisThe manually collected data from the 18 participants wasnow compiled <strong>and</strong> <strong>in</strong>putted <strong>in</strong>to the WebGrid-IIIapplication, a frequently used <strong>and</strong> feature-rich tool forcollect<strong>in</strong>g, stor<strong>in</strong>g, analyz<strong>in</strong>g, <strong>and</strong> visually represent<strong>in</strong>grepertory grid data [12, 13, 14, 23]. Each participant’srepertory grid table was used as the basis for three differentways of present<strong>in</strong>g the data graphically, <strong>in</strong>creas<strong>in</strong>gly drivenby <strong>and</strong> dependent on statistical methods of analysis. First, aDisplay Matrix has been generated. Be<strong>in</strong>g the most basicway of present<strong>in</strong>g a repertory grid, this table simply laysout the numerical results of all constructs for all elements.Second, a FOCUS Graph has been constructed for eachparticipant. Here, both elements <strong>and</strong> constructs are sortedus<strong>in</strong>g the FOCUS algorithm [13, 14, 20] so that similarones are grouped together. Third, the PRINCOM mapprovides pr<strong>in</strong>cipal component analysis of the repertory griddata. The grid is rotated <strong>and</strong> visualized <strong>in</strong> vector space tofacilitate maximum separation of elements <strong>in</strong> twodimensions [11, 24]. For more detailed <strong>in</strong>formation <strong>and</strong>discussion about these common ways of analyz<strong>in</strong>g <strong>and</strong>visualiz<strong>in</strong>g repertory grid data, please see [13, 14, 20, 23].Statistical Analysis of Multi-participant DataFor this study, we thought it would be <strong>in</strong>terest<strong>in</strong>g to see ifthere are any patterns or other k<strong>in</strong>ds of relationshipsbetween different participants’ repertory grids. To be ableto perform statistical analysis on multi-participant data, allparticipants’ 180 bipolar constructs were <strong>in</strong>putted <strong>in</strong>to thesame, very large repertory grid. This huge grid then becamesubject to various k<strong>in</strong>ds of analyses similar to those appliedto each <strong>in</strong>dividual participant’s repertory grid. Hence, aDISPLAY matrix, a FOCUS graph, <strong>and</strong> a PRINCOM mapwere constructed from the WebGrid-III application us<strong>in</strong>gall the data. These diagrams are however immense <strong>and</strong>unstructured, so the task at this po<strong>in</strong>t became to ref<strong>in</strong>e <strong>and</strong>br<strong>in</strong>g order <strong>in</strong>to the fairly messy data set.To discover such groups <strong>with</strong><strong>in</strong> the data set, the large,<strong>in</strong>terpersonal repertory grid was subject to two cycles ofFOCUS cluster<strong>in</strong>g. The difference between the two roundsis the manipulation of two rules that were be<strong>in</strong>g applied todist<strong>in</strong>guish groups or clusters <strong>in</strong> the data (for a detaileddescription of this process, please see [9]).Nam<strong>in</strong>g Groups by Semantical AnalysisThe 29 groups that resulted could be regarded asrepresent<strong>in</strong>g most pert<strong>in</strong>ent dimensions of the participants’underst<strong>and</strong><strong>in</strong>gs of the elements of the study. The first taskof this step was to create 29 new repertory grids based onthe <strong>in</strong>go<strong>in</strong>g constructs of a group. The analysis, up to thispo<strong>in</strong>t, had rema<strong>in</strong>ed statistical rather than semantical. Thus,each of the 29 groups consisted of a number of constructswhose rat<strong>in</strong>gs grouped them together. But to be able toaddress a specific group as a shared bipolar concept, an<strong>in</strong>terpretative analysis was needed at this stage. Eachdimension of each construct <strong>in</strong> each group was thuscarefully semantically reviewed <strong>and</strong> <strong>in</strong>terpreted, <strong>and</strong> one—or, if needed to better capture the character of the cluster,two or three—of the exist<strong>in</strong>g labels were chosen to becharacteriz<strong>in</strong>g for the group as a whole, <strong>and</strong> used to form anew bipolar construct represent<strong>in</strong>g the group.The hazard of possible experimenter biases <strong>and</strong> puremisunderst<strong>and</strong><strong>in</strong>gs was reduced by choos<strong>in</strong>g amongexist<strong>in</strong>g labels rather than creat<strong>in</strong>g new ones to capture thecharacter of a group. As an example of how this label<strong>in</strong>gwas carried out, the group A16 consists of three <strong>in</strong>go<strong>in</strong>gconstructs, <strong>with</strong> ‘Cosmetical (S18)’, ‘Consumer product(S14)’, <strong>and</strong> ‘Device (S1)’ on one end <strong>and</strong> ‘Mechanical(S18)’, ‘Professional product (S14)’, <strong>and</strong> ‘Tool (S1)’ on theother. Here, ‘Device (A16)’ was chosen to represent theformer, <strong>and</strong> ‘Professional tool (A16)’ to represent the latterend.Calculat<strong>in</strong>g Mean <strong>and</strong> Median Rat<strong>in</strong>gsTo be able to statistically analyze how the groups relate toeach other <strong>and</strong> to the elements of the study, a rat<strong>in</strong>g foreach construct on each element needs to be <strong>in</strong>corporated <strong>in</strong>the new repertory grid table. Rather than us<strong>in</strong>g arithmeticmean, these calculations relied on the median value. It hasbeen found to provide a result which seems more true to the3
at<strong>in</strong>g of the participants, where the <strong>in</strong>fluence of s<strong>in</strong>gle,extreme values which are at odds <strong>with</strong> the majority of thevalues <strong>in</strong> the group become de-emphasized.Interpret<strong>in</strong>g <strong>and</strong> Present<strong>in</strong>g the ResultWhen apply<strong>in</strong>g an 85% threshold to these 23 clusters <strong>and</strong>their rat<strong>in</strong>gs (see [9] for details), the FOCUS algorithmfurther partitions them <strong>in</strong> three groups of four or moreconstructs, as well as a s<strong>in</strong>gle cluster<strong>in</strong>g between twoadditional constructs. These clusters may aga<strong>in</strong> be treatedas groups, <strong>and</strong> hence, given this additional cluster<strong>in</strong>g, thestatistical analysis leaves us <strong>with</strong> not 23 but rather 10unique dimensions of the way <strong>in</strong> which the participantshave experienced the devices of mobile <strong>in</strong>formationtechnology that were part of the study. These 10 dimensionsare presented as a FOCUS graph (Figure 1) <strong>and</strong> as aPRINCOM map (Figure 2), which also shows how thedifferent elements relate to each other. These tendimensions are thus the most significant ways <strong>in</strong> which theparticipants experience the elements of the study.DISCUSSIONWhile RGT is a theoretically grounded, structured, <strong>and</strong>empirical approach it is not restricted or limited to alreadyexist<strong>in</strong>g, pre-prepared, or researcher-generated categories(i.e. constructs), as is the case <strong>with</strong> for <strong>in</strong>stance Osgood’sSemantic Differential [19]. In its first phase, RGT is clearlyfocused on elicit<strong>in</strong>g constructs that are mean<strong>in</strong>gful to theparticipant, not to the experimenter. In some sense, thismeans that the data which is found <strong>in</strong> a participant’s ownrepertory grid has not already been <strong>in</strong>fluenced by—i.e.<strong>in</strong>terpreted <strong>in</strong> the light of—the researcher’s pet theory.RGT is both Qualitative <strong>and</strong> QuantitativeAs a repertory grid does not only consist of the personalconstructs themselves but also of the rat<strong>in</strong>g of them <strong>in</strong>relation to the elements of the study, the researcher does notonly ga<strong>in</strong> <strong>in</strong>sight <strong>in</strong>to which the mean<strong>in</strong>gful constructs are,but also—through the rat<strong>in</strong>g—the degree to which he or sheth<strong>in</strong>ks a particular construct applies or does not apply to aparticular element. Hence, RGT technique that may perhapsbe best characterized as be<strong>in</strong>g on the border of qualitative<strong>and</strong> quantitative research; a ‘quali-quantitative’ approach.Results are Relational rather than AbsoluteAs that RGT relies on comparisons between differentFigure 1 <strong>and</strong> 2. The ten result<strong>in</strong>g dimensions as a FOCUS graph (left) <strong>and</strong> as a PRINCOM map (right)4
elements, all results must be regarded as relative to thegroup of elements that are <strong>in</strong>cluded <strong>in</strong> the study. The resultof a study us<strong>in</strong>g this technique is hence not a set of‘absolute values’. Rather, studies us<strong>in</strong>g RGT result <strong>in</strong><strong>in</strong>sight <strong>in</strong>to people’s experiences of th<strong>in</strong>gs <strong>and</strong> therelationships between them.Invested EffortOne expected disadvantage of RGT, at least whencompared to fully quantitative lab experiments, is that itrequires a substantial amount of effort to be <strong>in</strong>vested bothfrom the experimenter as well as from the participants at thetime of construct elicit<strong>in</strong>g. On the other h<strong>and</strong>, RGT is <strong>in</strong>some ways more efficient <strong>and</strong> less time-consum<strong>in</strong>g thanmost other fully open approaches, e.g. unstructured<strong>in</strong>terviews <strong>and</strong> explorative ethnography. As the personalconstructs elicited from a participant constitute the study’sdata, it follows that us<strong>in</strong>g the RGT significantly reduces theamount of data that needs to be analyzed compared <strong>with</strong>transcrib<strong>in</strong>g <strong>and</strong> analyz<strong>in</strong>g for <strong>in</strong>stance unstructured<strong>in</strong>terviews or ethnographic records.CONCLUSIONSThe Repertory Grid Technique (RGT) has been <strong>in</strong>troducedas an open <strong>and</strong> dynamic technique for elicit<strong>in</strong>g qualitativelypeople’s experiences <strong>and</strong> mean<strong>in</strong>gs <strong>in</strong> relation totechnological artifact, while it at the same time embodies apossibility for that data to be subject to modern methods ofstatistical analysis. The RGT may as such best be describedas a technique on the border between qualitative <strong>and</strong>quantitative research. An example from the area of mobile<strong>HCI</strong> was used to take the reader step by step through thesett<strong>in</strong>g up, conduct<strong>in</strong>g, <strong>and</strong> analyz<strong>in</strong>g of a RGT study.REFERENCES1. Bannister, D. & Fransella, F. Inquir<strong>in</strong>g man. 3rdEdition. Routledge, London, UK, 1985.2. Boose, J.H. & Ga<strong>in</strong>es, B.R. (Eds). Knowledgeacquisition tools for expert systems. Academic Press,London, UK, 1988.3. Dalton, P. & Dunnet, G. A psychology for liv<strong>in</strong>g:personal construct psychology for professionals <strong>and</strong>clients. Wiley, London, UK, 1992.4. Dillon, A. & McKnight, C. Towards a classification oftext types: a repertory grid approach. InternationalJournal of Man—Mach<strong>in</strong>e Studies, 33, 1990, 623—6365. Fallman, D. Wear, po<strong>in</strong>t, <strong>and</strong> tilt: design<strong>in</strong>g support formobile service <strong>and</strong> ma<strong>in</strong>tenance <strong>in</strong> <strong>in</strong>dustrial sett<strong>in</strong>gs,Proc. DIS 2002, ACM Press, 20026. Fallman, D., Jalkanen, K., Lorstad, H., Waterworth, J.,& Westl<strong>in</strong>g, J. The reality helmet: a wearable <strong>in</strong>teractiveexperience, SIGGRAPH 2003, ACM Press.7. Fallman, D., Lund, A., & Wiberg, M. (forthcom<strong>in</strong>g)ScrollPad: tangible scroll<strong>in</strong>g <strong>with</strong> mobile devices, Proc.HICSS’37, IEEE, 2004)8. Fallman, D., Andersson, N., & Johansson, L. cometogether, right now, over me: conceptual <strong>and</strong> tangibledesign of pleasurable dupliances for children, Proc.CAHD 2001, Asean Academic Press.9. Fallman, D. In Romance <strong>with</strong> the Materials of MobileInteraction: A Phenomenological Approach to theDesign of Mobile Information Technology, Ph.D.Thesis, 2003, Umea University, Sweden.10. Fransella, F. & Bannister, D. A manual for repertorygrid technique. Academic Press, London, UK, 1977.11. Ga<strong>in</strong>es, B.R. & Shaw, M.L.G. New directions <strong>in</strong> theanalysis <strong>and</strong> <strong>in</strong>teractive elicitation of personal constructsystems. International Journal Man—Mach<strong>in</strong>e Studies,13, 1980, 81—116.12. Ga<strong>in</strong>es, B.R. & Shaw, M.L.G. Elicit<strong>in</strong>g knowledge <strong>and</strong>transferr<strong>in</strong>g it effectively to a knowledge-based system.IEEE Transactions on Knowledge <strong>and</strong> DataEng<strong>in</strong>eer<strong>in</strong>g, 5(1), 1993, 4—14.13. Ga<strong>in</strong>es, B.R. & Shaw, M.L.G. Concept mapp<strong>in</strong>g on theweb. Proc. Fourth International World Wide WebConference, 1995, O’Reilly.14. Ga<strong>in</strong>es, B.R. & Shaw, M.L.G. Knowledge acquisition,model<strong>in</strong>g <strong>and</strong> <strong>in</strong>ference through world wide web.Human Computer Studies, 46, 1997, 729—759.15. Grose, M, Forsythe, C., & Ratner, J. (Eds.) Humanfactors <strong>and</strong> web development. Lawrence ErlbaumAssociates, Mahwah, NJ, 1998.16. Hassenzahl, M. & Wessler, R. Captur<strong>in</strong>g design spacefrom a user perspective: the repertory grid techniquerevisited. International Journal of Human—ComputerInteraction, 12(3&4), 2000, 441—459.17. Kelly, G. The psychology of personal constructs. Vol 1& 2. Routledge, London, UK, 1955.18. L<strong>and</strong>field, A. W. & Leitner, L. (Eds.) Personalconstruct psychology: personality <strong>and</strong> psychotherapy.Wiley, New York, NY, 1980.19. Osgood, C.E., Suci, G.J., & Tannenbaum, P.H. Themeasurement of mean<strong>in</strong>g. Univ. of Ill<strong>in</strong>ois, IL, 1957.20. Shaw, M.L.G. On becom<strong>in</strong>g a personal scientist:<strong>in</strong>teractive computer elicitation of personal models ofthe world. Academic Press, London, UK, 1980.21. Shaw, M.L.G. & Ga<strong>in</strong>es, B.R. A computer aid toknowledge eng<strong>in</strong>eer<strong>in</strong>g. Proc. British Computer SocietyConference on Expert Systems, 1983, 263—271.22. Shaw, M.L.G. & Ga<strong>in</strong>es, B.R. KITTEN: Knowledge<strong>in</strong>itiation & transfer tools for experts & novices. Int.Journal of Man-Mach<strong>in</strong>e Studies 27(3),1987,251—280.23. Shaw, M.L.G. & Ga<strong>in</strong>es, B.R. WebGrid-II: develop<strong>in</strong>ghierarchical knowledge structures from flat grids. Proc.KAW’98, 1998.24. Slater, P. (Ed.) Dimensions of <strong>in</strong>trapersonal space. Vol1. John Wiley, London, UK, 1976.5


