view issue - Adventure World Magazine
view issue - Adventure World Magazine
view issue - Adventure World Magazine
- No tags were found...

You also want an ePaper? Increase the reach of your titles
YUMPU automatically turns print PDFs into web optimized ePapers that Google loves.
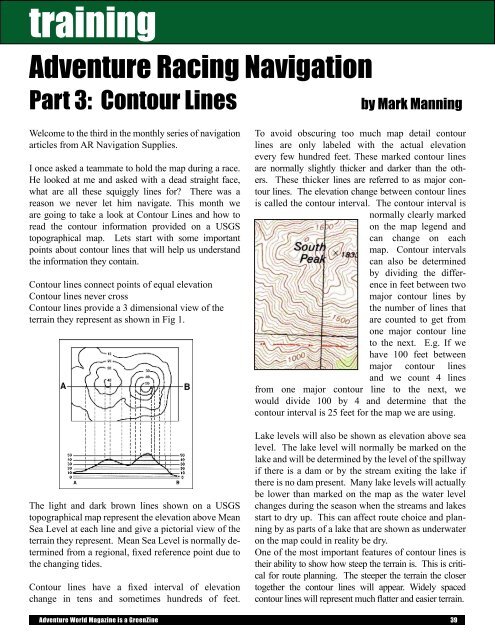
training<strong>Adventure</strong> Racing NavigationPart 3: Contour Linesby Mark ManningWelcome to the third in the monthly series of navigationarticles from AR Navigation Supplies.I once asked a teammate to hold the map during a race.He looked at me and asked with a dead straight face,what are all these squiggly lines for? There was areason we never let him navigate. This month weare going to take a look at Contour Lines and how toread the contour information provided on a USGStopographical map. Lets start with some importantpoints about contour lines that will help us understandthe information they contain.Contour lines connect points of equal elevationContour lines never crossContour lines provide a 3 dimensional <strong>view</strong> of theterrain they represent as shown in Fig 1.The light and dark brown lines shown on a USGStopographical map represent the elevation above MeanSea Level at each line and give a pictorial <strong>view</strong> of theterrain they represent. Mean Sea Level is normally determinedfrom a regional, fixed reference point due tothe changing tides.Contour lines have a fixed interval of elevationchange in tens and sometimes hundreds of feet.To avoid obscuring too much map detail contourlines are only labeled with the actual elevationevery few hundred feet. These marked contour linesare normally slightly thicker and darker than the others.These thicker lines are referred to as major contourlines. The elevation change between contour linesis called the contour interval. The contour interval isnormally clearly markedon the map legend andcan change on eachmap. Contour intervalscan also be determinedby dividing the differencein feet between twomajor contour lines bythe number of lines thatare counted to get fromone major contour lineto the next. E.g. If wehave 100 feet betweenmajor contour linesand we count 4 linesfrom one major contour line to the next, wewould divide 100 by 4 and determine that thecontour interval is 25 feet for the map we are using.Lake levels will also be shown as elevation above sealevel. The lake level will normally be marked on thelake and will be determined by the level of the spillwayif there is a dam or by the stream exiting the lake ifthere is no dam present. Many lake levels will actuallybe lower than marked on the map as the water levelchanges during the season when the streams and lakesstart to dry up. This can affect route choice and planningby as parts of a lake that are shown as underwateron the map could in reality be dry.One of the most important features of contour lines istheir ability to show how steep the terrain is. This is criticalfor route planning. The steeper the terrain the closertogether the contour lines will appear. Widely spacedcontour lines will represent much flatter and easier terrain.<strong>Adventure</strong> <strong>World</strong> <strong>Magazine</strong> is a GreenZine 39