Decision curve analysis
Decision curve analysis
Decision curve analysis
- No tags were found...

Create successful ePaper yourself
Turn your PDF publications into a flip-book with our unique Google optimized e-Paper software.
<strong>Decision</strong> <strong>curve</strong> <strong>analysis</strong>Andrew VickersDepartments of Epidemiology andBiostatisticsMemorial Sloan-Kettering Cancer Center
What am I doing here?Prediction models arewonderful!
What am I doing here?Prediction models arewonderful!How do you know thatthey do more good thanharm?
What am I doing here?Prediction models arewonderful!
How do you know thatprediction models do moregood than harm?• Biostatistical measures:– Sensitivity, specificity– PPV, NPV– Brier score– Youden index, AUC– NRI
Model• Data generated with a logit model.• Betas of:– 1.8 for test 1– 2.0 for test 2– 1.9 for interaction– -3.5 for intercept
ResultsMarker Sensitivity Specificity PPV NPV Brier AUCYoudenNRITest 1 56 86 39 92 .1862 .706Test 2 72 76 34 94 .2441 .741 .070
ResultsMarker Sensitivity Specificity PPV NPV Brier AUCYoudenNRITest 1 56 86 39 92 .1862 .706Test 2 72 76 34 94 .2441 .741 .070What if Test 2 was a scan that wasexpensive and inconvenient?
ResultsMarker Sensitivity Specificity PPV NPV Brier AUCYoudenNRITest 1 56 86 39 92 .1862 .706Test 2 72 76 34 94 .2441 .741 .070Both 40 99 91 91 .0923 .695 -.023Either 88 63 28 97 .3380 .753 .093
Principle• Take statistical method m for decision d• m insufficient for d if extra information ineeded• For m to be sufficient for d:• i must be parameterized• Method available to incorporate i in m
Principle• Sensitivity / specificity insufficient todetermine which test should be used:– “Depends on whether sensitivity orspecificity is more important”• We need:– A parameter specifying relative importanceof sensitivity vs. specificity– A way to incorporate that parameter in astatistical methodology
What is the “depends”parameter?
Youden IndexSensitivity + Specificity – 1
Youden IndexSensitivity + Specificity – 1Value of sensitivity &specificity are equal
AUC / C indexProbability correct identification ofdiscordant pair
AUC / C indexProbability correct identification ofdiscordant pairClassifying a patient without an eventas high probability =classifying a patient with an event aslow probability– Pr: 50%, D=0; Pr: 10%, D=1– Pr: 50%, D=1; Pr: 90%, D=0
Brier Score(D - P) 2
Brier Score(D - P) 2• D=1 and D=0 scored equally
Net Reclassification Index
Net Reclassification IndexAs harmful to reclassify down a patientwho has the event asreclassify up a patient who doesn’thave the event
When is it ever the case inmedicine where…Harm of missed treatment=Harm of unnecessary treatment
Prostate cancer• What is worse?To fail to biopsy a patient with cancer(missed treatment = false negative)To biopsy a patient without cancer(unnecessary treatments = false positive)
Conclusion 1Prediction modelsare wonderful!How do you knowthat they do moregood than harm?• Traditional biostatistical techniquesfor evaluating models, markers andtests do not incorporate clinicalconsequences• Accordingly, they cannot informclinical practice
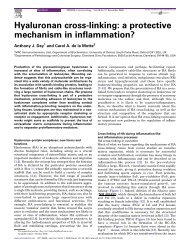
CanceraApplymodelBiopsyNo biopsyNo cancerCancerCancerNo cancer Cancerp 1p 2p 31- (p 1 + p 2 + p 3 )bcdCancerCancer(p 1 + p 3 )aBiopsyNo cancerCancer1 - (p 1 + p 3 )bNo biopsyCancerNo cancer Cancer(p 1 + p 3 )1 - (p 1 + p 3 )cd
CanceraApplymodelBiopsyNo biopsyNo cancerCancerCancerNo cancer Cancerp 1p 2p 31- (p 1 + p 2 + p 3 )bcdCancerCancer(p 1 + p 3 )aBiopsyNo cancerCancer1 - (p 1 + p 3 )bNo biopsyCancerNo cancer Cancer(p 1 + p 3 )1 - (p 1 + p 3 )cd
Problems with traditionaldecision <strong>analysis</strong>• p’s require a cut-point to be chosen• Extra data needed on health valuesoutcomes (a – d)– Harms of biopsy– Harms of delayed diagnosis– Harms may vary between patients
Threshold probabilityProbability of disease ispˆDefine a threshold probability of disease as p tPatient accepts treatment ifpˆ≥ptp t
If P(D=1) = P tad− c −=1− b pTreatmentNo treatmenttptDiseaseptNo disease1-pDiseasepttabcNo disease1-p td
Intuitively• The threshold probability at which apatient will opt for treatment isinformative of how a patient weighs therelative harms of false-positive andfalse-negative results.• Nothing new:– <strong>Decision</strong> analytic result since 1970’s
<strong>Decision</strong> <strong>curve</strong> <strong>analysis</strong>1. Select a p t2. Positive test defined as pˆ≥ p t3. Calculate “Clinical Net Benefit” as:TruePositiveCountn−FalsePositiveCountn4. Vary p t over an appropriate range⎛ pt⎜⎝1−pt⎞⎟⎠Vickers & Elkin Med Decis Making 2006;26:565–574
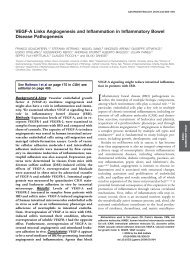
Illustrative example• Men with raised PSA are referred forprostate biopsy• Free PSA measured• Does free PSA help predict outcome ofbiopsy?
Worked example at p t = 20%N=753 Negative TruepositiveFalsepositiveBiopsy ifrisk ≥20% 384 149 220Biopsyall men 0 192 561Net benefit calculationNetbenefit149 - 220 × (0.2 ÷ 0.8)753 0.1248192 - 561 × (0.2 ÷ 0.8)753 0.0687
Free PSA
Net benefit has simpleclinical interpretation• Net benefit of 0.118 at p t of 20%• Using the model is the equivalent ofa strategy that identified theequivalent of 11.8 cancers per 100patients with no unnecessarybiopsies
Net benefit has simpleclinical interpretation• Difference between model and treat all atp t of 20%.– 0.0524• Divide by weighting 0.0524/ 0.25 = 0.21– 21 fewer false positives per 100 patients forequal number of true positives– E.g. 21 fewer unnecessary biopsies with nomissed cancers
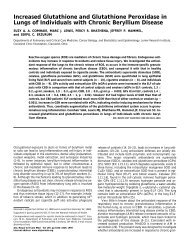
Introductory exampleMarker Sensitivity Specificity PPV NPV Brier AUCYoudenNRITest 1 56 86 39 92 .1862 .706Test 2 72 76 34 94 .2441 .741 .070
Test 2Test 1
EitherBoth
Incorporating the harm of atestTruePositiveCountn−FalsePositiveCountn⎛ pt⎜⎝1−pt⎞⎟⎠−TestHarmTest harm = reciprocal of how many patients would yougive the test to in order to find one case, assuming that thetest was perfectly accurate?
What if test 2 a scan?• This is a difficult question to answer!If the test was perfect, we wouldprobably perform no more than 20scans to find a cancer• Test harm = 0.05
Traditionalstatistical <strong>analysis</strong>Traditionaldecision <strong>analysis</strong>Mathematics Simple Can be complexAdditionaldataNot requiredPatient preferences,costs oreffectivenessEndpointsBinary orcontinuousContinuousendpointsproblematicAssess clinicalvalue?NoYes
Traditionalstatistical <strong>analysis</strong>Traditionaldecision <strong>analysis</strong><strong>Decision</strong><strong>curve</strong><strong>analysis</strong>Mathematics Simple Can be complex SimpleAdditionaldataNot requiredPatient preferences,costs oreffectivenessInformal,generalestimatesEndpointsBinary orcontinuousContinuousendpointsproblematicBinary orcontinuousAssess clinicalvalue?No Yes Yes
Software for <strong>Decision</strong> CurveAnalysis
Very easy to use softwarefor Stata and Rdca event m1 m2 both either, xstop(.4)
Extensions to decision<strong>curve</strong> <strong>analysis</strong>• Cross validation• 95% confidence intervals• Time-to-event data, includingcompeting risk• Evaluation of published models• Joint and conditional models
In summary…Prediction modelsare wonderful!How do you knowthat they do moregood than harm?• Traditional performance measuresdo not incorporate clinicalconsequences and cannot informclinical practice• There are very simple ways ofincorporating clinical consequencesusing threshold probability as adecision-analytic weight