ERB TESTING REPORT - Cary Academy
ERB TESTING REPORT - Cary Academy
ERB TESTING REPORT - Cary Academy
- No tags were found...
Create successful ePaper yourself
Turn your PDF publications into a flip-book with our unique Google optimized e-Paper software.
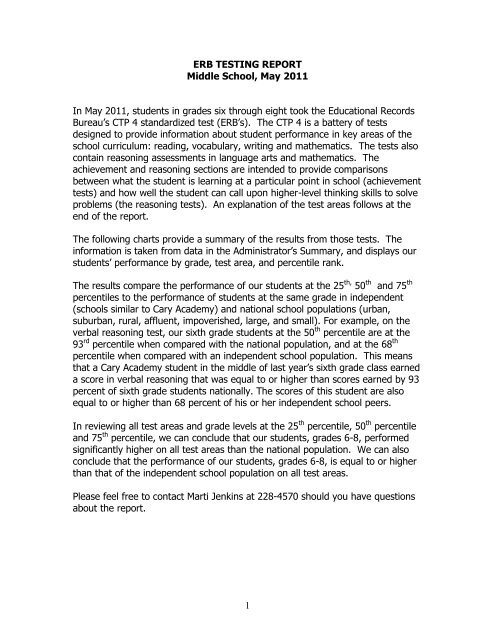
<strong>ERB</strong> <strong>TESTING</strong> <strong>REPORT</strong>Middle School, May 2011In May 2011, students in grades six through eight took the Educational RecordsBureau’s CTP 4 standardized test (<strong>ERB</strong>’s). The CTP 4 is a battery of testsdesigned to provide information about student performance in key areas of theschool curriculum: reading, vocabulary, writing and mathematics. The tests alsocontain reasoning assessments in language arts and mathematics. Theachievement and reasoning sections are intended to provide comparisonsbetween what the student is learning at a particular point in school (achievementtests) and how well the student can call upon higher-level thinking skills to solveproblems (the reasoning tests). An explanation of the test areas follows at theend of the report.The following charts provide a summary of the results from those tests. Theinformation is taken from data in the Administrator’s Summary, and displays ourstudents’ performance by grade, test area, and percentile rank.The results compare the performance of our students at the 25 th, 50 th and 75 thpercentiles to the performance of students at the same grade in independent(schools similar to <strong>Cary</strong> <strong>Academy</strong>) and national school populations (urban,suburban, rural, affluent, impoverished, large, and small). For example, on theverbal reasoning test, our sixth grade students at the 50 th percentile are at the93 rd percentile when compared with the national population, and at the 68 thpercentile when compared with an independent school population. This meansthat a <strong>Cary</strong> <strong>Academy</strong> student in the middle of last year’s sixth grade class earneda score in verbal reasoning that was equal to or higher than scores earned by 93percent of sixth grade students nationally. The scores of this student are alsoequal to or higher than 68 percent of his or her independent school peers.In reviewing all test areas and grade levels at the 25 th percentile, 50 th percentileand 75 th percentile, we can conclude that our students, grades 6-8, performedsignificantly higher on all test areas than the national population. We can alsoconclude that the performance of our students, grades 6-8, is equal to or higherthan that of the independent school population on all test areas.Please feel free to contact Marti Jenkins at 228-4570 should you have questionsabout the report.1
Sixth Grade <strong>ERB</strong> Results – Spring 2011*PERCENTILE RANKSTEST AREA CARY ACADEMY INDEPENDENT NATIONALV<strong>ERB</strong>AL REASONING 25 48 83VOCABULARY 25 41 89READING COMPREHENSION 25 54 82WRITING MECHANICS 25 33 82WRITING CONCEPTS AND SKILLS 25 50 90QUANTITATIVE REASONING 25 55 89MATHEMATICS 1 & 2 25 57 84*PERCENTILE RANKSTEST AREA CARY ACADEMY INDEPENDENT NATIONALV<strong>ERB</strong>AL REASONING 50 68 93VOCABULARY 50 62 95READING COMPREHENSION 50 71 93WRITING MECHANICS 50 58 94WRITING CONCEPTS AND SKILLS 50 65 94QUANTITATIVE REASONING 50 74 95MATHEMATICS 1 & 2 50 79 93*PERCENTILE RANKSTEST AREA CARY ACADEMY INDEPENDENT NATIONALV<strong>ERB</strong>AL REASONING 75 84 98VOCABULARY 75 84 98READING COMPREHENSION 75 86 98WRITING MECHANICS 75 81 98WRITING CONCEPTS AND SKILLS 75 84 98QUANTITATIVE REASONING 75 88 98MATHEMATICS 1 & 2 75 88 96*Percentile rank is the percentage of students in the norm sample whose scores fall at or below agiven score. A percentile rank indicates a student’s relative standing in a norming sample, it doesnot indicate the score itself. The 50 th percentile corresponds to the median, and indicates that astudent scored higher than half of the sample and lower than the other half.2
SEVENTH GRADE <strong>ERB</strong> RESULTS – SPRING 2011*PERCENTILE RANKSTEST AREA CARY ACADEMY INDEPENDENT NATIONALV<strong>ERB</strong>AL REASONING 25 59 91VOCABULARY 25 59 92READING COMPREHENSION 25 54 82WRITING MECHANICS 25 55 90WRITING CONCEPTS AND SKILLS 25 48 89QUANTITATIVE REASONING 25 67 97MATHEMATICS 1 & 2 25 74 97*PERCENTILE RANKSTEST AREA CARY ACADEMY INDEPENDENT NATIONALV<strong>ERB</strong>AL REASONING 50 77 96VOCABULARY 50 72 96READING COMPREHENSION 50 69 90WRITING MECHANICS 50 78 96WRITING CONCEPTS AND SKILLS 50 74 96QUANTITATIVE REASONING 50 85 99MATHEMATICS 1 & 2 50 88 99*PERCENTILE RANKSTEST AREA CARY ACADEMY INDEPENDENT NATIONALV<strong>ERB</strong>AL REASONING 75 90 98VOCABULARY 75 85 98READING COMPREHENSION 75 89 96WRITING MECHANICS 75 93 99WRITING CONCEPTS AND SKILLS 75 86 98QUANTITATIVE REASONING 75 94 99MATHEMATICS 1 & 2 75 95 99*Percentile rank is the percentage of students in the norm sample whose scores fall at or belowa given score. A percentile rank indicates a student’s relative standing in a norming sample, itdoes not indicate the score itself. The 50 th percentile corresponds to the median, and indicatesthat a student scored higher than half of the sample and lower than the other half.3
EIGHTH GRADE <strong>ERB</strong> RESULTS – SPRING 2011*PERCENTILE RANKSTEST AREA CARY ACADEMY INDEPENDENT NATIONALV<strong>ERB</strong>AL REASONING 25 52 92VOCABULARY 25 49 90READING COMPREHENSION 25 52 89WRITING MECHANICS 25 48 88WRITING CONCEPTS AND SKILLS 25 53 88QUANTITATIVE REASONING 25 56 93MATHEMATICS 1 & 2 25 59 93*PERCENTILE RANKSTEST AREA CARY ACADEMY INDEPENDENT NATIONALV<strong>ERB</strong>AL REASONING 50 70 97VOCABULARY 50 65 95READING COMPREHENSION 50 75 96WRITING MECHANICS 50 66 95WRITING CONCEPTS AND SKILLS 50 71 94QUANTITATIVE REASONING 50 73 96MATHEMATICS 1 & 2 50 73 97*PERCENTILE RANKSTEST AREA CARY ACADEMY INDEPENDENT NATIONALV<strong>ERB</strong>AL REASONING 75 83 99VOCABULARY 75 81 98READING COMPREHENSION 75 88 99WRITING MECHANICS 75 86 99WRITING CONCEPTS AND SKILLS 75 86 97QUANTITATIVE REASONING 75 86 98MATHEMATICS 1 & 2 75 86 99*Percentile rank is the percentage of students in the norm sample whose scores fall at or below agiven score. A percentile rank indicates a student’s relative standing in a norming sample, it doesnot indicate the score itself. The 50 th percentile corresponds to the median, and indicates that astudent scored higher than half of the sample and lower than the other half.4
Description of CTP 4 Achievement TestsVerbal Reasoning: the ability to analyze information and draw logical inferences, torecognize analogical verbal relationships, and to generalize verbal categorical attributesVocabulary: recognition and understanding of a wide range of grade-appropriatevocabulary and use of context clues to determine meaningReading Comprehension: comprehension of written material, including recall ofinformation, identifying of main ideas, and hypothesizing using information frompassagesWriting Mechanics: understanding of spelling, capitalization, punctuation, and usageconventionsWriting Concepts and Skills: understanding of the components of effective writtencompositionMathematics: conceptual understanding of mathematics, application of mathematicalknowledge to solve problems, and the ability to compute or estimate solutionsQuantitative Reasoning: the ability to analyze mathematical concepts and principles, tomake generalizations, and to compare quantities mathematically5


