Legislative Quotas for Women: A global and ... - Aurat Foundation
Legislative Quotas for Women: A global and ... - Aurat Foundation
Legislative Quotas for Women: A global and ... - Aurat Foundation
- No tags were found...

You also want an ePaper? Increase the reach of your titles
YUMPU automatically turns print PDFs into web optimized ePapers that Google loves.
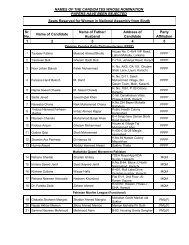
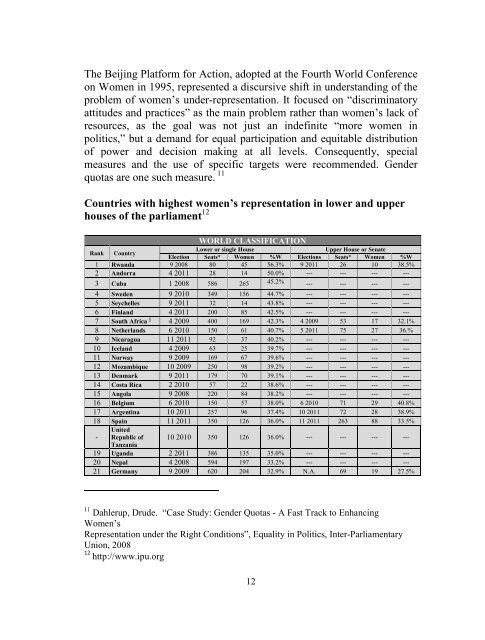
The Beijing Plat<strong>for</strong>m <strong>for</strong> Action, adopted at the Fourth World Conferenceon <strong>Women</strong> in 1995, represented a discursive shift in underst<strong>and</strong>ing of theproblem of women’s under-representation. It focused on “discriminatoryattitudes <strong>and</strong> practices” as the main problem rather than women’s lack ofresources, as the goal was not just an indefinite “more women inpolitics,” but a dem<strong>and</strong> <strong>for</strong> equal participation <strong>and</strong> equitable distributionof power <strong>and</strong> decision making at all levels. Consequently, specialmeasures <strong>and</strong> the use of specific targets were recommended. Genderquotas are one such measure. 11Countries with highest women’s representation in lower <strong>and</strong> upperhouses of the parliament 12WORLD CLASSIFICATIONRank CountryLower or single HouseUpper House or SenateElection Seats* <strong>Women</strong> %W Elections Seats* <strong>Women</strong> %W1 Rw<strong>and</strong>a 9 2008 80 45 56.3% 9 2011 26 10 38.5%2 Andorra 4 2011 28 14 50.0% --- --- --- ---3 Cuba 1 2008 586 265 45.2% --- --- --- ---4 Sweden 9 2010 349 156 44.7% --- --- --- ---5 Seychelles 9 2011 32 14 43.8% --- --- --- ---6 Finl<strong>and</strong> 4 2011 200 85 42.5% --- --- --- ---7 South Africa 1 4 2009 400 169 42.3% 4 2009 53 17 32.1%8 Netherl<strong>and</strong>s 6 2010 150 61 40.7% 5 2011 75 27 36.%9 Nicaragua 11 2011 92 37 40.2% --- --- --- ---10 Icel<strong>and</strong> 4 2009 63 25 39.7% --- --- --- ---11 Norway 9 2009 169 67 39.6% --- --- --- ---12 Mozambique 10 2009 250 98 39.2% --- --- --- ---13 Denmark 9 2011 179 70 39.1% --- --- --- ---14 Costa Rica 2 2010 57 22 38.6% --- --- --- ---15 Angola 9 2008 220 84 38.2% --- --- --- ---16 Belgium 6 2010 150 57 38.0% 6 2010 71 29 40.8%17 Argentina 10 2011 257 96 37.4% 10 2011 72 28 38.9%18 Spain 11 2011 350 126 36.0% 11 2011 263 88 33.5%-UnitedRepublic of 10 2010 350 126 36.0% --- --- --- ---Tanzania19 Ug<strong>and</strong>a 2 2011 386 135 35.0% --- --- --- ---20 Nepal 4 2008 594 197 33.2% --- --- --- ---21 Germany 9 2009 620 204 32.9% N.A. 69 19 27.5%11 Dahlerup, Drude. “Case Study: Gender <strong>Quotas</strong> - A Fast Track to Enhancing<strong>Women</strong>’sRepresentation under the Right Conditions”, Equality in Politics, Inter-ParliamentaryUnion, 200812 http://www.ipu.org12