2010 Bartercard NBL Team Stats (Round 15)
2010 Bartercard NBL Team Stats (Round 15)
2010 Bartercard NBL Team Stats (Round 15)
- No tags were found...

Create successful ePaper yourself
Turn your PDF publications into a flip-book with our unique Google optimized e-Paper software.
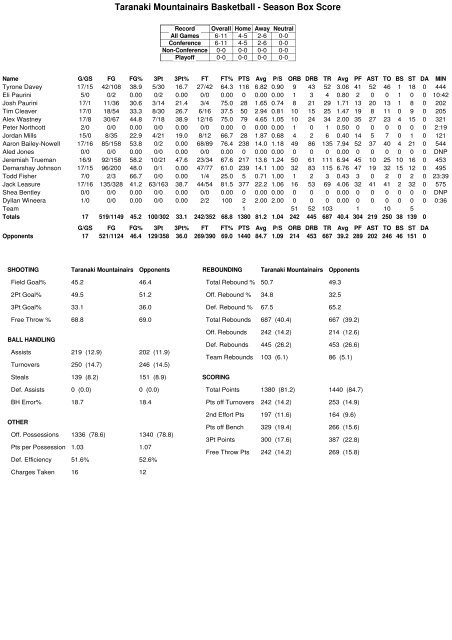
Taranaki Mountainairs Basketball - Season Box ScoreRecord Overall Home Away NeutralAll Games 6-11 4-5 2-6 0-0Conference 6-11 4-5 2-6 0-0Non-Conference 0-0 0-0 0-0 0-0Playoff 0-0 0-0 0-0 0-0Name G/GS FG FG% 3Pt 3Pt% FT FT% PTS Avg P/S ORB DRB TR Avg PF AST TO BS ST DA MINTyrone Davey 17/<strong>15</strong> 42/108 38.9 5/30 16.7 27/42 64.3 116 6.82 0.90 9 43 52 3.06 41 52 46 1 18 0 444Eli Paurini 5/0 0/2 0.00 0/2 0.00 0/0 0.00 0 0.00 0.00 1 3 4 0.80 2 0 0 1 0 0 10:42Josh Paurini 17/1 11/36 30.6 3/14 21.4 3/4 75.0 28 1.65 0.74 8 21 29 1.71 13 20 13 1 8 0 202Tim Cleaver 17/0 18/54 33.3 8/30 26.7 6/16 37.5 50 2.94 0.81 10 <strong>15</strong> 25 1.47 19 8 11 0 9 0 205Alex Wastney 17/8 30/67 44.8 7/18 38.9 12/16 75.0 79 4.65 1.05 10 24 34 2.00 35 27 23 4 <strong>15</strong> 0 321Peter Northcott 2/0 0/0 0.00 0/0 0.00 0/0 0.00 0 0.00 0.00 1 0 1 0.50 0 0 0 0 0 0 2:19Jordan Mills <strong>15</strong>/0 8/35 22.9 4/21 19.0 8/12 66.7 28 1.87 0.68 4 2 6 0.40 14 5 7 0 1 0 121Aaron Bailey-Nowell 17/16 85/<strong>15</strong>8 53.8 0/2 0.00 68/89 76.4 238 14.0 1.18 49 86 135 7.94 52 37 40 4 21 0 544Aled Jones 0/0 0/0 0.00 0/0 0.00 0/0 0.00 0 0.00 0.00 0 0 0 0.00 0 0 0 0 0 0 DNPJeremiah Trueman 16/9 92/<strong>15</strong>8 58.2 10/21 47.6 23/34 67.6 217 13.6 1.24 50 61 111 6.94 45 10 25 10 16 0 453Demarshay Johnson 17/<strong>15</strong> 96/200 48.0 0/1 0.00 47/77 61.0 239 14.1 1.00 32 83 1<strong>15</strong> 6.76 47 19 32 <strong>15</strong> 12 0 495Todd Fisher 7/0 2/3 66.7 0/0 0.00 1/4 25.0 5 0.71 1.00 1 2 3 0.43 3 0 2 0 2 0 23:39Jack Leasure 17/16 135/328 41.2 63/163 38.7 44/54 81.5 377 22.2 1.06 16 53 69 4.06 32 41 41 2 32 0 575Shea Bentley 0/0 0/0 0.00 0/0 0.00 0/0 0.00 0 0.00 0.00 0 0 0 0.00 0 0 0 0 0 0 DNPDyllan Wineera 1/0 0/0 0.00 0/0 0.00 2/2 100 2 2.00 2.00 0 0 0 0.00 0 0 0 0 0 0 0:36<strong>Team</strong> 1 51 52 103 1 10 5Totals 17 519/1149 45.2 100/302 33.1 242/352 68.8 1380 81.2 1.04 242 445 687 40.4 304 219 250 38 139 0G/GS FG FG% 3Pt 3Pt% FT FT% PTS Avg P/S ORB DRB TR Avg PF AST TO BS ST DAOpponents 17 521/1124 46.4 129/358 36.0 269/390 69.0 1440 84.7 1.09 214 453 667 39.2 289 202 246 46 <strong>15</strong>1 0SHOOTING Taranaki Mountainairs OpponentsField Goal% 45.2 46.42Pt Goal% 49.5 51.23Pt Goal% 33.1 36.0Free Throw % 68.8 69.0BALL HANDLINGAssists 219 (12.9) 202 (11.9)Turnovers 250 (14.7) 246 (14.5)Steals 139 (8.2) <strong>15</strong>1 (8.9)Def. Assists 0 (0.0) 0 (0.0)BH Error% 18.7 18.4OTHEROff. Possessions 1336 (78.6) 1340 (78.8)Pts per Possession 1.03 1.07Def. Efficiency 51.6% 52.6%REBOUNDING Taranaki Mountainairs OpponentsTotal Rebound % 50.7 49.3Off. Rebound % 34.8 32.5Def. Rebound % 67.5 65.2Total Rebounds 687 (40.4) 667 (39.2)Off. Rebounds 242 (14.2) 214 (12.6)Def. Rebounds 445 (26.2) 453 (26.6)<strong>Team</strong> Rebounds 103 (6.1) 86 (5.1)SCORINGTotal Points 1380 (81.2) 1440 (84.7)Pts off Turnovers 242 (14.2) 253 (14.9)2nd Effort Pts 197 (11.6) 164 (9.6)Pts off Bench 329 (19.4) 266 (<strong>15</strong>.6)3Pt Points 300 (17.6) 387 (22.8)Free Throw Pts 242 (14.2) 269 (<strong>15</strong>.8)Charges Taken 16 12
CyberSports for Basketball - Offensive Lineup Combination AnalysisTaranaki MountainairsMost Often Used Lineup: 5-T Davey, 22-A Bailey-Nowell, 25-J Trueman, 34-D Johnson, 44-J LeasureMost Productive Offensive Lineup: 8-J Paurini, 10-A Wastney, 22-A Bailey-Nowell, 25-J Trueman, 44-J LeasureMost Productive Rebounding Lineup: 8-J Paurini, 10-A Wastney, 22-A Bailey-Nowell, 25-J Trueman, 44-J LeasureBest Defensive Combination: 5-T Davey, 10-A Wastney, 25-J Trueman, 34-D Johnson, 44-J LeasureBest Lineup to Force Turnovers: 8-J Paurini, 10-A Wastney, 22-A Bailey-Nowell, 25-J Trueman, 44-J LeasureBest Overall Lineup:5-T Davey, 22-A Bailey-Nowell, 25-J Trueman, 34-D Johnson, 44-J LeasureBest Free Throw Shooting Lineup: 6-D Wineera, 8-J Paurini, 10-A Wastney, 22-A Bailey-Nowell, 44-J LeasureLineups Sorted by Playing TimePlayers Time Pts5-T Davey, 22-A Bailey-Nowell, 25-J Trueman, 34-D Johnson, 44-J Leasure 107.52 -25-T Davey, 10-A Wastney, 22-A Bailey-Nowell, 34-D Johnson, 44-J Leasure 90.68 +35-T Davey, 10-A Wastney, 22-A Bailey-Nowell, 25-J Trueman, 44-J Leasure 55.68 -108-J Paurini, 22-A Bailey-Nowell, 25-J Trueman, 34-D Johnson, 44-J Leasure 30.20 +55-T Davey, 9-T Cleaver, 22-A Bailey-Nowell, 34-D Johnson, 44-J Leasure 25.18 -45-T Davey, 10-A Wastney, 25-J Trueman, 34-D Johnson, 44-J Leasure 24.03 +65-T Davey, 9-T Cleaver, 25-J Trueman, 34-D Johnson, 44-J Leasure 19.98 +88-J Paurini, 9-T Cleaver, 22-A Bailey-Nowell, 34-D Johnson, 44-J Leasure 18.<strong>15</strong> -118-J Paurini, 10-A Wastney, 22-A Bailey-Nowell, 25-J Trueman, 44-J Leasure 14.47 +125-T Davey, 9-T Cleaver, 22-A Bailey-Nowell, 25-J Trueman, 44-J Leasure 12.78 -18Lineups Sorted by Points per MinutePlayers PPM Norm Pts Time8-J Paurini, 10-A Wastney, 22-A Bailey-Nowell, 25-J Trueman, 44-J Leasure +0.83 +33.18 +12 14.475-T Davey, 9-T Cleaver, 25-J Trueman, 34-D Johnson, 44-J Leasure +0.40 +16.01 +8 19.985-T Davey, 10-A Wastney, 25-J Trueman, 34-D Johnson, 44-J Leasure +0.25 +9.99 +6 24.038-J Paurini, 22-A Bailey-Nowell, 25-J Trueman, 34-D Johnson, 44-J Leasure +0.17 +6.62 +5 30.205-T Davey, 10-A Wastney, 22-A Bailey-Nowell, 34-D Johnson, 44-J Leasure +0.03 +1.32 +3 90.685-T Davey, 22-A Bailey-Nowell, 25-J Trueman, 34-D Johnson, 44-J Leasure -0.02 -0.74 -2 107.525-T Davey, 9-T Cleaver, 22-A Bailey-Nowell, 34-D Johnson, 44-J Leasure -0.16 -6.35 -4 25.185-T Davey, 10-A Wastney, 22-A Bailey-Nowell, 25-J Trueman, 44-J Leasure -0.18 -7.18 -10 55.688-J Paurini, 9-T Cleaver, 22-A Bailey-Nowell, 34-D Johnson, 44-J Leasure -0.61 -24.24 -11 18.<strong>15</strong>5-T Davey, 9-T Cleaver, 22-A Bailey-Nowell, 25-J Trueman, 44-J Leasure -1.41 -56.32 -18 12.78Lineups Sorted by Rebounds per MinutePlayers RPM Norm Reb Time8-J Paurini, 10-A Wastney, 22-A Bailey-Nowell, 25-J Trueman, 44-J Leasure +0.62 +24.88 +9 14.478-J Paurini, 22-A Bailey-Nowell, 25-J Trueman, 34-D Johnson, 44-J Leasure +0.40 +<strong>15</strong>.89 +12 30.205-T Davey, 9-T Cleaver, 25-J Trueman, 34-D Johnson, 44-J Leasure +0.<strong>15</strong> +6.01 +3 19.985-T Davey, 22-A Bailey-Nowell, 25-J Trueman, 34-D Johnson, 44-J Leasure +0.08 +3.35 +9 107.525-T Davey, 9-T Cleaver, 22-A Bailey-Nowell, 34-D Johnson, 44-J Leasure +0.08 +3.18 +2 25.185-T Davey, 10-A Wastney, 25-J Trueman, 34-D Johnson, 44-J Leasure +0.04 +1.66 +1 24.035-T Davey, 10-A Wastney, 22-A Bailey-Nowell, 25-J Trueman, 44-J Leasure +0.00 +0.00 +0 55.685-T Davey, 10-A Wastney, 22-A Bailey-Nowell, 34-D Johnson, 44-J Leasure -0.08 -3.09 -7 90.688-J Paurini, 9-T Cleaver, 22-A Bailey-Nowell, 34-D Johnson, 44-J Leasure -0.17 -6.61 -3 18.<strong>15</strong>5-T Davey, 9-T Cleaver, 22-A Bailey-Nowell, 25-J Trueman, 44-J Leasure -0.94 -37.55 -12 12.78Total time captured in lineups: 398.68Productive scoring minutes: 179.37Productive rebounding minutes: 221.38Productive scoring percentage: 44.99%Productive rebounding percentage: 55.53%
CyberSports for Basketball - Defensive Lineup Combination AnalysisTaranaki MountainairsLineup Sorted by Defensive PossessionsOppoDefPlayers Pts Poss5-T Davey, 22-A Bailey-Nowell, 25-J Trueman, 34-D Johnson, 44-J Leasure 214 28<strong>15</strong>-T Davey, 10-A Wastney, 22-A Bailey-Nowell, 34-D Johnson, 44-J Leasure 175 2125-T Davey, 10-A Wastney, 22-A Bailey-Nowell, 25-J Trueman, 44-J Leasure 129 1405-T Davey, 9-T Cleaver, 22-A Bailey-Nowell, 34-D Johnson, 44-J Leasure 61 705-T Davey, 10-A Wastney, 25-J Trueman, 34-D Johnson, 44-J Leasure 47 678-J Paurini, 22-A Bailey-Nowell, 25-J Trueman, 34-D Johnson, 44-J Leasure 66 635-T Davey, 9-T Cleaver, 25-J Trueman, 34-D Johnson, 44-J Leasure 42 568-J Paurini, 9-T Cleaver, 22-A Bailey-Nowell, 34-D Johnson, 44-J Leasure 36 405-T Davey, 9-T Cleaver, 22-A Bailey-Nowell, 25-J Trueman, 44-J Leasure 31 358-J Paurini, 10-A Wastney, 22-A Bailey-Nowell, 25-J Trueman, 44-J Leasure 24 34Lineup Sorted by Points per Possession AllowedPts/DefPlayers Poss Poss5-T Davey, 10-A Wastney, 25-J Trueman, 34-D Johnson, 44-J Leasure 0.70 678-J Paurini, 10-A Wastney, 22-A Bailey-Nowell, 25-J Trueman, 44-J Leasure 0.71 345-T Davey, 9-T Cleaver, 25-J Trueman, 34-D Johnson, 44-J Leasure 0.75 565-T Davey, 22-A Bailey-Nowell, 25-J Trueman, 34-D Johnson, 44-J Leasure 0.76 28<strong>15</strong>-T Davey, 10-A Wastney, 22-A Bailey-Nowell, 34-D Johnson, 44-J Leasure 0.83 2125-T Davey, 9-T Cleaver, 22-A Bailey-Nowell, 34-D Johnson, 44-J Leasure 0.87 705-T Davey, 9-T Cleaver, 22-A Bailey-Nowell, 25-J Trueman, 44-J Leasure 0.89 358-J Paurini, 9-T Cleaver, 22-A Bailey-Nowell, 34-D Johnson, 44-J Leasure 0.90 405-T Davey, 10-A Wastney, 22-A Bailey-Nowell, 25-J Trueman, 44-J Leasure 0.92 1408-J Paurini, 22-A Bailey-Nowell, 25-J Trueman, 34-D Johnson, 44-J Leasure 1.05 63Lineup Sorted by Defensive Efficiency (Stops)Def Def DefPlayers Eff Stops Poss8-J Paurini, 10-A Wastney, 22-A Bailey-Nowell, 25-J Trueman, 44-J Leasure 0.56 19 348-J Paurini, 9-T Cleaver, 22-A Bailey-Nowell, 34-D Johnson, 44-J Leasure 0.45 18 405-T Davey, 10-A Wastney, 22-A Bailey-Nowell, 34-D Johnson, 44-J Leasure 0.42 90 2125-T Davey, 10-A Wastney, 22-A Bailey-Nowell, 25-J Trueman, 44-J Leasure 0.43 60 1405-T Davey, 9-T Cleaver, 25-J Trueman, 34-D Johnson, 44-J Leasure 0.41 23 565-T Davey, 22-A Bailey-Nowell, 25-J Trueman, 34-D Johnson, 44-J Leasure 0.41 116 2818-J Paurini, 22-A Bailey-Nowell, 25-J Trueman, 34-D Johnson, 44-J Leasure 0.41 26 635-T Davey, 10-A Wastney, 25-J Trueman, 34-D Johnson, 44-J Leasure 0.40 27 675-T Davey, 9-T Cleaver, 22-A Bailey-Nowell, 34-D Johnson, 44-J Leasure 0.31 22 705-T Davey, 9-T Cleaver, 22-A Bailey-Nowell, 25-J Trueman, 44-J Leasure 0.26 9 35Lineup Sorted by Percentage of Ball Handling Errors Forced% BH Oppo DefPlayers Err TO Poss8-J Paurini, 10-A Wastney, 22-A Bailey-Nowell, 25-J Trueman, 44-J Leasure 0.21 7 345-T Davey, 10-A Wastney, 22-A Bailey-Nowell, 25-J Trueman, 44-J Leasure 0.20 28 1405-T Davey, 10-A Wastney, 22-A Bailey-Nowell, 34-D Johnson, 44-J Leasure 0.16 34 2125-T Davey, 22-A Bailey-Nowell, 25-J Trueman, 34-D Johnson, 44-J Leasure 0.16 45 28<strong>15</strong>-T Davey, 10-A Wastney, 25-J Trueman, 34-D Johnson, 44-J Leasure 0.16 11 678-J Paurini, 9-T Cleaver, 22-A Bailey-Nowell, 34-D Johnson, 44-J Leasure 0.13 5 405-T Davey, 9-T Cleaver, 22-A Bailey-Nowell, 34-D Johnson, 44-J Leasure 0.13 9 705-T Davey, 9-T Cleaver, 25-J Trueman, 34-D Johnson, 44-J Leasure 0.11 6 568-J Paurini, 22-A Bailey-Nowell, 25-J Trueman, 34-D Johnson, 44-J Leasure 0.10 6 635-T Davey, 9-T Cleaver, 22-A Bailey-Nowell, 25-J Trueman, 44-J Leasure 0.09 3 35
Taranaki Mountainairs Basketball - Season Statistical RankingField Goals Made Att FG% 3 Point Goals Made Att 3FG% Free Throws Made Att FT%FISHER, Todd 2 3 66.7 TRUEMAN, Jeremiah 10 21 47.6 WINEERA, Dyllan 2 2 100TRUEMAN, Jeremiah 92 <strong>15</strong>8 58.2 WASTNEY, Alex 7 18 38.9 LEASURE, Jack 44 54 81.5BAILEY-NOWELL, Aaron 85 <strong>15</strong>8 53.8 LEASURE, Jack 63 163 38.7 BAILEY-NOWELL, Aaron 68 89 76.4JOHNSON, Demarshay 96 200 48.0 CLEAVER, Tim 8 30 26.7 WASTNEY, Alex 12 16 75.0WASTNEY, Alex 30 67 44.8 PAURINI, Josh 3 14 21.4 PAURINI, Josh 3 4 75.0LEASURE, Jack 135 328 41.2 MILLS, Jordan 4 21 19.0 TRUEMAN, Jeremiah 23 34 67.6DAVEY, Tyrone 42 108 38.9 DAVEY, Tyrone 5 30 16.7 MILLS, Jordan 8 12 66.7CLEAVER, Tim 18 54 33.3 DAVEY, Tyrone 27 42 64.3PAURINI, Josh 11 36 30.6 JOHNSON, Demarshay 47 77 61.0MILLS, Jordan 8 35 22.9 CLEAVER, Tim 6 16 37.5FISHER, Todd 1 4 25.0Off Rebounds Num G Avg Def Rebounds Num G Avg Total Rebounds Num G AvgTRUEMAN, Jeremiah 50 16 3.13 BAILEY-NOWELL, Aaron 86 17 5.06 BAILEY-NOWELL, Aaron 135 17 7.94BAILEY-NOWELL, Aaron 49 17 2.88 JOHNSON, Demarshay 83 17 4.88 JOHNSON, Demarshay 1<strong>15</strong> 17 6.76JOHNSON, Demarshay 32 17 1.88 TRUEMAN, Jeremiah 61 16 3.81 TRUEMAN, Jeremiah 111 16 6.94LEASURE, Jack 16 17 0.94 LEASURE, Jack 53 17 3.12 LEASURE, Jack 69 17 4.06CLEAVER, Tim 10 17 0.59 DAVEY, Tyrone 43 17 2.53 DAVEY, Tyrone 52 17 3.06WASTNEY, Alex 10 17 0.59 WASTNEY, Alex 24 17 1.41 WASTNEY, Alex 34 17 2.00DAVEY, Tyrone 9 17 0.53 PAURINI, Josh 21 17 1.24 PAURINI, Josh 29 17 1.71PAURINI, Josh 8 17 0.47 CLEAVER, Tim <strong>15</strong> 17 0.88 CLEAVER, Tim 25 17 1.47MILLS, Jordan 4 <strong>15</strong> 0.27 PAURINI, Eli 3 5 0.60 MILLS, Jordan 6 <strong>15</strong> 0.40PAURINI, Eli 1 5 0.20 MILLS, Jordan 2 <strong>15</strong> 0.13 PAURINI, Eli 4 5 0.80NORTHCOTT, Peter 1 2 0.50 FISHER, Todd 2 7 0.29 FISHER, Todd 3 7 0.43FISHER, Todd 1 7 0.14 NORTHCOTT, Peter 1 2 0.50Assists Num G Avg Steals Num G Avg Scoring Num G AvgDAVEY, Tyrone 52 17 3.06 LEASURE, Jack 32 17 1.88 LEASURE, Jack 377 17 22.2LEASURE, Jack 41 17 2.41 BAILEY-NOWELL, Aaron 21 17 1.24 JOHNSON, Demarshay 239 17 14.1BAILEY-NOWELL, Aaron 37 17 2.18 DAVEY, Tyrone 18 17 1.06 BAILEY-NOWELL, Aaron 238 17 14.0WASTNEY, Alex 27 17 1.59 TRUEMAN, Jeremiah 16 16 1.00 TRUEMAN, Jeremiah 217 16 13.6PAURINI, Josh 20 17 1.18 WASTNEY, Alex <strong>15</strong> 17 0.88 DAVEY, Tyrone 116 17 6.82JOHNSON, Demarshay 19 17 1.12 JOHNSON, Demarshay 12 17 0.71 WASTNEY, Alex 79 17 4.65TRUEMAN, Jeremiah 10 16 0.63 CLEAVER, Tim 9 17 0.53 CLEAVER, Tim 50 17 2.94CLEAVER, Tim 8 17 0.47 PAURINI, Josh 8 17 0.47 PAURINI, Josh 28 17 1.65MILLS, Jordan 5 <strong>15</strong> 0.33 FISHER, Todd 2 7 0.29 MILLS, Jordan 28 <strong>15</strong> 1.87MILLS, Jordan 1 <strong>15</strong> 0.07 FISHER, Todd 5 7 0.71WINEERA, Dyllan 2 1 2.00Blocks Num G Avg Turn Overs Num G Avg Fouls Off Pers TotalJOHNSON, Demarshay <strong>15</strong> 17 0.88 DAVEY, Tyrone 46 17 2.71 BAILEY-NOWELL, Aaron 5 47 52TRUEMAN, Jeremiah 10 16 0.63 LEASURE, Jack 41 17 2.41 JOHNSON, Demarshay 2 45 47WASTNEY, Alex 4 17 0.24 BAILEY-NOWELL, Aaron 40 17 2.35 TRUEMAN, Jeremiah 2 43 45BAILEY-NOWELL, Aaron 4 17 0.24 JOHNSON, Demarshay 32 17 1.88 DAVEY, Tyrone 3 38 41LEASURE, Jack 2 17 0.12 TRUEMAN, Jeremiah 25 16 1.56 WASTNEY, Alex 2 33 35DAVEY, Tyrone 1 17 0.06 WASTNEY, Alex 23 17 1.35 LEASURE, Jack 3 29 32PAURINI, Eli 1 5 0.20 PAURINI, Josh 13 17 0.76 CLEAVER, Tim 1 18 19PAURINI, Josh 1 17 0.06 CLEAVER, Tim 11 17 0.65 MILLS, Jordan 1 13 14MILLS, Jordan 7 <strong>15</strong> 0.47 PAURINI, Josh 0 13 13FISHER, Todd 2 7 0.29 FISHER, Todd 0 3 3PAURINI, Eli 0 2 2Charges Taken Num G Avg Productivity Value G Avg Def Assist Num G AvgBAILEY-NOWELL, Aaron 5 17 0.29 BAILEY-NOWELL, Aaron 279 17 16.4WASTNEY, Alex 4 17 0.24 LEASURE, Jack 254 17 14.9DAVEY, Tyrone 3 17 0.18 TRUEMAN, Jeremiah 242 16 <strong>15</strong>.1CLEAVER, Tim 3 17 0.18 JOHNSON, Demarshay 199 17 11.7LEASURE, Jack 1 17 0.06 DAVEY, Tyrone 78.5 17 4.62WASTNEY, Alex 69.0 17 4.06PAURINI, Josh 38.0 17 2.24CLEAVER, Tim 24.0 17 1.41WINEERA, Dyllan 2.00 1 2.00PAURINI, Eli 1.50 5 0.30NORTHCOTT, Peter 1.50 2 0.75FISHER, Todd 1.50 7 0.21
Chrischurch Cougars Basketball - Season Box ScoreRecord Overall Home Away NeutralAll Games 9-9 6-3 3-6 0-0Conference 9-9 6-3 3-6 0-0Non-Conference 0-0 0-0 0-0 0-0Playoff 0-0 0-0 0-0 0-0Name G/GS FG FG% 3Pt 3Pt% FT FT% PTS Avg P/S ORB DRB TR Avg PF AST TO BS ST DA MINAidan Daly 18/9 29/77 37.7 2/17 11.8 18/30 60.0 78 4.33 0.85 10 46 56 3.11 36 60 47 1 <strong>15</strong> 0 445Marty Davison 7/0 2/6 33.3 1/5 20.0 4/6 66.7 9 1.29 1.00 1 4 5 0.71 5 2 7 0 3 0 33:13Dan Peck 12/4 29/61 47.5 <strong>15</strong>/34 44.1 9/11 81.8 82 6.83 1.24 1 22 23 1.92 24 13 13 0 4 0 181Dean Le Warne 2/0 0/1 0.00 0/1 0.00 0/0 0.00 0 0.00 0.00 0 0 0 0.00 1 0 1 0 0 0 2:34Paora Winitana 12/10 75/179 41.9 23/59 39.0 51/65 78.5 224 18.7 1.06 10 43 53 4.42 19 27 32 2 13 0 363Adrian Taylor 17/0 19/71 26.8 <strong>15</strong>/50 30.0 7/10 70.0 60 3.53 0.79 4 9 13 0.76 28 3 14 2 3 0 192Mark Morrison 18/14 55/145 37.9 17/50 34.0 33/42 78.6 160 8.89 0.96 27 78 105 5.83 27 27 38 3 11 0 481Lionel Hopgood 18/5 49/141 34.8 10/39 25.6 18/29 62.1 126 7.00 0.81 22 59 81 4.50 35 9 11 12 7 0 364Trenton Wurtz 18/18 80/175 45.7 30/59 50.8 37/64 57.8 227 12.6 1.10 50 71 121 6.72 54 24 26 14 29 0 452Sam Crozier 9/0 4/9 44.4 0/0 0.00 2/4 50.0 10 1.11 0.91 7 8 <strong>15</strong> 1.67 4 0 1 2 0 0 45:46Jeremy Kench 18/17 102/208 49.0 <strong>15</strong>/40 37.5 75/93 80.6 294 16.3 1.16 14 79 93 5.17 49 77 56 7 40 0 597Carew Elers 6/0 1/5 20.0 0/0 0.00 2/4 50.0 4 0.67 0.57 3 3 6 1.00 3 1 3 0 1 0 33:49Rusty Thomson 0/0 0/0 0.00 0/0 0.00 0/0 0.00 0 0.00 0.00 0 0 0 0.00 0 0 0 0 0 0 DNPTim Behrendorff 13/13 80/139 57.6 6/27 22.2 29/40 72.5 195 <strong>15</strong>.0 1.23 29 56 85 6.54 36 13 14 13 <strong>15</strong> 0 430<strong>Team</strong> 30 40 70 9 3Totals 18 525/1217 43.1 134/381 35.2 285/398 71.6 1469 81.6 1.04 208 518 726 40.3 321 256 272 56 144 0G/GS FG FG% 3Pt 3Pt% FT FT% PTS Avg P/S ORB DRB TR Avg PF AST TO BS ST DAOpponents 18 531/1239 42.9 131/399 32.8 282/397 71.0 1475 81.9 1.03 250 540 790 43.9 350 236 296 66 <strong>15</strong>3 0SHOOTING Chrischurch Cougars OpponentsField Goal% 43.1 42.92Pt Goal% 46.8 47.63Pt Goal% 35.2 32.8Free Throw % 71.6 71.0BALL HANDLINGAssists 256 (14.2) 236 (13.1)Turnovers 272 (<strong>15</strong>.1) 296 (16.4)Steals 144 (8.0) <strong>15</strong>3 (8.5)Def. Assists 0 (0.0) 0 (0.0)BH Error% 18.1 19.6OTHEROff. Possessions <strong>15</strong>00 (83.3) <strong>15</strong>09 (83.8)Pts per Possession 0.98 0.98Def. Efficiency 53.9% 54.1%REBOUNDING Chrischurch Cougars OpponentsTotal Rebound % 47.9 52.1Off. Rebound % 27.8 32.6Def. Rebound % 67.4 72.2Total Rebounds 726 (40.3) 790 (43.9)Off. Rebounds 208 (11.6) 250 (13.9)Def. Rebounds 518 (28.8) 540 (30.0)<strong>Team</strong> Rebounds 70 (3.9) 70 (3.9)SCORINGTotal Points 1469 (81.6) 1475 (81.9)Pts off Turnovers 322 (17.9) 323 (17.9)2nd Effort Pts 182 (10.1) 228 (12.7)Pts off Bench 309 (17.2) 251 (13.9)3Pt Points 402 (22.3) 393 (21.8)Free Throw Pts 285 (<strong>15</strong>.8) 282 (<strong>15</strong>.7)Charges Taken 32 13
Chrischurch Cougars Basketball - Season SummaryRecordDate OverallConfSiteScore Opponent High Point High Rebounder04/03/<strong>2010</strong> 1- 0 1- 0H W 75-72 0800 Easy LPG Bay Hawks27-P Winitana 7-T Wurtz, L Hopgo11/03/<strong>2010</strong> 1- 1 1- 1H L 72-85 Wellington Saints 20-P Winitana 9-M Morrison14/03/<strong>2010</strong> 2- 1 2- 1A W 104-71 Oceanagold Nuggets 26-P Winitana 7-M Morrison, L Ho18/03/<strong>2010</strong> 2- 2 2- 2A L 74-104 Waikato Pistons <strong>15</strong>-P Winitana, L Hopgood8-M Morrison19/03/<strong>2010</strong> 2- 3 2- 3A L 62-84 Taranaki Mountainairs <strong>15</strong>-P Winitana, L Hopgood8-T Wurtz26/03/<strong>2010</strong> 2- 4 2- 4H L 75-79 Zerofees Southland Sharks 24-M Morrison 9-J Kench01/04/<strong>2010</strong> 3- 4 3- 4H W 85-68 McDonalds Manawatu Jets 17-P Winitana 6-P Winitana, M Mo03/04/<strong>2010</strong> 3- 5 3- 5A L 79-85 Zerofees Southland Sharks 26-P Winitana 8-P Winitana16/04/<strong>2010</strong> 3- 6 3- 6A L 73-97 Exodus Wellington Saints 19-P Winitana, T Wurtz 10-T Wurtz17/04/<strong>2010</strong> 3- 7 3- 7A L 81-92 Fico Finance Nelson Giants30-T Behrendorff 8-M Morrison23/04/<strong>2010</strong> 3- 8 3- 8A L 72-76 0800 Easy LPG Bay Hawks17-T Wurtz 13-T Wurtz24/04/<strong>2010</strong> 4- 8 4- 8A W 106-101 OTMcDonalds Manawatu Jets 26-M Morrison 10-T Behrendorff30/04/<strong>2010</strong> 5- 8 5- 8H W 91-82 Harbour Heat 30-T Wurtz 9-T Wurtz07/05/<strong>2010</strong> 5- 9 5- 9H L 83-88 Waikato Pistons 23-D Peck 11-T Behrendorff14/05/<strong>2010</strong> 6- 9 6- 9H W 75-72 Taranaki Mountainairs 20-T Behrendorff 6-T Behrendorff22/05/<strong>2010</strong> 7- 9 7- 9H W 74-63 Fico Finance Nelson Giants22-J Kench 10-J Kench03/06/<strong>2010</strong> 8- 9 8- 9A W 87-76 Harbour Heat 16-P Winitana, T Wurtz 9-T Wurtz10/06/<strong>2010</strong> 9- 9 9- 9H W 101-80 Oceanagold Nuggets 29-J Kench 11-T Wurtz<strong>Team</strong> Statistics SummaryOpponent FG 3 Pt FT PTS ORB DRB TR PF AST TO BS ST DA0800 Easy LPG Bay Hawks 26/61 5/20 18/28 75 <strong>15</strong> 22 37 22 10 20 3 14 0Wellington Saints 25/71 8/26 14/16 72 12 26 38 23 <strong>15</strong> 13 0 9 0Oceanagold Nuggets 37/72 13/22 17/20 104 7 37 44 16 16 11 2 9 0Waikato Pistons 28/77 8/23 10/12 74 11 24 35 20 <strong>15</strong> 17 1 8 0Taranaki Mountainairs 21/63 3/23 17/26 62 19 24 43 19 8 16 1 10 0Zerofees Southland Sharks 28/75 8/25 11/12 75 16 29 45 <strong>15</strong> 17 <strong>15</strong> 4 2 0McDonalds Manawatu Jets 26/57 11/27 22/31 85 8 34 42 14 20 16 7 9 0Zerofees Southland Sharks 33/71 6/21 7/<strong>15</strong> 79 9 30 39 18 16 16 2 7 0Exodus Wellington Saints 23/69 4/19 23/28 73 14 29 43 17 10 <strong>15</strong> 5 9 0Fico Finance Nelson Giants 25/65 6/18 25/33 81 11 28 39 23 12 16 1 12 00800 Easy LPG Bay Hawks 28/60 5/17 11/25 72 14 36 50 19 10 18 3 4 0McDonalds Manawatu Jets 37/82 14/32 18/24 106 14 27 41 22 21 11 6 8 0Harbour Heat 34/66 9/16 14/20 91 7 25 32 14 16 <strong>15</strong> 6 6 0Waikato Pistons 31/64 7/<strong>15</strong> 14/17 83 9 29 38 19 9 18 6 6 0Taranaki Mountainairs 29/68 6/21 11/17 75 9 21 30 13 <strong>15</strong> 9 2 9 0Fico Finance Nelson Giants 26/58 3/17 19/24 74 8 31 39 11 8 <strong>15</strong> 1 9 0Harbour Heat 29/57 8/17 21/29 87 5 35 40 21 21 20 3 6 0Oceanagold Nuggets 39/81 10/22 13/21 101 20 31 51 16 17 11 3 7 0Individual Season Highs<strong>Team</strong> Season HighsMost Pts: 30 Multiple PlayersMost Pts: 106 vs. McDonalds Manawatu JetsMost Fgm: 12 J Kench vs. Oceanagold Nuggets Most Fgm: 39 vs. Oceanagold NuggetsMost Fga: 22 P Winitana vs. Wellington Saints Most Fga: 82 vs. McDonalds Manawatu JetsMost 3pm: 4 Multiple PlayersMost 3pm: 14 vs. McDonalds Manawatu JetsMost 3pa: 9 Multiple PlayersMost 3pa: 32 vs. McDonalds Manawatu JetsMost Ftm: 8 Multiple PlayersMost Ftm: 25 vs. Fico Finance Nelson GiantsMost Fta: 11 J Kench vs. Harbour HeatMost Fta: 33 vs. Fico Finance Nelson GiantsMost Reb: 13 T Wurtz vs. 0800 Easy LPG Bay Hawks Most Reb: 51 vs. Oceanagold NuggetsMost Orb: 8 T Wurtz vs. Oceanagold Nuggets Most Orb: 20 vs. Oceanagold NuggetsMost Drb: 9 J Kench vs. Fico Finance Nelson Giants Most Drb: 37 vs. Oceanagold NuggetsMost Ast: 8 J Kench vs. McDonalds Manawatu Jets Most Ast: 21 vs. McDonalds Manawatu JetsMost Stl: 7 J Kench vs. McDonalds Manawatu Jets Most Stl: 14 vs. 0800 Easy LPG Bay HawksMost Blk: 3 Multiple PlayersMost Blk: 7 vs. McDonalds Manawatu Jets
CyberSports for Basketball - Offensive Lineup Combination AnalysisChrischurch CougarsMost Often Used Lineup: 3-A Daly, 10-M Morrison, 16-T Wurtz, 24-J Kench, 34-T BehrendorffMost Productive Offensive Lineup: 3-A Daly, 8-P Winitana, 13-L Hopgood, 16-T Wurtz, 24-J KenchMost Productive Rebounding Lineup: 10-M Morrison, 13-L Hopgood, 16-T Wurtz, 24-J Kench, 34-T BehrendorffBest Defensive Combination: 6-D Peck, 10-M Morrison, 13-L Hopgood, 24-J Kench, 34-T BehrendorffBest Lineup to Force Turnovers: 3-A Daly, 8-P Winitana, 13-L Hopgood, 16-T Wurtz, 24-J KenchBest Overall Lineup:8-P Winitana, 10-M Morrison, 16-T Wurtz, 24-J Kench, 34-T BehrendorffBest Free Throw Shooting Lineup: 6-D Peck, 8-P Winitana, 10-M Morrison, 24-J Kench, 34-T BehrendorffLineups Sorted by Playing TimePlayers Time Pts3-A Daly, 10-M Morrison, 16-T Wurtz, 24-J Kench, 34-T Behrendorff 76.85 +206-D Peck, 10-M Morrison, 16-T Wurtz, 24-J Kench, 34-T Behrendorff 49.87 +93-A Daly, 8-P Winitana, 13-L Hopgood, 16-T Wurtz, 24-J Kench 44.73 +238-P Winitana, 10-M Morrison, 16-T Wurtz, 24-J Kench, 34-T Behrendorff 39.<strong>15</strong> +63-A Daly, 8-P Winitana, 16-T Wurtz, 24-J Kench, 34-T Behrendorff 33.18 +83-A Daly, 8-P Winitana, 10-M Morrison, 13-L Hopgood, 24-J Kench 25.75 -113-A Daly, 10-M Morrison, 13-L Hopgood, 24-J Kench, 34-T Behrendorff 20.67 -26-D Peck, 10-M Morrison, 13-L Hopgood, 24-J Kench, 34-T Behrendorff 19.73 +123-A Daly, 8-P Winitana, 10-M Morrison, 16-T Wurtz, 24-J Kench 17.60 +1210-M Morrison, 13-L Hopgood, 16-T Wurtz, 24-J Kench, 34-T Behrendorff 17.30 +10Lineups Sorted by Points per MinutePlayers PPM Norm Pts Time3-A Daly, 8-P Winitana, 10-M Morrison, 16-T Wurtz, 24-J Kench +0.68 +27.27 +12 17.606-D Peck, 10-M Morrison, 13-L Hopgood, 24-J Kench, 34-T Behrendorff +0.61 +24.32 +12 19.7310-M Morrison, 13-L Hopgood, 16-T Wurtz, 24-J Kench, 34-T Behrendorff +0.58 +23.12 +10 17.303-A Daly, 8-P Winitana, 13-L Hopgood, 16-T Wurtz, 24-J Kench +0.51 +20.57 +23 44.733-A Daly, 10-M Morrison, 16-T Wurtz, 24-J Kench, 34-T Behrendorff +0.26 +10.41 +20 76.853-A Daly, 8-P Winitana, 16-T Wurtz, 24-J Kench, 34-T Behrendorff +0.24 +9.64 +8 33.186-D Peck, 10-M Morrison, 16-T Wurtz, 24-J Kench, 34-T Behrendorff +0.18 +7.22 +9 49.878-P Winitana, 10-M Morrison, 16-T Wurtz, 24-J Kench, 34-T Behrendorff +0.<strong>15</strong> +6.13 +6 39.<strong>15</strong>3-A Daly, 10-M Morrison, 13-L Hopgood, 24-J Kench, 34-T Behrendorff -0.10 -3.87 -2 20.673-A Daly, 8-P Winitana, 10-M Morrison, 13-L Hopgood, 24-J Kench -0.43 -17.09 -11 25.75Lineups Sorted by Rebounds per MinutePlayers RPM Norm Reb Time10-M Morrison, 13-L Hopgood, 16-T Wurtz, 24-J Kench, 34-T Behrendorff +0.75 +30.06 +13 17.303-A Daly, 8-P Winitana, 16-T Wurtz, 24-J Kench, 34-T Behrendorff +0.36 +14.47 +12 33.183-A Daly, 8-P Winitana, 10-M Morrison, 16-T Wurtz, 24-J Kench +0.11 +4.55 +2 17.608-P Winitana, 10-M Morrison, 16-T Wurtz, 24-J Kench, 34-T Behrendorff +0.05 +2.04 +2 39.<strong>15</strong>3-A Daly, 10-M Morrison, 16-T Wurtz, 24-J Kench, 34-T Behrendorff -0.04 -1.56 -3 76.853-A Daly, 10-M Morrison, 13-L Hopgood, 24-J Kench, 34-T Behrendorff -0.05 -1.94 -1 20.676-D Peck, 10-M Morrison, 16-T Wurtz, 24-J Kench, 34-T Behrendorff -0.16 -6.42 -8 49.876-D Peck, 10-M Morrison, 13-L Hopgood, 24-J Kench, 34-T Behrendorff -0.25 -10.14 -5 19.733-A Daly, 8-P Winitana, 13-L Hopgood, 16-T Wurtz, 24-J Kench -0.36 -14.31 -16 44.733-A Daly, 8-P Winitana, 10-M Morrison, 13-L Hopgood, 24-J Kench -0.47 -18.64 -12 25.75Total time captured in lineups: 344.83Productive scoring minutes: 298.42Productive rebounding minutes: 107.23Productive scoring percentage: 86.54%Productive rebounding percentage: 31.10%
CyberSports for Basketball - Defensive Lineup Combination AnalysisChrischurch CougarsLineup Sorted by Defensive PossessionsOppoDefPlayers Pts Poss3-A Daly, 10-M Morrison, 16-T Wurtz, 24-J Kench, 34-T Behrendorff 142 1926-D Peck, 10-M Morrison, 16-T Wurtz, 24-J Kench, 34-T Behrendorff 93 1283-A Daly, 8-P Winitana, 13-L Hopgood, 16-T Wurtz, 24-J Kench 76 1228-P Winitana, 10-M Morrison, 16-T Wurtz, 24-J Kench, 34-T Behrendorff 66 973-A Daly, 8-P Winitana, 16-T Wurtz, 24-J Kench, 34-T Behrendorff 60 803-A Daly, 8-P Winitana, 10-M Morrison, 13-L Hopgood, 24-J Kench 53 663-A Daly, 10-M Morrison, 13-L Hopgood, 24-J Kench, 34-T Behrendorff 52 616-D Peck, 10-M Morrison, 13-L Hopgood, 24-J Kench, 34-T Behrendorff 37 603-A Daly, 8-P Winitana, 10-M Morrison, 16-T Wurtz, 24-J Kench 33 503-A Daly, 8-P Winitana, 10-M Morrison, 16-T Wurtz, 34-T Behrendorff 38 39Lineup Sorted by Points per Possession AllowedPts/DefPlayers Poss Poss6-D Peck, 10-M Morrison, 13-L Hopgood, 24-J Kench, 34-T Behrendorff 0.62 603-A Daly, 8-P Winitana, 13-L Hopgood, 16-T Wurtz, 24-J Kench 0.62 1223-A Daly, 8-P Winitana, 10-M Morrison, 16-T Wurtz, 24-J Kench 0.66 508-P Winitana, 10-M Morrison, 16-T Wurtz, 24-J Kench, 34-T Behrendorff 0.68 976-D Peck, 10-M Morrison, 16-T Wurtz, 24-J Kench, 34-T Behrendorff 0.73 1283-A Daly, 10-M Morrison, 16-T Wurtz, 24-J Kench, 34-T Behrendorff 0.74 1923-A Daly, 8-P Winitana, 16-T Wurtz, 24-J Kench, 34-T Behrendorff 0.75 803-A Daly, 8-P Winitana, 10-M Morrison, 13-L Hopgood, 24-J Kench 0.80 663-A Daly, 10-M Morrison, 13-L Hopgood, 24-J Kench, 34-T Behrendorff 0.85 613-A Daly, 8-P Winitana, 10-M Morrison, 16-T Wurtz, 34-T Behrendorff 0.97 39Lineup Sorted by Defensive Efficiency (Stops)Def Def DefPlayers Eff Stops Poss3-A Daly, 8-P Winitana, 16-T Wurtz, 24-J Kench, 34-T Behrendorff 0.55 44 808-P Winitana, 10-M Morrison, 16-T Wurtz, 24-J Kench, 34-T Behrendorff 0.51 49 973-A Daly, 8-P Winitana, 13-L Hopgood, 16-T Wurtz, 24-J Kench 0.47 57 1223-A Daly, 8-P Winitana, 10-M Morrison, 16-T Wurtz, 24-J Kench 0.46 23 503-A Daly, 10-M Morrison, 16-T Wurtz, 24-J Kench, 34-T Behrendorff 0.45 87 1926-D Peck, 10-M Morrison, 16-T Wurtz, 24-J Kench, 34-T Behrendorff 0.41 52 1286-D Peck, 10-M Morrison, 13-L Hopgood, 24-J Kench, 34-T Behrendorff 0.40 24 603-A Daly, 8-P Winitana, 10-M Morrison, 13-L Hopgood, 24-J Kench 0.39 26 663-A Daly, 10-M Morrison, 13-L Hopgood, 24-J Kench, 34-T Behrendorff 0.31 19 613-A Daly, 8-P Winitana, 10-M Morrison, 16-T Wurtz, 34-T Behrendorff 0.26 10 39Lineup Sorted by Percentage of Ball Handling Errors Forced% BH Oppo DefPlayers Err TO Poss3-A Daly, 8-P Winitana, 13-L Hopgood, 16-T Wurtz, 24-J Kench 0.26 32 1223-A Daly, 8-P Winitana, 16-T Wurtz, 24-J Kench, 34-T Behrendorff 0.25 20 803-A Daly, 8-P Winitana, 10-M Morrison, 16-T Wurtz, 24-J Kench 0.20 10 508-P Winitana, 10-M Morrison, 16-T Wurtz, 24-J Kench, 34-T Behrendorff 0.19 18 973-A Daly, 10-M Morrison, 16-T Wurtz, 24-J Kench, 34-T Behrendorff 0.18 35 1926-D Peck, 10-M Morrison, 13-L Hopgood, 24-J Kench, 34-T Behrendorff 0.<strong>15</strong> 9 606-D Peck, 10-M Morrison, 16-T Wurtz, 24-J Kench, 34-T Behrendorff 0.11 14 1283-A Daly, 10-M Morrison, 13-L Hopgood, 24-J Kench, 34-T Behrendorff 0.10 6 613-A Daly, 8-P Winitana, 10-M Morrison, 13-L Hopgood, 24-J Kench 0.09 6 663-A Daly, 8-P Winitana, 10-M Morrison, 16-T Wurtz, 34-T Behrendorff 0.08 3 39
Chrischurch Cougars Basketball - Season Statistical RankingField Goals Made Att FG% 3 Point Goals Made Att 3FG% Free Throws Made Att FT%BEHRENDORFF, Tim 80 139 57.6 WURTZ, Trenton 30 59 50.8 PECK, Dan 9 11 81.8KENCH, Jeremy 102 208 49.0 PECK, Dan <strong>15</strong> 34 44.1 KENCH, Jeremy 75 93 80.6PECK, Dan 29 61 47.5 WINITANA, Paora 23 59 39.0 MORRISON, Mark 33 42 78.6WURTZ, Trenton 80 175 45.7 KENCH, Jeremy <strong>15</strong> 40 37.5 WINITANA, Paora 51 65 78.5CROZIER, Sam 4 9 44.4 MORRISON, Mark 17 50 34.0 BEHRENDORFF, Tim 29 40 72.5WINITANA, Paora 75 179 41.9 TAYLOR, Adrian <strong>15</strong> 50 30.0 TAYLOR, Adrian 7 10 70.0MORRISON, Mark 55 145 37.9 HOPGOOD, Lionel 10 39 25.6 DAVISON, Marty 4 6 66.7DALY, Aidan 29 77 37.7 BEHRENDORFF, Tim 6 27 22.2 HOPGOOD, Lionel 18 29 62.1HOPGOOD, Lionel 49 141 34.8 DAVISON, Marty 1 5 20.0 DALY, Aidan 18 30 60.0DAVISON, Marty 2 6 33.3 DALY, Aidan 2 17 11.8 WURTZ, Trenton 37 64 57.8TAYLOR, Adrian 19 71 26.8 CROZIER, Sam 2 4 50.0ELERS, Carew 1 5 20.0 ELERS, Carew 2 4 50.0Off Rebounds Num G Avg Def Rebounds Num G Avg Total Rebounds Num G AvgWURTZ, Trenton 50 18 2.78 KENCH, Jeremy 79 18 4.39 WURTZ, Trenton 121 18 6.72BEHRENDORFF, Tim 29 13 2.23 MORRISON, Mark 78 18 4.33 MORRISON, Mark 105 18 5.83MORRISON, Mark 27 18 1.50 WURTZ, Trenton 71 18 3.94 KENCH, Jeremy 93 18 5.17HOPGOOD, Lionel 22 18 1.22 HOPGOOD, Lionel 59 18 3.28 BEHRENDORFF, Tim 85 13 6.54KENCH, Jeremy 14 18 0.78 BEHRENDORFF, Tim 56 13 4.31 HOPGOOD, Lionel 81 18 4.50DALY, Aidan 10 18 0.56 DALY, Aidan 46 18 2.56 DALY, Aidan 56 18 3.11WINITANA, Paora 10 12 0.83 WINITANA, Paora 43 12 3.58 WINITANA, Paora 53 12 4.42CROZIER, Sam 7 9 0.78 PECK, Dan 22 12 1.83 PECK, Dan 23 12 1.92TAYLOR, Adrian 4 17 0.24 TAYLOR, Adrian 9 17 0.53 CROZIER, Sam <strong>15</strong> 9 1.67ELERS, Carew 3 6 0.50 CROZIER, Sam 8 9 0.89 TAYLOR, Adrian 13 17 0.76DAVISON, Marty 1 7 0.14 DAVISON, Marty 4 7 0.57 ELERS, Carew 6 6 1.00PECK, Dan 1 12 0.08 ELERS, Carew 3 6 0.50 DAVISON, Marty 5 7 0.71Assists Num G Avg Steals Num G Avg Scoring Num G AvgKENCH, Jeremy 77 18 4.28 KENCH, Jeremy 40 18 2.22 KENCH, Jeremy 294 18 16.3DALY, Aidan 60 18 3.33 WURTZ, Trenton 29 18 1.61 WURTZ, Trenton 227 18 12.6WINITANA, Paora 27 12 2.25 DALY, Aidan <strong>15</strong> 18 0.83 WINITANA, Paora 224 12 18.7MORRISON, Mark 27 18 1.50 BEHRENDORFF, Tim <strong>15</strong> 13 1.<strong>15</strong> BEHRENDORFF, Tim 195 13 <strong>15</strong>.0WURTZ, Trenton 24 18 1.33 WINITANA, Paora 13 12 1.08 MORRISON, Mark 160 18 8.89PECK, Dan 13 12 1.08 MORRISON, Mark 11 18 0.61 HOPGOOD, Lionel 126 18 7.00BEHRENDORFF, Tim 13 13 1.00 HOPGOOD, Lionel 7 18 0.39 PECK, Dan 82 12 6.83HOPGOOD, Lionel 9 18 0.50 PECK, Dan 4 12 0.33 DALY, Aidan 78 18 4.33TAYLOR, Adrian 3 17 0.18 DAVISON, Marty 3 7 0.43 TAYLOR, Adrian 60 17 3.53DAVISON, Marty 2 7 0.29 TAYLOR, Adrian 3 17 0.18 CROZIER, Sam 10 9 1.11ELERS, Carew 1 6 0.17 ELERS, Carew 1 6 0.17 DAVISON, Marty 9 7 1.29ELERS, Carew 4 6 0.67Blocks Num G Avg Turn Overs Num G Avg Fouls Off Pers TotalWURTZ, Trenton 14 18 0.78 KENCH, Jeremy 56 18 3.11 WURTZ, Trenton 5 49 54BEHRENDORFF, Tim 13 13 1.00 DALY, Aidan 47 18 2.61 KENCH, Jeremy 4 45 49HOPGOOD, Lionel 12 18 0.67 MORRISON, Mark 38 18 2.11 BEHRENDORFF, Tim 3 33 36KENCH, Jeremy 7 18 0.39 WINITANA, Paora 32 12 2.67 DALY, Aidan 0 36 36MORRISON, Mark 3 18 0.17 WURTZ, Trenton 26 18 1.44 HOPGOOD, Lionel 1 34 35WINITANA, Paora 2 12 0.17 TAYLOR, Adrian 14 17 0.82 TAYLOR, Adrian 0 28 28TAYLOR, Adrian 2 17 0.12 BEHRENDORFF, Tim 14 13 1.08 MORRISON, Mark 4 23 27CROZIER, Sam 2 9 0.22 PECK, Dan 13 12 1.08 PECK, Dan 1 23 24DALY, Aidan 1 18 0.06 HOPGOOD, Lionel 11 18 0.61 WINITANA, Paora 1 18 19DAVISON, Marty 7 7 1.00 DAVISON, Marty 0 5 5ELERS, Carew 3 6 0.50 CROZIER, Sam 0 4 4WARNE, Dean Le 1 2 0.50 ELERS, Carew 0 3 3CROZIER, Sam 1 9 0.11 WARNE, Dean Le 0 1 1Charges Taken Num G Avg Productivity Value G Avg Def Assist Num G AvgWURTZ, Trenton <strong>15</strong> 18 0.83 KENCH, Jeremy 296 18 16.4KENCH, Jeremy 7 18 0.39 WURTZ, Trenton 251 18 13.9DALY, Aidan 3 18 0.17 BEHRENDORFF, Tim 218 13 16.7MORRISON, Mark 3 18 0.17 MORRISON, Mark <strong>15</strong>9 18 8.81BEHRENDORFF, Tim 2 13 0.<strong>15</strong> WINITANA, Paora <strong>15</strong>5 12 12.9DAVISON, Marty 1 7 0.14 HOPGOOD, Lionel 98.0 18 5.44HOPGOOD, Lionel 1 18 0.06 DALY, Aidan 75.0 18 4.17PECK, Dan 51.5 12 4.29CROZIER, Sam 18.5 9 2.06DAVISON, Marty 2.50 7 0.36ELERS, Carew 1.50 6 0.25
Fico Finance Nelson Giants Basketball - Season Box ScoreRecord Overall Home Away NeutralAll Games 11-6 6-2 5-4 0-0Conference 11-6 6-2 5-4 0-0Non-Conference 0-0 0-0 0-0 0-0Playoff 0-0 0-0 0-0 0-0Name G/GS FG FG% 3Pt 3Pt% FT FT% PTS Avg P/S ORB DRB TR Avg PF AST TO BS ST DA MINBrad Maclachlan 1/0 0/0 0.00 0/0 0.00 0/0 0.00 0 0.00 0.00 1 0 1 1.00 0 0 0 0 0 0 1:00Darryl Jones 14/4 34/83 41.0 19/43 44.2 21/25 84.0 108 7.71 1.14 19 42 61 4.36 28 13 20 0 6 0 297Samuel Dempster 10/0 9/19 47.4 2/3 66.7 21/28 75.0 41 4.10 1.24 6 10 16 1.60 4 1 3 0 3 0 83Bronson Beri 6/0 6/<strong>15</strong> 40.0 2/5 40.0 2/6 33.3 16 2.67 0.89 3 6 9 1.50 5 0 3 1 3 0 51:53Tony Rampton <strong>15</strong>/<strong>15</strong> 60/147 40.8 14/43 32.6 37/61 60.7 171 11.4 0.97 32 61 93 6.20 41 19 25 5 5 0 484Phill Jones 17/17 1<strong>15</strong>/280 41.1 39/102 38.2 89/102 87.3 358 21.1 1.08 11 64 75 4.41 38 72 39 1 29 0 599Mika Vukona <strong>15</strong>/<strong>15</strong> 73/<strong>15</strong>5 47.1 16/42 38.1 24/36 66.7 186 12.4 1.08 43 104 147 9.80 52 35 42 <strong>15</strong> 27 0 479Mike Fitchett 17/17 52/127 40.9 36/90 40.0 19/22 86.4 <strong>15</strong>9 9.35 1.<strong>15</strong> 9 48 57 3.35 30 42 40 1 23 0 518Nico Ritschny 5/0 3/8 37.5 1/5 20.0 5/6 83.3 12 2.40 1.09 0 4 4 0.80 5 3 3 0 1 0 28:41Steve Bill 1/0 0/0 0.00 0/0 0.00 0/0 0.00 0 0.00 0.00 0 0 0 0.00 0 0 1 0 0 0 1:00Josh Bloxham 17/3 37/91 40.7 17/41 41.5 8/16 50.0 99 5.82 1.00 8 26 34 2.00 18 21 17 0 <strong>15</strong> 0 327Tom Ingham 1/0 0/1 0.00 0/0 0.00 0/0 0.00 0 0.00 0.00 0 1 1 1.00 1 0 0 0 0 0 2:07Ben Wright 6/0 2/5 40.0 1/4 25.0 5/8 62.5 10 1.67 1.11 0 4 4 0.67 5 7 3 0 2 0 51:37Michael Harrison 16/14 90/169 53.3 7/<strong>15</strong> 46.7 43/75 57.3 230 14.4 1.12 31 64 95 5.94 31 24 27 29 19 0 497<strong>Team</strong> 46 41 87 18 1Totals 17 481/1100 43.7 <strong>15</strong>4/393 39.2 274/385 71.2 1390 81.8 1.08 209 475 684 40.2 258 237 241 52 134 0G/GS FG FG% 3Pt 3Pt% FT FT% PTS Avg P/S ORB DRB TR Avg PF AST TO BS ST DAOpponents 17 500/1148 43.6 106/337 31.5 210/299 70.2 1316 77.4 1.01 228 463 691 40.6 320 189 253 34 117 0SHOOTING Fico Finance Nelson Giants OpponentsField Goal% 43.7 43.62Pt Goal% 46.3 48.63Pt Goal% 39.2 31.5Free Throw % 71.2 70.2BALL HANDLINGAssists 237 (13.9) 189 (11.1)Turnovers 241 (14.2) 253 (14.9)Steals 134 (7.9) 117 (6.9)Def. Assists 0 (0.0) 0 (0.0)BH Error% 17.8 19.0OTHEROff. Possessions 1352 (79.5) 1333 (78.4)Pts per Possession 1.03 0.99Def. Efficiency 54.6% 52.1%REBOUNDING Fico Finance Nelson Giants OpponentsTotal Rebound % 49.7 50.3Off. Rebound % 31.1 32.4Def. Rebound % 67.6 68.9Total Rebounds 684 (40.2) 691 (40.6)Off. Rebounds 209 (12.3) 228 (13.4)Def. Rebounds 475 (27.9) 463 (27.2)<strong>Team</strong> Rebounds 87 (5.1) 92 (5.4)SCORINGTotal Points 1390 (81.8) 1316 (77.4)Pts off Turnovers 198 (11.6) 173 (10.2)2nd Effort Pts 135 (7.9) 130 (7.6)Pts off Bench 220 (12.9) 306 (18.0)3Pt Points 462 (27.2) 318 (18.7)Free Throw Pts 274 (16.1) 210 (12.4)Charges Taken 9 7
Fico Finance Nelson Giants Basketball - Season SummaryRecordDate Overall Conf SiteScore Opponent High Point High Rebounder04/03/<strong>2010</strong> 0- 1 0- 1 A L 73-92 Waikato Pistons 24-M Harrison 10-T Rampton05/03/<strong>2010</strong> 1- 1 1- 1 A W 84-82 Taranaki Mountainairs 37-P Jones 7-T Rampton13/03//<strong>2010</strong> 2- 1 2- 1 H W 92-86 Wellington Saints 29-P Jones 10-M Harrison19/03/<strong>2010</strong> 3- 1 3- 1 H W 92-60 Oceanagold Nuggets 23-M Harrison 10-M Harrison01/04/<strong>2010</strong> 3- 2 3- 2 A L 79-83 Harbour Heat 25-P Jones 11-P Jones09/04/<strong>2010</strong> 4- 2 4- 2 A W 74-72 Zerofees Southland Sharks 19-M Harrison 8-M Harrison09/04/<strong>2010</strong> 5- 2 5- 2 A W 102-71 Oceanagold Nuggets 14-D Jones 10-T Rampton, M Vukona17/04/<strong>2010</strong> 6- 2 6- 2 H W 92-81 Chrischurch Cougars 24-T Rampton 10-M Vukona04/02/<strong>2010</strong> 7- 2 7- 2 H W 68-57 0800 Easy LPG Bay Hawks 19-P Jones 8-M Vukona06/05/<strong>2010</strong> 8- 2 8- 2 A W 106-86 McDonalds Manawatu Jets 34-P Jones 18-M Vukona07/05/<strong>2010</strong> 8- 3 8- 3 A L 54-80 0800 Easy LPG Bay Hawks 18-P Jones 12-M Vukona<strong>15</strong>/05/<strong>2010</strong> 9- 3 9- 3 H W 81-61 Taranaki Mountainairs 19-P Jones 12-M Vukona, M Harrison21/05/<strong>2010</strong> 10- 3 10- 3 A W 80-65 Exodus Wellington Saints 24-P Jones 11-M Vukona22/05/<strong>2010</strong> 10- 4 10- 4 A L 63-74 Chrischurch Cougars 17-P Jones 11-M Vukona26/05/<strong>2010</strong> 11- 4 11- 4 H W 76-71 Waikato Pistons 21-M Vukona 7-M Vukona05/06/<strong>2010</strong> 11- 5 11- 5 H L 102-103 OT McDonalds Manawatu Jets 21-M Fitchett 12-M Vukona11/06/<strong>2010</strong> 11- 6 11- 6 H L 72-92 Harbour Heat 40-P Jones 7-P Jones, M Vukona<strong>Team</strong> Statistics SummaryOpponent FG 3 Pt FT PTS ORB DRB TR PF AST TO BS ST DAWaikato Pistons 27/66 6/<strong>15</strong> 13/21 73 11 21 32 13 12 14 0 11 0Taranaki Mountainairs 26/56 9/20 23/33 84 7 23 30 20 12 10 4 10 0Wellington Saints 28/65 9/19 27/33 92 13 30 43 16 16 9 2 6 0Oceanagold Nuggets 35/65 5/<strong>15</strong> 17/25 92 10 36 46 16 20 16 2 11 0Harbour Heat 30/69 9/24 10/16 79 13 29 42 18 13 13 8 6 0Zerofees Southland Sharks 27/68 9/26 11/19 74 12 26 38 9 10 <strong>15</strong> 3 5 0Oceanagold Nuggets 34/67 11/34 23/30 102 17 35 52 <strong>15</strong> 22 19 0 5 0Chrischurch Cougars 29/63 10/19 24/36 92 10 33 43 20 19 18 3 9 00800 Easy LPG Bay Hawks 23/59 5/19 17/21 68 14 28 42 13 11 11 6 7 0McDonalds Manawatu Jets 36/67 13/26 21/24 106 10 34 44 14 20 17 7 8 00800 Easy LPG Bay Hawks 20/60 5/21 9/19 54 16 23 39 13 8 16 1 8 0Taranaki Mountainairs 28/73 10/22 <strong>15</strong>/16 81 14 37 51 14 12 12 4 6 0Exodus Wellington Saints 30/60 10/24 10/13 80 10 26 36 10 12 <strong>15</strong> 1 8 0Chrischurch Cougars 25/63 9/26 4/10 63 10 26 36 21 14 17 3 10 0Waikato Pistons 24/57 10/22 18/23 76 12 24 36 12 11 16 1 10 0McDonalds Manawatu Jets 33/73 17/41 19/29 102 14 28 42 17 18 16 2 10 0Harbour Heat 26/69 7/20 13/17 72 16 16 32 17 7 7 5 4 0Individual Season Highs<strong>Team</strong> Season HighsMost Pts: 40 P Jones vs. Harbour HeatMost Pts: 106 vs. McDonalds Manawatu JetsMost Fgm: 14 P Jones vs. Harbour HeatMost Fgm: 36 vs. McDonalds Manawatu JetsMost Fga: 27 P Jones vs. Harbour HeatMost Fga: 73 vs. Taranaki MountainairsMost 3pm: 6 P Jones vs. Multiple Oppo.Most 3pm: 17 vs. McDonalds Manawatu JetsMost 3pa: 12 P Jones vs. Taranaki Mountainairs Most 3pa: 41 vs. McDonalds Manawatu JetsMost Ftm: 13 P Jones vs. Taranaki Mountainairs Most Ftm: 27 vs. Wellington SaintsMost Fta: 16 P Jones vs. Taranaki Mountainairs Most Fta: 36 vs. Chrischurch CougarsMost Reb: 18 M Vukona vs. McDonalds Manawatu Jets Most Reb: 52 vs. Oceanagold NuggetsMost Orb: 6 M Vukona vs. 0800 Easy LPG Bay Hawks Most Orb: 17 vs. Oceanagold NuggetsMost Drb: 16 M Vukona vs. McDonalds Manawatu Jets Most Drb: 37 vs. Taranaki MountainairsMost Ast: 8 P Jones vs. 0800 Easy LPG Bay Hawks Most Ast: 22 vs. Oceanagold NuggetsMost Stl: 5 M Vukona vs. Chrischurch Cougars Most Stl: 11 vs. Waikato PistonsMost Blk: 5 Multiple PlayersMost Blk: 8 vs. Harbour Heat
CyberSports for Basketball - Offensive Lineup Combination AnalysisFico Finance Nelson GiantsMost Often Used Lineup: 12-T Rampton, 13-P Jones, 14-M Vukona, <strong>15</strong>-M Fitchett, 55-M HarrisonMost Productive Offensive Lineup: 12-T Rampton, 13-P Jones, 14-M Vukona, <strong>15</strong>-M Fitchett, 55-M HarrisonMost Productive Rebounding Lineup: 7-D Jones, 12-T Rampton, 13-P Jones, <strong>15</strong>-M Fitchett, 55-M HarrisonBest Defensive Combination: 11-B Beri, 13-P Jones, 14-M Vukona, 21-J Bloxham, 55-M HarrisonBest Lineup to Force Turnovers: 7-D Jones, 12-T Rampton, 13-P Jones, 14-M Vukona, 21-J BloxhamBest Overall Lineup:12-T Rampton, 13-P Jones, 14-M Vukona, <strong>15</strong>-M Fitchett, 55-M HarrisonBest Free Throw Shooting Lineup: 7-D Jones, 10-S Dempster, 13-P Jones, <strong>15</strong>-M Fitchett, 20-N RitschnyLineups Sorted by Playing TimePlayers Time Pts12-T Rampton, 13-P Jones, 14-M Vukona, <strong>15</strong>-M Fitchett, 55-M Harrison 112.08 +2712-T Rampton, 13-P Jones, <strong>15</strong>-M Fitchett, 21-J Bloxham, 55-M Harrison 46.05 -97-D Jones, 13-P Jones, 14-M Vukona, <strong>15</strong>-M Fitchett, 55-M Harrison 45.52 +137-D Jones, 12-T Rampton, 13-P Jones, 14-M Vukona, <strong>15</strong>-M Fitchett 36.10 +277-D Jones, 12-T Rampton, 13-P Jones, <strong>15</strong>-M Fitchett, 55-M Harrison 18.08 -212-T Rampton, 13-P Jones, 14-M Vukona, 21-J Bloxham, 55-M Harrison 17.42 +57-D Jones, 10-S Dempster, 20-N Ritschny, 21-J Bloxham, 31-B Wright 13.87 +27-D Jones, 13-P Jones, 14-M Vukona, 21-J Bloxham, 55-M Harrison 12.62 -512-T Rampton, 13-P Jones, 14-M Vukona, <strong>15</strong>-M Fitchett, 21-J Bloxham 11.50 -77-D Jones, 12-T Rampton, 13-P Jones, 14-M Vukona, 21-J Bloxham 11.10 +16Lineups Sorted by Points per MinutePlayers PPM Norm Pts Time7-D Jones, 12-T Rampton, 13-P Jones, 14-M Vukona, 21-J Bloxham +1.44 +57.66 +16 11.107-D Jones, 12-T Rampton, 13-P Jones, 14-M Vukona, <strong>15</strong>-M Fitchett +0.75 +29.92 +27 36.107-D Jones, 13-P Jones, 14-M Vukona, <strong>15</strong>-M Fitchett, 55-M Harrison +0.29 +11.42 +13 45.5212-T Rampton, 13-P Jones, 14-M Vukona, 21-J Bloxham, 55-M Harrison +0.29 +11.48 +5 17.4212-T Rampton, 13-P Jones, 14-M Vukona, <strong>15</strong>-M Fitchett, 55-M Harrison +0.24 +9.64 +27 112.087-D Jones, 10-S Dempster, 20-N Ritschny, 21-J Bloxham, 31-B Wright +0.14 +5.77 +2 13.877-D Jones, 12-T Rampton, 13-P Jones, <strong>15</strong>-M Fitchett, 55-M Harrison -0.11 -4.42 -2 18.0812-T Rampton, 13-P Jones, <strong>15</strong>-M Fitchett, 21-J Bloxham, 55-M Harrison -0.20 -7.82 -9 46.057-D Jones, 13-P Jones, 14-M Vukona, 21-J Bloxham, 55-M Harrison -0.40 -<strong>15</strong>.85 -5 12.6212-T Rampton, 13-P Jones, 14-M Vukona, <strong>15</strong>-M Fitchett, 21-J Bloxham -0.61 -24.35 -7 11.50Lineups Sorted by Rebounds per MinutePlayers RPM Norm Reb Time7-D Jones, 12-T Rampton, 13-P Jones, <strong>15</strong>-M Fitchett, 55-M Harrison +0.50 +19.91 +9 18.087-D Jones, 10-S Dempster, 20-N Ritschny, 21-J Bloxham, 31-B Wright +0.22 +8.65 +3 13.8712-T Rampton, 13-P Jones, 14-M Vukona, <strong>15</strong>-M Fitchett, 55-M Harrison +0.20 +7.85 +22 112.0812-T Rampton, 13-P Jones, 14-M Vukona, 21-J Bloxham, 55-M Harrison +0.11 +4.59 +2 17.427-D Jones, 12-T Rampton, 13-P Jones, 14-M Vukona, <strong>15</strong>-M Fitchett +0.06 +2.22 +2 36.107-D Jones, 13-P Jones, 14-M Vukona, <strong>15</strong>-M Fitchett, 55-M Harrison +0.00 +0.00 +0 45.527-D Jones, 12-T Rampton, 13-P Jones, 14-M Vukona, 21-J Bloxham -0.09 -3.60 -1 11.107-D Jones, 13-P Jones, 14-M Vukona, 21-J Bloxham, 55-M Harrison -0.16 -6.34 -2 12.6212-T Rampton, 13-P Jones, 14-M Vukona, <strong>15</strong>-M Fitchett, 21-J Bloxham -0.26 -10.43 -3 11.5012-T Rampton, 13-P Jones, <strong>15</strong>-M Fitchett, 21-J Bloxham, 55-M Harrison -0.63 -25.19 -29 46.05Total time captured in lineups: 324.33Productive scoring minutes: 236.08Productive rebounding minutes: 197.55Productive scoring percentage: 72.79%Productive rebounding percentage: 60.91%
CyberSports for Basketball - Defensive Lineup Combination AnalysisFico Finance Nelson GiantsLineup Sorted by Defensive PossessionsOppoDefPlayers Pts Poss12-T Rampton, 13-P Jones, 14-M Vukona, <strong>15</strong>-M Fitchett, 55-M Harrison 194 26712-T Rampton, 13-P Jones, <strong>15</strong>-M Fitchett, 21-J Bloxham, 55-M Harrison 97 1277-D Jones, 13-P Jones, 14-M Vukona, <strong>15</strong>-M Fitchett, 55-M Harrison 81 997-D Jones, 12-T Rampton, 13-P Jones, 14-M Vukona, <strong>15</strong>-M Fitchett 52 837-D Jones, 12-T Rampton, 13-P Jones, <strong>15</strong>-M Fitchett, 55-M Harrison 39 527-D Jones, 10-S Dempster, 20-N Ritschny, 21-J Bloxham, 31-B Wright 31 4212-T Rampton, 13-P Jones, 14-M Vukona, 21-J Bloxham, 55-M Harrison 29 387-D Jones, 13-P Jones, 14-M Vukona, 21-J Bloxham, 55-M Harrison 25 2911-B Beri, 13-P Jones, 14-M Vukona, 21-J Bloxham, 55-M Harrison 10 277-D Jones, 12-T Rampton, 13-P Jones, 14-M Vukona, 21-J Bloxham 16 25Lineup Sorted by Points per Possession AllowedPts/DefPlayers Poss Poss11-B Beri, 13-P Jones, 14-M Vukona, 21-J Bloxham, 55-M Harrison 0.37 277-D Jones, 12-T Rampton, 13-P Jones, 14-M Vukona, <strong>15</strong>-M Fitchett 0.63 837-D Jones, 12-T Rampton, 13-P Jones, 14-M Vukona, 21-J Bloxham 0.64 2512-T Rampton, 13-P Jones, 14-M Vukona, <strong>15</strong>-M Fitchett, 55-M Harrison 0.73 2677-D Jones, 10-S Dempster, 20-N Ritschny, 21-J Bloxham, 31-B Wright 0.74 427-D Jones, 12-T Rampton, 13-P Jones, <strong>15</strong>-M Fitchett, 55-M Harrison 0.75 5212-T Rampton, 13-P Jones, <strong>15</strong>-M Fitchett, 21-J Bloxham, 55-M Harrison 0.76 12712-T Rampton, 13-P Jones, 14-M Vukona, 21-J Bloxham, 55-M Harrison 0.76 387-D Jones, 13-P Jones, 14-M Vukona, <strong>15</strong>-M Fitchett, 55-M Harrison 0.82 997-D Jones, 13-P Jones, 14-M Vukona, 21-J Bloxham, 55-M Harrison 0.86 29Lineup Sorted by Defensive Efficiency (Stops)Def Def DefPlayers Eff Stops Poss7-D Jones, 12-T Rampton, 13-P Jones, 14-M Vukona, 21-J Bloxham 0.60 <strong>15</strong> 257-D Jones, 13-P Jones, 14-M Vukona, 21-J Bloxham, 55-M Harrison 0.52 <strong>15</strong> 297-D Jones, 12-T Rampton, 13-P Jones, <strong>15</strong>-M Fitchett, 55-M Harrison 0.50 26 527-D Jones, 12-T Rampton, 13-P Jones, 14-M Vukona, <strong>15</strong>-M Fitchett 0.49 41 837-D Jones, 13-P Jones, 14-M Vukona, <strong>15</strong>-M Fitchett, 55-M Harrison 0.45 45 9912-T Rampton, 13-P Jones, 14-M Vukona, <strong>15</strong>-M Fitchett, 55-M Harrison 0.44 118 26712-T Rampton, 13-P Jones, 14-M Vukona, 21-J Bloxham, 55-M Harrison 0.42 16 3812-T Rampton, 13-P Jones, <strong>15</strong>-M Fitchett, 21-J Bloxham, 55-M Harrison 0.39 50 1277-D Jones, 10-S Dempster, 20-N Ritschny, 21-J Bloxham, 31-B Wright 0.38 16 4211-B Beri, 13-P Jones, 14-M Vukona, 21-J Bloxham, 55-M Harrison 0.37 10 27Lineup Sorted by Percentage of Ball Handling Errors Forced% BH Oppo DefPlayers Err TO Poss7-D Jones, 12-T Rampton, 13-P Jones, 14-M Vukona, 21-J Bloxham 0.28 7 2512-T Rampton, 13-P Jones, 14-M Vukona, 21-J Bloxham, 55-M Harrison 0.18 7 3812-T Rampton, 13-P Jones, <strong>15</strong>-M Fitchett, 21-J Bloxham, 55-M Harrison 0.19 24 12712-T Rampton, 13-P Jones, 14-M Vukona, <strong>15</strong>-M Fitchett, 55-M Harrison 0.17 45 2677-D Jones, 12-T Rampton, 13-P Jones, 14-M Vukona, <strong>15</strong>-M Fitchett 0.16 13 837-D Jones, 13-P Jones, 14-M Vukona, 21-J Bloxham, 55-M Harrison 0.14 4 297-D Jones, 13-P Jones, 14-M Vukona, <strong>15</strong>-M Fitchett, 55-M Harrison 0.13 13 997-D Jones, 12-T Rampton, 13-P Jones, <strong>15</strong>-M Fitchett, 55-M Harrison 0.12 6 527-D Jones, 10-S Dempster, 20-N Ritschny, 21-J Bloxham, 31-B Wright 0.07 3 4211-B Beri, 13-P Jones, 14-M Vukona, 21-J Bloxham, 55-M Harrison 0.04 1 27
Fico Finance Nelson Giants Basketball - Season Statistical RankingField Goals Made Att FG% 3 Point Goals Made Att 3FG% Free Throws Made Att FT%HARRISON, Michael 90 169 53.3 DEMPSTER, Samuel 2 3 66.7 JONES, Phill 89 102 87.3DEMPSTER, Samuel 9 19 47.4 HARRISON, Michael 7 <strong>15</strong> 46.7 FITCHETT, Mike 19 22 86.4VUKONA, Mika 73 <strong>15</strong>5 47.1 JONES, Darryl 19 43 44.2 JONES, Darryl 21 25 84.0JONES, Phill 1<strong>15</strong> 280 41.1 BLOXHAM, Josh 17 41 41.5 RITSCHNY, Nico 5 6 83.3FITCHETT, Mike 52 127 40.9 FITCHETT, Mike 36 90 40.0 DEMPSTER, Samuel 21 28 75.0JONES, Darryl 34 83 41.0 BERI, Bronson 2 5 40.0 VUKONA, Mika 24 36 66.7RAMPTON, Tony 60 147 40.8 JONES, Phill 39 102 38.2 WRIGHT, Ben 5 8 62.5BLOXHAM, Josh 37 91 40.7 VUKONA, Mika 16 42 38.1 RAMPTON, Tony 37 61 60.7BERI, Bronson 6 <strong>15</strong> 40.0 RAMPTON, Tony 14 43 32.6 HARRISON, Michael 43 75 57.3WRIGHT, Ben 2 5 40.0 WRIGHT, Ben 1 4 25.0 BLOXHAM, Josh 8 16 50.0RITSCHNY, Nico 3 8 37.5 RITSCHNY, Nico 1 5 20.0 BERI, Bronson 2 6 33.3Off Rebounds Num G Avg Def Rebounds Num G Avg Total Rebounds Num G AvgVUKONA, Mika 43 <strong>15</strong> 2.87 VUKONA, Mika 104 <strong>15</strong> 6.93 VUKONA, Mika 147 <strong>15</strong> 9.80RAMPTON, Tony 32 <strong>15</strong> 2.13 JONES, Phill 64 17 3.76 HARRISON, Michael 95 16 5.94HARRISON, Michael 31 16 1.94 HARRISON, Michael 64 16 4.00 RAMPTON, Tony 93 <strong>15</strong> 6.20JONES, Darryl 19 14 1.36 RAMPTON, Tony 61 <strong>15</strong> 4.07 JONES, Phill 75 17 4.41JONES, Phill 11 17 0.65 FITCHETT, Mike 48 17 2.82 JONES, Darryl 61 14 4.36FITCHETT, Mike 9 17 0.53 JONES, Darryl 42 14 3.00 FITCHETT, Mike 57 17 3.35BLOXHAM, Josh 8 17 0.47 BLOXHAM, Josh 26 17 1.53 BLOXHAM, Josh 34 17 2.00DEMPSTER, Samuel 6 10 0.60 DEMPSTER, Samuel 10 10 1.00 DEMPSTER, Samuel 16 10 1.60BERI, Bronson 3 6 0.50 BERI, Bronson 6 6 1.00 BERI, Bronson 9 6 1.50MACLACHLAN, Brad 1 1 1.00 RITSCHNY, Nico 4 5 0.80 RITSCHNY, Nico 4 5 0.80WRIGHT, Ben 4 6 0.67 WRIGHT, Ben 4 6 0.67INGHAM, Tom 1 1 1.00 MACLACHLAN, Brad 1 1 1.00INGHAM, Tom 1 1 1.00Assists Num G Avg Steals Num G Avg Scoring Num G AvgJONES, Phill 72 17 4.24 JONES, Phill 29 17 1.71 JONES, Phill 358 17 21.1FITCHETT, Mike 42 17 2.47 VUKONA, Mika 27 <strong>15</strong> 1.80 HARRISON, Michael 230 16 14.4VUKONA, Mika 35 <strong>15</strong> 2.33 FITCHETT, Mike 23 17 1.35 VUKONA, Mika 186 <strong>15</strong> 12.4HARRISON, Michael 24 16 1.50 HARRISON, Michael 19 16 1.19 RAMPTON, Tony 171 <strong>15</strong> 11.4BLOXHAM, Josh 21 17 1.24 BLOXHAM, Josh <strong>15</strong> 17 0.88 FITCHETT, Mike <strong>15</strong>9 17 9.35RAMPTON, Tony 19 <strong>15</strong> 1.27 JONES, Darryl 6 14 0.43 JONES, Darryl 108 14 7.71JONES, Darryl 13 14 0.93 RAMPTON, Tony 5 <strong>15</strong> 0.33 BLOXHAM, Josh 99 17 5.82WRIGHT, Ben 7 6 1.17 DEMPSTER, Samuel 3 10 0.30 DEMPSTER, Samuel 41 10 4.10RITSCHNY, Nico 3 5 0.60 BERI, Bronson 3 6 0.50 BERI, Bronson 16 6 2.67DEMPSTER, Samuel 1 10 0.10 WRIGHT, Ben 2 6 0.33 RITSCHNY, Nico 12 5 2.40RITSCHNY, Nico 1 5 0.20 WRIGHT, Ben 10 6 1.67Blocks Num G Avg Turn Overs Num G Avg Fouls Off Pers TotalHARRISON, Michael 29 16 1.81 VUKONA, Mika 42 <strong>15</strong> 2.80 VUKONA, Mika 3 49 52VUKONA, Mika <strong>15</strong> <strong>15</strong> 1.00 FITCHETT, Mike 40 17 2.35 RAMPTON, Tony 0 41 41RAMPTON, Tony 5 <strong>15</strong> 0.33 JONES, Phill 39 17 2.29 JONES, Phill 3 35 38BERI, Bronson 1 6 0.17 HARRISON, Michael 27 16 1.69 HARRISON, Michael 2 29 31JONES, Phill 1 17 0.06 RAMPTON, Tony 25 <strong>15</strong> 1.67 FITCHETT, Mike 1 29 30FITCHETT, Mike 1 17 0.06 JONES, Darryl 20 14 1.43 JONES, Darryl 0 28 28BLOXHAM, Josh 17 17 1.00 BLOXHAM, Josh 1 17 18DEMPSTER, Samuel 3 10 0.30 BERI, Bronson 0 5 5BERI, Bronson 3 6 0.50 RITSCHNY, Nico 0 5 5RITSCHNY, Nico 3 5 0.60 WRIGHT, Ben 0 5 5WRIGHT, Ben 3 6 0.50 DEMPSTER, Samuel 0 4 4BILL, Steve 1 1 1.00 INGHAM, Tom 0 1 1Charges Taken Num G Avg Productivity Value G Avg Def Assist Num G AvgVUKONA, Mika 3 <strong>15</strong> 0.20 JONES, Phill 288 17 16.9RAMPTON, Tony 2 <strong>15</strong> 0.13 VUKONA, Mika 247 <strong>15</strong> 16.4JONES, Phill 2 17 0.12 HARRISON, Michael 244 16 <strong>15</strong>.2FITCHETT, Mike 2 17 0.12 FITCHETT, Mike 141 17 8.26RAMPTON, Tony 134 <strong>15</strong> 8.93JONES, Darryl 96.5 14 6.89BLOXHAM, Josh 76.0 17 4.47DEMPSTER, Samuel 40.0 10 4.00BERI, Bronson 9.50 6 1.58WRIGHT, Ben 9.00 6 1.50RITSCHNY, Nico 6.00 5 1.20MACLACHLAN, Brad 1.50 1 1.50
0800 Easy LPG Bay Hawks Basketball - Season Box ScoreRecord Overall Home Away NeutralAll Games 11-6 6-2 5-4 0-0Conference 11-6 6-2 5-4 0-0Non-Conference 0-0 0-0 0-0 0-0Playoff 0-0 0-0 0-0 0-0Name G/GS FG FG% 3Pt 3Pt% FT FT% PTS Avg P/S ORB DRB TR Avg PF AST TO BS ST DA MINJarrod Kenny 13/1 23/52 44.2 3/16 18.8 6/10 60.0 55 4.23 0.96 18 13 31 2.38 12 22 16 1 2 0 194Everard Bartlett 17/17 88/187 47.1 28/78 35.9 32/45 71.1 236 13.9 1.13 21 35 56 3.29 23 41 26 4 26 0 495Miles Pearce 17/0 31/53 58.5 1/1 100 10/19 52.6 73 4.29 1.18 17 22 39 2.29 23 6 12 3 2 0 192Josh Pace 11/11 90/164 54.9 4/20 20.0 34/51 66.7 218 19.8 1.<strong>15</strong> 23 26 49 4.45 24 43 17 2 11 0 345Nat Connell 17/5 54/120 45.0 14/35 40.0 25/41 61.0 147 8.65 1.05 13 40 53 3.12 33 31 36 5 17 0 379Chris Daniel 17/17 74/136 54.4 40/86 46.5 47/61 77.0 235 13.8 1.42 20 56 76 4.47 51 24 26 9 13 0 465Haylan Tahau 6/0 0/6 0.00 0/1 0.00 0/0 0.00 0 0.00 0.00 0 1 1 0.17 1 3 0 0 1 0 20:17Ben Hill 17/0 58/128 45.3 43/94 45.7 7/11 63.6 166 9.76 1.25 14 62 76 4.47 46 20 17 0 7 0 355Jon Rogers 8/8 43/82 52.4 0/1 0.00 22/34 64.7 108 13.5 1.09 <strong>15</strong> 40 55 6.88 23 4 <strong>15</strong> 17 4 0 201Jamil Terrell 9/9 32/83 38.6 1/9 11.1 27/40 67.5 92 10.2 0.89 21 68 89 9.89 33 10 29 14 6 0 260Paul Henare 5/0 9/<strong>15</strong> 60.0 0/1 0.00 4/7 57.1 22 4.40 1.22 2 5 7 1.40 7 16 6 0 4 0 78Warrick Siddall 4/0 0/1 0.00 0/1 0.00 0/0 0.00 0 0.00 0.00 0 3 3 0.75 1 0 1 1 0 0 11:24David Langrell 17/17 36/95 37.9 23/49 46.9 17/24 70.8 112 6.59 1.05 18 63 81 4.76 20 16 28 1 10 0 367George Golden 5/0 20/40 50.0 3/14 21.4 2/5 40.0 45 9.00 1.07 2 4 6 1.20 9 4 2 0 4 0 81Czebalos Smiler 0/0 0/0 0.00 0/0 0.00 0/0 0.00 0 0.00 0.00 0 0 0 0.00 0 0 0 0 0 0 DNP<strong>Team</strong> 4 52 36 88 1 6Totals 17 559/1164 48.0 160/407 39.3 233/348 67.0 <strong>15</strong>13 89.0 1.13 236 474 710 41.8 307 240 237 57 107 0G/GS FG FG% 3Pt 3Pt% FT FT% PTS Avg P/S ORB DRB TR Avg PF AST TO BS ST DAOpponents 17 482/1134 42.5 102/350 29.1 269/367 73.3 1335 78.5 1.01 222 434 656 38.6 3<strong>15</strong> 198 227 49 127 0SHOOTING 0800 Easy LPG Bay Hawks OpponentsField Goal% 48.0 42.52Pt Goal% 52.7 48.53Pt Goal% 39.3 29.1Free Throw % 67.0 73.3BALL HANDLINGAssists 240 (14.1) 198 (11.6)Turnovers 237 (13.9) 227 (13.4)Steals 107 (6.3) 127 (7.5)Def. Assists 0 (0.0) 0 (0.0)BH Error% 17.6 16.8OTHEROff. Possessions 1347 (79.2) 1352 (79.5)Pts per Possession 1.12 0.99Def. Efficiency 51.8% 49.8%REBOUNDING 0800 Easy LPG Bay Hawks OpponentsTotal Rebound % 52.0 48.0Off. Rebound % 35.2 31.9Def. Rebound % 68.1 64.8Total Rebounds 710 (41.8) 656 (38.6)Off. Rebounds 236 (13.9) 222 (13.1)Def. Rebounds 474 (27.9) 434 (25.5)<strong>Team</strong> Rebounds 88 (5.2) 107 (6.3)SCORINGTotal Points <strong>15</strong>13 (89.0) 1335 (78.5)Pts off Turnovers 254 (14.9) 229 (13.5)2nd Effort Pts 184 (10.8) 175 (10.3)Pts off Bench 430 (25.3) 236 (13.9)3Pt Points 480 (28.2) 306 (18.0)Free Throw Pts 233 (13.7) 269 (<strong>15</strong>.8)Charges Taken <strong>15</strong> 19
0800 Easy LPG Bay Hawks Basketball - Season SummaryRecordDate Overall Conf Site Score Opponent High Point High Rebounder04/03/<strong>2010</strong> 0- 1 0- 1 A L 72-75 Chrischurch Cougars 18-D Langrell 10-D Langrell06/03/<strong>2010</strong> 1- 1 1- 1 A W 105-90 OT Zerofees Southland Sharks 23-E Bartlett 12-J Terrell13/03/<strong>2010</strong> 2- 1 2- 1 A W 118-76 McDonalds Manawatu Jets 23-J Terrell 7-D Langrell19/03/<strong>2010</strong> 2- 2 2- 2 H L 79-85 Zerofees Southland Sharks 16-B Hill 13-J Terrell01/04/<strong>2010</strong> 3- 2 3- 2 H W 92-72 Exodus Wellington Saints 17-G Golden 10-J Terrell04/04/<strong>2010</strong> 3- 3 3- 3 A L 79-82 OT Waikato Pistons 20-C Daniel 19-J Terrell09/04/<strong>2010</strong> 4- 3 4- 3 H W 78-73 Waikato Pistons 20-J Pace 13-J Terrell16/04/<strong>2010</strong> 4- 4 4- 4 H L 82-94 Harbour Heat 18-J Pace 4-D Langrell23/04/<strong>2010</strong> 5- 4 5- 4 H W 76-72 Chrischurch Cougars 21-J Pace 8-J Pace04/02/<strong>2010</strong> 5- 5 5- 5 A L 57-68 Fico Finance Nelson Giants 16-J Rogers 7-J Rogers07/05/<strong>2010</strong> 6- 5 6- 5 H W 80-54 Fico Finance Nelson Giants 18-J Pace 9-J Rogers09/05/<strong>2010</strong> 7- 5 7- 5 A W 99-76 Taranaki Mountainairs 24-J Pace 8-B Hill13/05/<strong>2010</strong> 7- 6 7- 6 A L 91-103 Exodus Wellington Saints 30-J Pace 9-J Rogers21/05/<strong>2010</strong> 8- 6 8- 6 A W 102-97 Harbour Heat 38-J Pace 7-C Daniel28/05/<strong>2010</strong> 9- 6 9- 6 H W 102-67 Oceanagold Nuggets 26-J Rogers 12-J Rogers11/06/<strong>2010</strong> 10- 6 10- 6 H W 87-68 Taranaki Mountainairs 20-J Pace 5-C Daniel, B Hill12/06/<strong>2010</strong> 11- 6 11- 6 A W 114-83 Oceanagold Nuggets 23-C Daniel 8-J Rogers<strong>Team</strong> Statistics SummaryOpponent FG 3 Pt FT PTS ORB DRB TR PF AST TO BS ST DAChrischurch Cougars 24/60 7/21 17/21 72 17 26 43 21 9 25 5 12 0Zerofees Southland Sharks 38/77 10/29 19/28 105 8 34 42 22 19 12 4 4 0McDonalds Manawatu Jets 36/58 16/29 28/43 118 9 37 46 19 <strong>15</strong> <strong>15</strong> 5 7 0Zerofees Southland Sharks 32/81 9/31 6/12 79 21 28 49 17 13 16 4 8 0Exodus Wellington Saints 35/69 9/20 13/19 92 8 30 38 21 20 13 1 5 0Waikato Pistons 26/65 8/21 19/27 79 12 40 52 26 10 24 1 6 0Waikato Pistons 26/66 10/21 16/24 78 16 27 43 <strong>15</strong> 13 13 2 4 0Harbour Heat 31/68 13/32 7/11 82 16 13 29 20 13 14 2 3 0Chrischurch Cougars 29/74 5/24 13/18 76 14 26 40 22 9 10 2 10 0Fico Finance Nelson Giants 23/63 6/23 5/10 57 16 23 39 17 12 18 2 2 0Fico Finance Nelson Giants 31/65 9/21 9/10 80 12 29 41 20 13 13 3 7 0Taranaki Mountainairs 38/70 11/22 12/16 99 13 28 41 17 11 14 4 10 0Exodus Wellington Saints 32/63 7/18 20/27 91 12 16 28 18 13 12 7 6 0Harbour Heat 34/63 11/25 23/32 102 14 25 39 21 16 <strong>15</strong> 3 4 0Oceanagold Nuggets 45/89 7/25 5/10 102 24 34 58 12 20 8 6 9 0Taranaki Mountainairs 35/64 5/17 12/21 87 13 29 42 12 7 7 0 3 0Oceanagold Nuggets 44/69 17/28 9/19 114 11 29 40 11 27 8 6 7 0Individual Season Highs<strong>Team</strong> Season HighsMost Pts: 38 J Pace vs. Harbour HeatMost Pts: 118 vs. McDonalds Manawatu JetsMost Fgm: 14 J Pace vs. Harbour HeatMost Fgm: 45 vs. Oceanagold NuggetsMost Fga: 21 J Pace vs. Exodus Wellington Saints Most Fga: 89 vs. Oceanagold NuggetsMost 3pm: 6 Multiple PlayersMost 3pm: 17 vs. Oceanagold NuggetsMost 3pa: 10 B Hill vs. McDonalds Manawatu Jets Most 3pa: 32 vs. Harbour HeatMost Ftm: 9 J Pace vs. Harbour HeatMost Ftm: 28 vs. McDonalds Manawatu JetsMost Fta: <strong>15</strong> J Pace vs. Harbour HeatMost Fta: 43 vs. McDonalds Manawatu JetsMost Reb: 19 J Terrell vs. Waikato PistonsMost Reb: 58 vs. Oceanagold NuggetsMost Orb: 6 J Terrell vs. Zerofees Southland Sharks Most Orb: 24 vs. Oceanagold NuggetsMost Drb: 14 J Terrell vs. Waikato PistonsMost Drb: 40 vs. Waikato PistonsMost Ast: 8 Multiple PlayersMost Ast: 27 vs. Oceanagold NuggetsMost Stl: 4 Multiple PlayersMost Stl: 12 vs. Chrischurch CougarsMost Blk: 5 J Rogers vs. Exodus Wellington Saints Most Blk: 7 vs. Exodus Wellington Saints
CyberSports for Basketball - Offensive Lineup Combination Analysis0800 Easy LPG Bay HawksMost Often Used Lineup: 5-E Bartlett, 11-N Connell, 12-C Daniel, 30-J Terrell, 44-D LangrellMost Productive Offensive Lineup: 5-E Bartlett, 11-N Connell, 12-C Daniel, 30-J Terrell, 44-D LangrellMost Productive Rebounding Lineup: 5-E Bartlett, 11-N Connell, 12-C Daniel, 14-B Hill, 44-D LangrellBest Defensive Combination: 5-E Bartlett, 11-N Connell, 12-C Daniel, 14-B Hill, 44-D LangrellBest Lineup to Force Turnovers: 5-E Bartlett, 11-N Connell, 12-C Daniel, 14-B Hill, 44-D LangrellBest Overall Lineup:5-E Bartlett, 9-J Pace, 12-C Daniel, 14-B Hill, 44-D LangrellBest Free Throw Shooting Lineup: 5-E Bartlett, 9-J Pace, 12-C Daniel, 30-J Rogers, 44-D LangrellLineups Sorted by Playing TimePlayers Time Pts5-E Bartlett, 11-N Connell, 12-C Daniel, 30-J Terrell, 44-D Langrell 65.35 +425-E Bartlett, 9-J Pace, 12-C Daniel, 30-J Rogers, 44-D Langrell 62.88 +395-E Bartlett, 11-N Connell, 12-C Daniel, 14-B Hill, 30-J Terrell 44.38 +99-J Pace, 5-E Bartlett, 12-C Daniel, 30-J Terrell, 44-D Langrell 43.37 +59-J Pace, 4-J Kenny, 6-M Pearce, 11-N Connell, 14-B Hill 19.70 +54-J Kenny, 5-E Bartlett, 6-M Pearce, 11-N Connell, 14-B Hill 13.95 -25-E Bartlett, 9-J Pace, 14-B Hill, 30-J Rogers, 32-P Henare 12.93 +<strong>15</strong>4-J Kenny, 5-E Bartlett, 12-C Daniel, 30-J Terrell, 44-D Langrell 12.22 +55-E Bartlett, 11-N Connell, 12-C Daniel, 14-B Hill, 44-D Langrell 11.22 +175-E Bartlett, 6-M Pearce, 9-J Pace, 12-C Daniel, 44-D Langrell 11.00 -4Lineups Sorted by Points per MinutePlayers PPM Norm Pts Time5-E Bartlett, 11-N Connell, 12-C Daniel, 14-B Hill, 44-D Langrell +1.52 +60.62 +17 11.225-E Bartlett, 9-J Pace, 14-B Hill, 30-J Rogers, 32-P Henare +1.16 +46.39 +<strong>15</strong> 12.935-E Bartlett, 11-N Connell, 12-C Daniel, 30-J Terrell, 44-D Langrell +0.64 +25.71 +42 65.355-E Bartlett, 9-J Pace, 12-C Daniel, 30-J Rogers, 44-D Langrell +0.62 +24.81 +39 62.884-J Kenny, 5-E Bartlett, 12-C Daniel, 30-J Terrell, 44-D Langrell +0.41 +16.37 +5 12.229-J Pace, 4-J Kenny, 6-M Pearce, 11-N Connell, 14-B Hill +0.25 +10.<strong>15</strong> +5 19.705-E Bartlett, 11-N Connell, 12-C Daniel, 14-B Hill, 30-J Terrell +0.20 +8.11 +9 44.389-J Pace, 5-E Bartlett, 12-C Daniel, 30-J Terrell, 44-D Langrell +0.12 +4.61 +5 43.374-J Kenny, 5-E Bartlett, 6-M Pearce, 11-N Connell, 14-B Hill -0.14 -5.73 -2 13.955-E Bartlett, 6-M Pearce, 9-J Pace, 12-C Daniel, 44-D Langrell -0.36 -14.55 -4 11.00Lineups Sorted by Rebounds per MinutePlayers RPM Norm Reb Time5-E Bartlett, 11-N Connell, 12-C Daniel, 14-B Hill, 44-D Langrell +0.71 +28.53 +8 11.225-E Bartlett, 11-N Connell, 12-C Daniel, 30-J Terrell, 44-D Langrell +0.26 +10.41 +17 65.359-J Pace, 4-J Kenny, 6-M Pearce, 11-N Connell, 14-B Hill +0.<strong>15</strong> +6.09 +3 19.705-E Bartlett, 11-N Connell, 12-C Daniel, 14-B Hill, 30-J Terrell +0.14 +5.41 +6 44.385-E Bartlett, 9-J Pace, 12-C Daniel, 30-J Rogers, 44-D Langrell +0.13 +5.09 +8 62.884-J Kenny, 5-E Bartlett, 12-C Daniel, 30-J Terrell, 44-D Langrell +0.08 +3.27 +1 12.225-E Bartlett, 9-J Pace, 14-B Hill, 30-J Rogers, 32-P Henare +0.00 +0.00 +0 12.939-J Pace, 5-E Bartlett, 12-C Daniel, 30-J Terrell, 44-D Langrell -0.16 -6.46 -7 43.375-E Bartlett, 6-M Pearce, 9-J Pace, 12-C Daniel, 44-D Langrell -0.18 -7.27 -2 11.004-J Kenny, 5-E Bartlett, 6-M Pearce, 11-N Connell, 14-B Hill -0.36 -14.34 -5 13.95Total time captured in lineups: 297.00Productive scoring minutes: 272.05Productive rebounding minutes: 2<strong>15</strong>.75Productive scoring percentage: 91.60%Productive rebounding percentage: 72.64%
CyberSports for Basketball - Defensive Lineup Combination Analysis0800 Easy LPG Bay HawksLineup Sorted by Defensive PossessionsOppoDefPlayers Pts Poss5-E Bartlett, 9-J Pace, 12-C Daniel, 30-J Rogers, 44-D Langrell 112 <strong>15</strong>35-E Bartlett, 11-N Connell, 12-C Daniel, 30-J Terrell, 44-D Langrell 113 <strong>15</strong>05-E Bartlett, 11-N Connell, 12-C Daniel, 14-B Hill, 30-J Terrell 79 1039-J Pace, 5-E Bartlett, 12-C Daniel, 30-J Terrell, 44-D Langrell 91 1019-J Pace, 4-J Kenny, 6-M Pearce, 11-N Connell, 14-B Hill 43 444-J Kenny, 5-E Bartlett, 6-M Pearce, 11-N Connell, 14-B Hill 27 375-E Bartlett, 6-M Pearce, 9-J Pace, 12-C Daniel, 44-D Langrell 30 355-E Bartlett, 9-J Pace, 14-B Hill, 30-J Rogers, 32-P Henare 27 284-J Kenny, 5-E Bartlett, 12-C Daniel, 30-J Terrell, 44-D Langrell 19 275-E Bartlett, 11-N Connell, 12-C Daniel, 14-B Hill, 44-D Langrell 11 25Lineup Sorted by Points per Possession AllowedPts/DefPlayers Poss Poss5-E Bartlett, 11-N Connell, 12-C Daniel, 14-B Hill, 44-D Langrell 0.44 254-J Kenny, 5-E Bartlett, 12-C Daniel, 30-J Terrell, 44-D Langrell 0.70 275-E Bartlett, 9-J Pace, 12-C Daniel, 30-J Rogers, 44-D Langrell 0.73 <strong>15</strong>34-J Kenny, 5-E Bartlett, 6-M Pearce, 11-N Connell, 14-B Hill 0.73 375-E Bartlett, 11-N Connell, 12-C Daniel, 30-J Terrell, 44-D Langrell 0.75 <strong>15</strong>05-E Bartlett, 11-N Connell, 12-C Daniel, 14-B Hill, 30-J Terrell 0.77 1035-E Bartlett, 6-M Pearce, 9-J Pace, 12-C Daniel, 44-D Langrell 0.86 359-J Pace, 5-E Bartlett, 12-C Daniel, 30-J Terrell, 44-D Langrell 0.90 10<strong>15</strong>-E Bartlett, 9-J Pace, 14-B Hill, 30-J Rogers, 32-P Henare 0.96 289-J Pace, 4-J Kenny, 6-M Pearce, 11-N Connell, 14-B Hill 0.98 44Lineup Sorted by Defensive Efficiency (Stops)Def Def DefPlayers Eff Stops Poss5-E Bartlett, 11-N Connell, 12-C Daniel, 14-B Hill, 44-D Langrell 0.60 <strong>15</strong> 255-E Bartlett, 11-N Connell, 12-C Daniel, 30-J Terrell, 44-D Langrell 0.49 74 <strong>15</strong>04-J Kenny, 5-E Bartlett, 12-C Daniel, 30-J Terrell, 44-D Langrell 0.48 13 275-E Bartlett, 11-N Connell, 12-C Daniel, 14-B Hill, 30-J Terrell 0.46 47 1034-J Kenny, 5-E Bartlett, 6-M Pearce, 11-N Connell, 14-B Hill 0.43 16 375-E Bartlett, 9-J Pace, 14-B Hill, 30-J Rogers, 32-P Henare 0.39 11 289-J Pace, 5-E Bartlett, 12-C Daniel, 30-J Terrell, 44-D Langrell 0.38 38 10<strong>15</strong>-E Bartlett, 9-J Pace, 12-C Daniel, 30-J Rogers, 44-D Langrell 0.36 55 <strong>15</strong>39-J Pace, 4-J Kenny, 6-M Pearce, 11-N Connell, 14-B Hill 0.34 <strong>15</strong> 445-E Bartlett, 6-M Pearce, 9-J Pace, 12-C Daniel, 44-D Langrell 0.31 11 35Lineup Sorted by Percentage of Ball Handling Errors Forced% BH Oppo DefPlayers Err TO Poss5-E Bartlett, 11-N Connell, 12-C Daniel, 14-B Hill, 44-D Langrell 0.20 5 255-E Bartlett, 11-N Connell, 12-C Daniel, 30-J Terrell, 44-D Langrell 0.17 26 <strong>15</strong>09-J Pace, 5-E Bartlett, 12-C Daniel, 30-J Terrell, 44-D Langrell 0.17 17 1014-J Kenny, 5-E Bartlett, 6-M Pearce, 11-N Connell, 14-B Hill 0.14 5 374-J Kenny, 5-E Bartlett, 12-C Daniel, 30-J Terrell, 44-D Langrell 0.11 3 275-E Bartlett, 9-J Pace, 14-B Hill, 30-J Rogers, 32-P Henare 0.11 3 285-E Bartlett, 9-J Pace, 12-C Daniel, 30-J Rogers, 44-D Langrell 0.10 <strong>15</strong> <strong>15</strong>35-E Bartlett, 11-N Connell, 12-C Daniel, 14-B Hill, 30-J Terrell 0.09 9 1039-J Pace, 4-J Kenny, 6-M Pearce, 11-N Connell, 14-B Hill 0.09 4 445-E Bartlett, 6-M Pearce, 9-J Pace, 12-C Daniel, 44-D Langrell 0.06 2 35
0800 Easy LPG Bay Hawks Basketball - Season Statistical RankingField Goals Made Att FG% 3 Point Goals Made Att 3FG% Free Throws Made Att FT%HENARE, Paul 9 <strong>15</strong> 60.0 PEARCE, Miles 1 1 100 DANIEL, Chris 47 61 77.0PEARCE, Miles 31 53 58.5 LANGRELL, David 23 49 46.9 BARTLETT, Everard 32 45 71.1PACE, Josh 90 164 54.9 DANIEL, Chris 40 86 46.5 LANGRELL, David 17 24 70.8DANIEL, Chris 74 136 54.4 HILL, Ben 43 94 45.7 TERRELL, Jamil 27 40 67.5ROGERS, Jon 43 82 52.4 CONNELL, Nat 14 35 40.0 PACE, Josh 34 51 66.7GOLDEN, George 20 40 50.0 BARTLETT, Everard 28 78 35.9 ROGERS, Jon 22 34 64.7BARTLETT, Everard 88 187 47.1 GOLDEN, George 3 14 21.4 HILL, Ben 7 11 63.6HILL, Ben 58 128 45.3 PACE, Josh 4 20 20.0 CONNELL, Nat 25 41 61.0CONNELL, Nat 54 120 45.0 KENNY, Jarrod 3 16 18.8 KENNY, Jarrod 6 10 60.0KENNY, Jarrod 23 52 44.2 TERRELL, Jamil 1 9 11.1 HENARE, Paul 4 7 57.1TERRELL, Jamil 32 83 38.6 PEARCE, Miles 10 19 52.6LANGRELL, David 36 95 37.9 GOLDEN, George 2 5 40.0Off Rebounds Num G Avg Def Rebounds Num G Avg Total Rebounds Num G AvgPACE, Josh 23 11 2.09 TERRELL, Jamil 68 9 7.56 TERRELL, Jamil 89 9 9.89BARTLETT, Everard 21 17 1.24 LANGRELL, David 63 17 3.71 LANGRELL, David 81 17 4.76TERRELL, Jamil 21 9 2.33 HILL, Ben 62 17 3.65 DANIEL, Chris 76 17 4.47DANIEL, Chris 20 17 1.18 DANIEL, Chris 56 17 3.29 HILL, Ben 76 17 4.47KENNY, Jarrod 18 13 1.38 CONNELL, Nat 40 17 2.35 BARTLETT, Everard 56 17 3.29LANGRELL, David 18 17 1.06 ROGERS, Jon 40 8 5.00 ROGERS, Jon 55 8 6.88PEARCE, Miles 17 17 1.00 BARTLETT, Everard 35 17 2.06 CONNELL, Nat 53 17 3.12ROGERS, Jon <strong>15</strong> 8 1.88 PACE, Josh 26 11 2.36 PACE, Josh 49 11 4.45HILL, Ben 14 17 0.82 PEARCE, Miles 22 17 1.29 PEARCE, Miles 39 17 2.29CONNELL, Nat 13 17 0.76 KENNY, Jarrod 13 13 1.00 KENNY, Jarrod 31 13 2.38HENARE, Paul 2 5 0.40 HENARE, Paul 5 5 1.00 HENARE, Paul 7 5 1.40GOLDEN, George 2 5 0.40 GOLDEN, George 4 5 0.80 GOLDEN, George 6 5 1.20SIDDALL, Warrick 3 4 0.75 SIDDALL, Warrick 3 4 0.75TAHAU, Haylan 1 6 0.17 TAHAU, Haylan 1 6 0.17Assists Num G Avg Steals Num G Avg Scoring Num G AvgPACE, Josh 43 11 3.91 BARTLETT, Everard 26 17 1.53 BARTLETT, Everard 236 17 13.9BARTLETT, Everard 41 17 2.41 CONNELL, Nat 17 17 1.00 DANIEL, Chris 235 17 13.8CONNELL, Nat 31 17 1.82 DANIEL, Chris 13 17 0.76 PACE, Josh 218 11 19.8DANIEL, Chris 24 17 1.41 PACE, Josh 11 11 1.00 HILL, Ben 166 17 9.76KENNY, Jarrod 22 13 1.69 LANGRELL, David 10 17 0.59 CONNELL, Nat 147 17 8.65HILL, Ben 20 17 1.18 HILL, Ben 7 17 0.41 LANGRELL, David 112 17 6.59HENARE, Paul 16 5 3.20 TERRELL, Jamil 6 9 0.67 ROGERS, Jon 108 8 13.5LANGRELL, David 16 17 0.94 ROGERS, Jon 4 8 0.50 TERRELL, Jamil 92 9 10.2TERRELL, Jamil 10 9 1.11 HENARE, Paul 4 5 0.80 PEARCE, Miles 73 17 4.29PEARCE, Miles 6 17 0.35 GOLDEN, George 4 5 0.80 KENNY, Jarrod 55 13 4.23ROGERS, Jon 4 8 0.50 KENNY, Jarrod 2 13 0.<strong>15</strong> GOLDEN, George 45 5 9.00GOLDEN, George 4 5 0.80 PEARCE, Miles 2 17 0.12 HENARE, Paul 22 5 4.40TAHAU, Haylan 3 6 0.50 TAHAU, Haylan 1 6 0.17Blocks Num G Avg Turn Overs Num G Avg Fouls Off Pers TotalROGERS, Jon 17 8 2.13 CONNELL, Nat 36 17 2.12 DANIEL, Chris 2 49 51TERRELL, Jamil 14 9 1.56 TERRELL, Jamil 29 9 3.22 HILL, Ben 3 43 46DANIEL, Chris 9 17 0.53 LANGRELL, David 28 17 1.65 TERRELL, Jamil 4 29 33CONNELL, Nat 5 17 0.29 BARTLETT, Everard 26 17 1.53 CONNELL, Nat 3 30 33BARTLETT, Everard 4 17 0.24 DANIEL, Chris 26 17 1.53 PACE, Josh 0 24 24PEARCE, Miles 3 17 0.18 PACE, Josh 17 11 1.55 BARTLETT, Everard 5 18 23PACE, Josh 2 11 0.18 HILL, Ben 17 17 1.00 ROGERS, Jon 4 19 23KENNY, Jarrod 1 13 0.08 KENNY, Jarrod 16 13 1.23 PEARCE, Miles 3 20 23SIDDALL, Warrick 1 4 0.25 ROGERS, Jon <strong>15</strong> 8 1.88 LANGRELL, David 0 20 20LANGRELL, David 1 17 0.06 PEARCE, Miles 12 17 0.71 KENNY, Jarrod 0 12 12HENARE, Paul 6 5 1.20 GOLDEN, George 0 9 9GOLDEN, George 2 5 0.40 HENARE, Paul 0 7 7SIDDALL, Warrick 1 4 0.25 SIDDALL, Warrick 1 0 1TAHAU, Haylan 0 1 1Charges Taken Num G Avg Productivity Value G Avg Def Assist Num G AvgDANIEL, Chris 5 17 0.29 DANIEL, Chris 219 17 12.9LANGRELL, David 3 17 0.18 BARTLETT, Everard 213 17 12.5CONNELL, Nat 2 17 0.12 PACE, Josh 203 11 18.4TERRELL, Jamil 2 9 0.22 HILL, Ben 138 17 8.12KENNY, Jarrod 1 13 0.08 LANGRELL, David 118 17 6.94PEARCE, Miles 1 17 0.06 CONNELL, Nat 109 17 6.38HILL, Ben 1 17 0.06 ROGERS, Jon 107 8 13.3TERRELL, Jamil 97.5 9 10.8PEARCE, Miles 66.5 17 3.91KENNY, Jarrod 60.0 13 4.62HENARE, Paul 28.0 5 5.60
Harbour Heat Basketball - Season Box ScoreRecord Overall Home Away NeutralAll Games 10-7 5-3 5-4 0-0Conference 10-7 5-3 5-4 0-0Non-Conference 0-0 0-0 0-0 0-0Playoff 0-0 0-0 0-0 0-0Name G/GS FG FG% 3Pt 3Pt% FT FT% PTS Avg P/S ORB DRB TR Avg PF AST TO BS ST DA MINHouston O'Riley 14/0 16/42 38.1 4/18 22.2 16/22 72.7 52 3.71 0.98 4 10 14 1.00 20 11 8 1 6 0 174Rick Rickert 17/17 121/218 55.5 2/12 16.7 57/78 73.1 301 17.7 1.17 65 94 <strong>15</strong>9 9.35 40 23 37 19 10 0 536Kavossy Franklin 16/16 94/192 49.0 21/50 42.0 51/64 79.7 260 16.3 1.16 7 56 63 3.94 32 35 34 2 20 0 543Corey Webster 17/17 141/336 42.0 44/126 34.9 62/78 79.5 388 22.8 1.03 12 49 61 3.59 41 41 42 5 49 0 599Karl Noyer 4/0 1/4 25.0 0/3 0.00 0/0 0.00 2 0.50 0.50 0 1 1 0.25 2 1 1 0 0 0 9:44Brad Anderson 8/1 6/17 35.3 5/14 35.7 0/0 0.00 17 2.13 1.00 2 3 5 0.63 6 3 3 0 4 0 53:22Sam King 7/0 4/12 33.3 1/4 25.0 3/6 50.0 12 1.71 0.80 1 3 4 0.57 7 2 0 1 1 0 35:38Morgan Nathan 10/0 4/10 40.0 0/0 0.00 1/1 100 9 0.90 0.90 4 4 8 0.80 8 0 5 1 1 0 47:53Beny Anthony 17/17 98/194 50.5 3/8 37.5 48/71 67.6 247 14.5 1.08 35 45 80 4.71 60 16 31 6 13 0 390Dan Ryan 1/0 1/2 50.0 0/1 0.00 0/0 0.00 2 2.00 1.00 1 0 1 1.00 0 1 1 0 0 0 2:14Dillon Boucher 13/13 35/63 55.6 0/2 0.00 12/27 44.4 82 6.31 1.08 48 69 117 9.00 45 67 50 8 28 0 401Reece Cassidy 17/4 42/85 49.4 10/27 37.0 18/26 69.2 112 6.59 1.14 25 31 56 3.29 25 14 25 1 14 0 298Daryl Carwright 17/0 34/75 45.3 2/17 11.8 13/22 59.1 83 4.88 0.97 31 51 82 4.82 46 13 27 11 10 0 357<strong>Team</strong> 52 49 101 7 22Totals 17 597/1250 47.8 92/282 32.6 281/395 71.1 <strong>15</strong>67 92.2 1.08 287 465 752 44.2 332 227 271 55 178 0G/GS FG FG% 3Pt 3Pt% FT FT% PTS Avg P/S ORB DRB TR Avg PF AST TO BS ST DAOpponents 17 557/1171 47.6 <strong>15</strong>9/383 41.5 246/356 69.1 <strong>15</strong>19 89.4 1.13 204 421 625 36.8 316 272 275 68 148 0SHOOTING Harbour Heat OpponentsField Goal% 47.8 47.62Pt Goal% 52.2 50.53Pt Goal% 32.6 41.5Free Throw % 71.1 69.1BALL HANDLINGAssists 227 (13.4) 272 (16.0)Turnovers 271 (<strong>15</strong>.9) 275 (16.2)Steals 178 (10.5) 148 (8.7)Def. Assists 0 (0.0) 0 (0.0)BH Error% 19.0 19.3OTHEROff. Possessions 1424 (83.8) 1426 (83.9)Pts per Possession 1.10 1.07Def. Efficiency 51.9% 48.6%REBOUNDING Harbour Heat OpponentsTotal Rebound % 54.6 45.4Off. Rebound % 40.5 30.5Def. Rebound % 69.5 59.5Total Rebounds 752 (44.2) 625 (36.8)Off. Rebounds 287 (16.9) 204 (12.0)Def. Rebounds 465 (27.4) 421 (24.8)<strong>Team</strong> Rebounds 101 (5.9) 97 (5.7)SCORINGTotal Points <strong>15</strong>67 (92.2) <strong>15</strong>19 (89.4)Pts off Turnovers 338 (19.9) 313 (18.4)2nd Effort Pts 233 (13.7) 169 (9.9)Pts off Bench 250 (14.7) 294 (17.3)3Pt Points 276 (16.2) 477 (28.1)Free Throw Pts 281 (16.5) 246 (14.5)Charges Taken 6 16
Harbour Heat Basketball - Season SummaryRecordDate OverallConf SiteScore Opponent High Point High Rebounder06/03/<strong>2010</strong> 1- 0 1- 0 H W 99-82 Oceanagold Otago Nuggets34-C Webster 13-D Boucher14/03/<strong>2010</strong> 2- 0 2- 0 H W 96-82 Zerofees Southland Sharks 24-R Rickert 11-R Rickert, D Bo19/03/<strong>2010</strong> 3- 0 3- 0 H W 1<strong>15</strong>-95 Wellington Saints 25-C Webster 22-R Rickert26/03/<strong>2010</strong> 4- 0 4- 0 H W 105-73 McDonalds Manawatu Jets 28-C Webster 10-R Rickert, D Bo01/04/<strong>2010</strong> 5- 0 5- 0 H W 83-79 Fico Finance Nelson Giants 16-C Webster, B Anthony9-R Rickert16/04/<strong>2010</strong> 6- 0 6- 0 A W 94-82 0800 Easy LPG Bay Hawks 24-C Webster 10-R Rickert17/04/<strong>2010</strong> 7- 0 7- 0 A W 123-120 2OTMcDonalds Manawatu Jets 34-C Webster 13-D Boucher22/04/<strong>2010</strong> 7- 1 7- 1 A L 67-95 Waikato Pistons 25-C Webster 8-R Rickert24/04/<strong>2010</strong> 8- 1 8- 1 A W 92-83 Taranaki Mountainairs 20-R Rickert, C Webster 11-D Boucher29/04/<strong>2010</strong> 8- 2 8- 2 A L 90-126 Exodus Wellington Saints 23-R Rickert 9-D Boucher30/04/<strong>2010</strong> 8- 3 8- 3 A L 82-91 Chrischurch Cougars 22-C Webster 10-R Rickert08/06/<strong>2010</strong> 8- 4 8- 4 H L 71-78 Waikato Pistons <strong>15</strong>-C Webster, B Anthony11-D Boucher21/05/<strong>2010</strong> 8- 5 8- 5 H L 97-102 0800 Easy LPG Bay Hawks 40-C Webster 9-R Rickert05/26/<strong>2010</strong> 8- 6 8- 6 A L 79-88 Zerofees Southland Sharks 17-C Webster 11-D Boucher27/05/<strong>2010</strong> 9- 6 9- 6 A W 106-84 Oceanagold Nuggets 25-B Anthony 11-R Rickert03/06/<strong>2010</strong> 9- 7 9- 7 H L 76-87 Chrischurch Cougars 18-R Rickert 8-C Webster, D C11/06/<strong>2010</strong>10- 7 10- 7A W 92-72 Fico Finance Nelson Giants 19-R Rickert, C Webster <strong>15</strong>-R Rickert<strong>Team</strong> Statistics SummaryOpponent FG 3 Pt FT PTS ORB DRB TR PF AST TO BS ST DAOceanagold Otago Nuggets 37/79 8/27 17/21 99 13 32 45 28 23 16 2 20 0Zerofees Southland Sharks 37/76 9/21 13/23 96 24 21 45 19 14 22 3 27 0Wellington Saints 47/83 6/17 <strong>15</strong>/18 1<strong>15</strong> 16 32 48 18 16 12 2 12 0McDonalds Manawatu Jets 45/83 6/16 9/17 105 25 38 63 19 23 21 6 <strong>15</strong> 0Fico Finance Nelson Giants 32/68 2/12 17/23 83 12 29 41 18 17 13 3 8 00800 Easy LPG Bay Hawks 36/62 5/11 17/24 94 16 23 39 14 12 14 3 10 0McDonalds Manawatu Jets 44/82 6/19 29/40 123 19 34 53 25 7 24 3 7 0Waikato Pistons 23/74 5/14 16/18 67 12 24 36 12 7 11 3 6 0Taranaki Mountainairs 35/65 1/8 21/31 92 14 29 43 18 14 18 5 <strong>15</strong> 0Exodus Wellington Saints 33/65 5/13 19/26 90 13 20 33 14 17 <strong>15</strong> 1 6 0Chrischurch Cougars 30/72 5/20 17/18 82 17 26 43 21 9 19 5 5 0Waikato Pistons 30/71 2/12 9/16 71 16 28 44 23 13 18 2 10 00800 Easy LPG Bay Hawks 35/79 10/23 17/23 97 19 18 37 27 16 11 4 6 0Zerofees Southland Sharks 29/72 7/23 14/19 79 18 19 37 21 6 19 3 8 0Oceanagold Nuggets 41/77 6/13 18/28 106 <strong>15</strong> 36 51 14 16 11 3 8 0Chrischurch Cougars 27/71 3/20 19/28 76 <strong>15</strong> 26 41 24 5 17 2 9 0Fico Finance Nelson Giants 36/71 6/13 14/22 92 23 30 53 20 12 10 5 6 0Individual Season Highs<strong>Team</strong> Season HighsMost Pts: 40 C Webster vs. 0800 Easy LPG Bay Hawks Most Pts: 123 vs. McDonalds Manawatu JetsMost Fgm: 13 C Webster vs. McDonalds Manawatu Jets Most Fgm: 47 vs. Wellington SaintsMost Fga: 26 C Webster vs. Multiple Oppo.Most Fga: 83 vs. Wellington SaintsMost 3pm: 7 C Webster vs. 0800 Easy LPG Bay Hawks Most 3pm: 10 vs. 0800 Easy LPG Bay HawksMost 3pa: 13 C Webster vs. 0800 Easy LPG Bay Hawks Most 3pa: 27 vs. Oceanagold Otago NuggetsMost Ftm: 9 Multiple PlayersMost Ftm: 29 vs. McDonalds Manawatu JetsMost Fta: 12 C Webster vs. 0800 Easy LPG Bay Hawks Most Fta: 40 vs. McDonalds Manawatu JetsMost Reb: 22 R Rickert vs. Wellington SaintsMost Reb: 63 vs. McDonalds Manawatu JetsMost Orb: 8 R Rickert vs. Zerofees Southland Sharks Most Orb: 25 vs. McDonalds Manawatu JetsMost Drb: 16 R Rickert vs. Wellington SaintsMost Drb: 38 vs. McDonalds Manawatu JetsMost Ast: 9 D Boucher vs. McDonalds Manawatu Jets Most Ast: 23 vs. Oceanagold Otago NuggetsMost Stl: 10 C Webster vs. Zerofees Southland Sharks Most Stl: 27 vs. Zerofees Southland SharksMost Blk: 3 R Rickert vs. McDonalds Manawatu Jets Most Blk: 6 vs. McDonalds Manawatu Jets
CyberSports for Basketball - Offensive Lineup Combination AnalysisHarbour HeatMost Often Used Lineup: 7-R Rickert, 8-K Franklin, 9-C Webster, 20-B Anthony, 24-D BoucherMost Productive Offensive Lineup: 7-R Rickert, 8-K Franklin, 9-C Webster, 20-B Anthony, 24-D BoucherMost Productive Rebounding Lineup: 8-K Franklin, 9-C Webster, 20-B Anthony, 24-D Boucher, 33-D CarwrightBest Defensive Combination: 8-K Franklin, 9-C Webster, 20-B Anthony, 25-R Cassidy, 33-D CarwrightBest Lineup to Force Turnovers: 7-R Rickert, 8-K Franklin, 9-C Webster, <strong>15</strong>-M Nathan, 33-D CarwrightBest Overall Lineup:7-R Rickert, 8-K Franklin, 9-C Webster, 20-B Anthony, 24-D BoucherBest Free Throw Shooting Lineup: 5-H O'Riley, 7-R Rickert, 8-K Franklin, 9-C Webster, <strong>15</strong>-M NathanLineups Sorted by Playing TimePlayers Time Pts7-R Rickert, 8-K Franklin, 9-C Webster, 20-B Anthony, 24-D Boucher <strong>15</strong>3.75 +397-R Rickert, 8-K Franklin, 9-C Webster, 24-D Boucher, 33-D Carwright 73.63 -337-R Rickert, 8-K Franklin, 9-C Webster, 20-B Anthony, 25-R Cassidy 53.80 +127-R Rickert, 8-K Franklin, 9-C Webster, 25-R Cassidy, 33-D Carwright 46.38 +105-H O'Riley, 7-R Rickert, 9-C Webster, 25-R Cassidy, 33-D Carwright 25.17 -95-H O'Riley, 7-R Rickert, 9-C Webster, 24-D Boucher, 33-D Carwright 18.68 -28-K Franklin, 9-C Webster, 20-B Anthony, 24-D Boucher, 33-D Carwright 17.62 +177-R Rickert, 9-C Webster, 12-B Anderson, 20-B Anthony, 24-D Boucher 13.85 +47-R Rickert, 8-K Franklin, 9-C Webster, <strong>15</strong>-M Nathan, 33-D Carwright 12.55 +108-K Franklin, 9-C Webster, 20-B Anthony, 25-R Cassidy, 33-D Carwright 12.38 +10Lineups Sorted by Points per MinutePlayers PPM Norm Pts Time8-K Franklin, 9-C Webster, 20-B Anthony, 24-D Boucher, 33-D Carwright +0.96 +38.60 +17 17.628-K Franklin, 9-C Webster, 20-B Anthony, 25-R Cassidy, 33-D Carwright +0.81 +32.30 +10 12.387-R Rickert, 8-K Franklin, 9-C Webster, <strong>15</strong>-M Nathan, 33-D Carwright +0.80 +31.87 +10 12.557-R Rickert, 9-C Webster, 12-B Anderson, 20-B Anthony, 24-D Boucher +0.29 +11.55 +4 13.857-R Rickert, 8-K Franklin, 9-C Webster, 20-B Anthony, 24-D Boucher +0.25 +10.<strong>15</strong> +39 <strong>15</strong>3.757-R Rickert, 8-K Franklin, 9-C Webster, 20-B Anthony, 25-R Cassidy +0.22 +8.92 +12 53.807-R Rickert, 8-K Franklin, 9-C Webster, 25-R Cassidy, 33-D Carwright +0.22 +8.62 +10 46.385-H O'Riley, 7-R Rickert, 9-C Webster, 24-D Boucher, 33-D Carwright -0.11 -4.28 -2 18.685-H O'Riley, 7-R Rickert, 9-C Webster, 25-R Cassidy, 33-D Carwright -0.36 -14.30 -9 25.177-R Rickert, 8-K Franklin, 9-C Webster, 24-D Boucher, 33-D Carwright -0.45 -17.93 -33 73.63Lineups Sorted by Rebounds per MinutePlayers RPM Norm Reb Time8-K Franklin, 9-C Webster, 20-B Anthony, 24-D Boucher, 33-D Carwright +0.85 +34.06 +<strong>15</strong> 17.625-H O'Riley, 7-R Rickert, 9-C Webster, 24-D Boucher, 33-D Carwright +0.48 +19.27 +9 18.687-R Rickert, 8-K Franklin, 9-C Webster, 20-B Anthony, 24-D Boucher +0.18 +7.02 +27 <strong>15</strong>3.757-R Rickert, 8-K Franklin, 9-C Webster, 24-D Boucher, 33-D Carwright +0.18 +7.06 +13 73.637-R Rickert, 8-K Franklin, 9-C Webster, 25-R Cassidy, 33-D Carwright +0.<strong>15</strong> +6.04 +7 46.388-K Franklin, 9-C Webster, 20-B Anthony, 25-R Cassidy, 33-D Carwright +0.08 +3.23 +1 12.387-R Rickert, 9-C Webster, 12-B Anderson, 20-B Anthony, 24-D Boucher +0.07 +2.89 +1 13.857-R Rickert, 8-K Franklin, 9-C Webster, <strong>15</strong>-M Nathan, 33-D Carwright +0.00 +0.00 +0 12.555-H O'Riley, 7-R Rickert, 9-C Webster, 25-R Cassidy, 33-D Carwright +0.00 +0.00 +0 25.177-R Rickert, 8-K Franklin, 9-C Webster, 20-B Anthony, 25-R Cassidy -0.13 -5.20 -7 53.80Total time captured in lineups: 427.82Productive scoring minutes: 310.33Productive rebounding minutes: 336.30Productive scoring percentage: 72.54%Productive rebounding percentage: 78.61%
CyberSports for Basketball - Defensive Lineup Combination AnalysisHarbour HeatLineup Sorted by Defensive PossessionsOppoDefPlayers Pts Poss7-R Rickert, 8-K Franklin, 9-C Webster, 20-B Anthony, 24-D Boucher 333 3917-R Rickert, 8-K Franklin, 9-C Webster, 24-D Boucher, 33-D Carwright 163 1717-R Rickert, 8-K Franklin, 9-C Webster, 20-B Anthony, 25-R Cassidy 116 1407-R Rickert, 8-K Franklin, 9-C Webster, 25-R Cassidy, 33-D Carwright 104 1305-H O'Riley, 7-R Rickert, 9-C Webster, 25-R Cassidy, 33-D Carwright 59 575-H O'Riley, 7-R Rickert, 9-C Webster, 24-D Boucher, 33-D Carwright 48 448-K Franklin, 9-C Webster, 20-B Anthony, 24-D Boucher, 33-D Carwright 22 377-R Rickert, 9-C Webster, 12-B Anderson, 20-B Anthony, 24-D Boucher 25 368-K Franklin, 9-C Webster, 20-B Anthony, 25-R Cassidy, 33-D Carwright 16 357-R Rickert, 8-K Franklin, 9-C Webster, <strong>15</strong>-M Nathan, 33-D Carwright 21 32Lineup Sorted by Points per Possession AllowedPts/DefPlayers Poss Poss8-K Franklin, 9-C Webster, 20-B Anthony, 25-R Cassidy, 33-D Carwright 0.46 358-K Franklin, 9-C Webster, 20-B Anthony, 24-D Boucher, 33-D Carwright 0.59 377-R Rickert, 8-K Franklin, 9-C Webster, <strong>15</strong>-M Nathan, 33-D Carwright 0.66 327-R Rickert, 9-C Webster, 12-B Anderson, 20-B Anthony, 24-D Boucher 0.69 367-R Rickert, 8-K Franklin, 9-C Webster, 25-R Cassidy, 33-D Carwright 0.80 1307-R Rickert, 8-K Franklin, 9-C Webster, 20-B Anthony, 25-R Cassidy 0.83 1407-R Rickert, 8-K Franklin, 9-C Webster, 20-B Anthony, 24-D Boucher 0.85 3917-R Rickert, 8-K Franklin, 9-C Webster, 24-D Boucher, 33-D Carwright 0.95 17<strong>15</strong>-H O'Riley, 7-R Rickert, 9-C Webster, 25-R Cassidy, 33-D Carwright 1.04 575-H O'Riley, 7-R Rickert, 9-C Webster, 24-D Boucher, 33-D Carwright 1.09 44Lineup Sorted by Defensive Efficiency (Stops)Def Def DefPlayers Eff Stops Poss7-R Rickert, 8-K Franklin, 9-C Webster, <strong>15</strong>-M Nathan, 33-D Carwright 0.59 19 328-K Franklin, 9-C Webster, 20-B Anthony, 24-D Boucher, 33-D Carwright 0.54 20 377-R Rickert, 9-C Webster, 12-B Anderson, 20-B Anthony, 24-D Boucher 0.44 16 368-K Franklin, 9-C Webster, 20-B Anthony, 25-R Cassidy, 33-D Carwright 0.43 <strong>15</strong> 357-R Rickert, 8-K Franklin, 9-C Webster, 25-R Cassidy, 33-D Carwright 0.42 55 1305-H O'Riley, 7-R Rickert, 9-C Webster, 25-R Cassidy, 33-D Carwright 0.42 24 577-R Rickert, 8-K Franklin, 9-C Webster, 20-B Anthony, 24-D Boucher 0.41 162 39<strong>15</strong>-H O'Riley, 7-R Rickert, 9-C Webster, 24-D Boucher, 33-D Carwright 0.41 18 447-R Rickert, 8-K Franklin, 9-C Webster, 20-B Anthony, 25-R Cassidy 0.38 53 1407-R Rickert, 8-K Franklin, 9-C Webster, 24-D Boucher, 33-D Carwright 0.38 65 171Lineup Sorted by Percentage of Ball Handling Errors Forced% BH Oppo DefPlayers Err TO Poss7-R Rickert, 8-K Franklin, 9-C Webster, <strong>15</strong>-M Nathan, 33-D Carwright 0.31 10 325-H O'Riley, 7-R Rickert, 9-C Webster, 24-D Boucher, 33-D Carwright 0.23 10 447-R Rickert, 8-K Franklin, 9-C Webster, 20-B Anthony, 24-D Boucher 0.20 77 3918-K Franklin, 9-C Webster, 20-B Anthony, 24-D Boucher, 33-D Carwright 0.19 7 378-K Franklin, 9-C Webster, 20-B Anthony, 25-R Cassidy, 33-D Carwright 0.17 6 357-R Rickert, 8-K Franklin, 9-C Webster, 25-R Cassidy, 33-D Carwright 0.<strong>15</strong> 20 1307-R Rickert, 8-K Franklin, 9-C Webster, 20-B Anthony, 25-R Cassidy 0.<strong>15</strong> 21 1407-R Rickert, 9-C Webster, 12-B Anderson, 20-B Anthony, 24-D Boucher 0.14 5 367-R Rickert, 8-K Franklin, 9-C Webster, 24-D Boucher, 33-D Carwright 0.14 24 17<strong>15</strong>-H O'Riley, 7-R Rickert, 9-C Webster, 25-R Cassidy, 33-D Carwright 0.07 4 57
Harbour Heat Basketball - Season Statistical RankingField Goals Made Att FG% 3 Point Goals Made Att 3FG% Free Throws Made Att FT%RICKERT, Rick 121 218 55.5 FRANKLIN, Kavossy 21 50 42.0 NATHAN, Morgan 1 1 100BOUCHER, Dillon 35 63 55.6 ANTHONY, Beny 3 8 37.5 FRANKLIN, Kavossy 51 64 79.7ANTHONY, Beny 98 194 50.5 CASSIDY, Reece 10 27 37.0 WEBSTER, Corey 62 78 79.5RYAN, Dan 1 2 50.0 ANDERSON, Brad 5 14 35.7 RICKERT, Rick 57 78 73.1CASSIDY, Reece 42 85 49.4 WEBSTER, Corey 44 126 34.9 O'RILEY, Houston 16 22 72.7FRANKLIN, Kavossy 94 192 49.0 KING, Sam 1 4 25.0 CASSIDY, Reece 18 26 69.2CARWRIGHT, Daryl 34 75 45.3 O'RILEY, Houston 4 18 22.2 ANTHONY, Beny 48 71 67.6WEBSTER, Corey 141 336 42.0 RICKERT, Rick 2 12 16.7 CARWRIGHT, Daryl 13 22 59.1NATHAN, Morgan 4 10 40.0 CARWRIGHT, Daryl 2 17 11.8 KING, Sam 3 6 50.0O'RILEY, Houston 16 42 38.1 BOUCHER, Dillon 12 27 44.4ANDERSON, Brad 6 17 35.3KING, Sam 4 12 33.3NOYER, Karl 1 4 25.0Off Rebounds Num G Avg Def Rebounds Num G Avg Total Rebounds Num G AvgRICKERT, Rick 65 17 3.82 RICKERT, Rick 94 17 5.53 RICKERT, Rick <strong>15</strong>9 17 9.35BOUCHER, Dillon 48 13 3.69 BOUCHER, Dillon 69 13 5.31 BOUCHER, Dillon 117 13 9.00ANTHONY, Beny 35 17 2.06 FRANKLIN, Kavossy 56 16 3.50 CARWRIGHT, Daryl 82 17 4.82CARWRIGHT, Daryl 31 17 1.82 CARWRIGHT, Daryl 51 17 3.00 ANTHONY, Beny 80 17 4.71CASSIDY, Reece 25 17 1.47 WEBSTER, Corey 49 17 2.88 FRANKLIN, Kavossy 63 16 3.94WEBSTER, Corey 12 17 0.71 ANTHONY, Beny 45 17 2.65 WEBSTER, Corey 61 17 3.59FRANKLIN, Kavossy 7 16 0.44 CASSIDY, Reece 31 17 1.82 CASSIDY, Reece 56 17 3.29O'RILEY, Houston 4 14 0.29 O'RILEY, Houston 10 14 0.71 O'RILEY, Houston 14 14 1.00NATHAN, Morgan 4 10 0.40 NATHAN, Morgan 4 10 0.40 NATHAN, Morgan 8 10 0.80ANDERSON, Brad 2 8 0.25 ANDERSON, Brad 3 8 0.38 ANDERSON, Brad 5 8 0.63KING, Sam 1 7 0.14 KING, Sam 3 7 0.43 KING, Sam 4 7 0.57RYAN, Dan 1 1 1.00 NOYER, Karl 1 4 0.25 NOYER, Karl 1 4 0.25RYAN, Dan 1 1 1.00Assists Num G Avg Steals Num G Avg Scoring Num G AvgBOUCHER, Dillon 67 13 5.<strong>15</strong> WEBSTER, Corey 49 17 2.88 WEBSTER, Corey 388 17 22.8WEBSTER, Corey 41 17 2.41 BOUCHER, Dillon 28 13 2.<strong>15</strong> RICKERT, Rick 301 17 17.7FRANKLIN, Kavossy 35 16 2.19 FRANKLIN, Kavossy 20 16 1.25 FRANKLIN, Kavossy 260 16 16.3RICKERT, Rick 23 17 1.35 CASSIDY, Reece 14 17 0.82 ANTHONY, Beny 247 17 14.5ANTHONY, Beny 16 17 0.94 ANTHONY, Beny 13 17 0.76 CASSIDY, Reece 112 17 6.59CASSIDY, Reece 14 17 0.82 RICKERT, Rick 10 17 0.59 CARWRIGHT, Daryl 83 17 4.88CARWRIGHT, Daryl 13 17 0.76 CARWRIGHT, Daryl 10 17 0.59 BOUCHER, Dillon 82 13 6.31O'RILEY, Houston 11 14 0.79 O'RILEY, Houston 6 14 0.43 O'RILEY, Houston 52 14 3.71ANDERSON, Brad 3 8 0.38 ANDERSON, Brad 4 8 0.50 ANDERSON, Brad 17 8 2.13KING, Sam 2 7 0.29 KING, Sam 1 7 0.14 KING, Sam 12 7 1.71NOYER, Karl 1 4 0.25 NATHAN, Morgan 1 10 0.10 NATHAN, Morgan 9 10 0.90RYAN, Dan 1 1 1.00 NOYER, Karl 2 4 0.50RYAN, Dan 2 1 2.00Blocks Num G Avg Turn Overs Num G Avg Fouls Off Pers TotalRICKERT, Rick 19 17 1.12 BOUCHER, Dillon 50 13 3.85 ANTHONY, Beny 3 57 60CARWRIGHT, Daryl 11 17 0.65 WEBSTER, Corey 42 17 2.47 CARWRIGHT, Daryl 4 42 46BOUCHER, Dillon 8 13 0.62 RICKERT, Rick 37 17 2.18 BOUCHER, Dillon 2 43 45ANTHONY, Beny 6 17 0.35 FRANKLIN, Kavossy 34 16 2.13 WEBSTER, Corey 5 36 41WEBSTER, Corey 5 17 0.29 ANTHONY, Beny 31 17 1.82 RICKERT, Rick 7 33 40FRANKLIN, Kavossy 2 16 0.13 CARWRIGHT, Daryl 27 17 1.59 FRANKLIN, Kavossy 1 31 32O'RILEY, Houston 1 14 0.07 CASSIDY, Reece 25 17 1.47 CASSIDY, Reece 0 25 25KING, Sam 1 7 0.14 O'RILEY, Houston 8 14 0.57 O'RILEY, Houston 0 20 20NATHAN, Morgan 1 10 0.10 NATHAN, Morgan 5 10 0.50 NATHAN, Morgan 0 8 8CASSIDY, Reece 1 17 0.06 ANDERSON, Brad 3 8 0.38 KING, Sam 0 7 7NOYER, Karl 1 4 0.25 ANDERSON, Brad 0 6 6RYAN, Dan 1 1 1.00 NOYER, Karl 0 2 2Charges Taken Num G Avg Productivity Value G Avg Def Assist Num G AvgRICKERT, Rick 2 17 0.12 RICKERT, Rick 350 17 20.6BOUCHER, Dillon 2 13 0.<strong>15</strong> WEBSTER, Corey 256 17 <strong>15</strong>.1O'RILEY, Houston 1 14 0.07 FRANKLIN, Kavossy 208 16 13.0FRANKLIN, Kavossy 1 16 0.06 BOUCHER, Dillon 190 13 14.6ANTHONY, Beny 170 17 9.97CASSIDY, Reece 109 17 6.38CARWRIGHT, Daryl 89.5 17 5.26O'RILEY, Houston 25.0 14 1.79ANDERSON, Brad 10.0 8 1.25KING, Sam 2.50 7 0.36RYAN, Dan 2.50 1 2.50NATHAN, Morgan 2.00 10 0.20
McDonalds Manawatu Jets Basketball - Season Box ScoreRecord Overall Home Away NeutralAll Games 4-12 2-6 2-6 0-0Conference 4-12 2-6 2-6 0-0Non-Conference 0-0 0-0 0-0 0-0Playoff 0-0 0-0 0-0 0-0Name G/GS FG FG% 3Pt 3Pt% FT FT% PTS Avg P/S ORB DRB TR Avg PF AST TO BS ST DA MINKaine Hokianga 16/8 46/113 40.7 <strong>15</strong>/45 33.3 11/16 68.8 118 7.38 0.98 5 22 27 1.69 48 11 21 2 7 0 347Logan Funnell 12/6 14/40 35.0 8/24 33.3 7/12 58.3 43 3.58 0.93 14 16 30 2.50 26 12 8 0 18 0 209Daniel Simon 1/0 0/0 0.00 0/0 0.00 0/0 0.00 0 0.00 0.00 0 0 0 0.00 0 1 0 0 0 0 2:05Paul Bristol 16/5 14/36 38.9 6/<strong>15</strong> 40.0 12/19 63.2 46 2.88 1.02 10 17 27 1.69 16 14 28 0 10 0 225Calum MacLeod 16/10 59/110 53.6 0/3 0.00 29/40 72.5 147 9.19 1.13 28 54 82 5.13 44 9 21 7 3 0 321Callum Brock 4/1 6/<strong>15</strong> 40.0 1/3 33.3 1/1 100 14 3.50 0.93 2 4 6 1.50 5 0 5 0 1 0 53:46Matt Te Huna 16/14 60/<strong>15</strong>0 40.0 25/72 34.7 24/41 58.5 169 10.6 0.99 11 39 50 3.13 32 32 34 1 32 0 495Piers Finch 14/2 5/36 13.9 3/17 17.6 4/6 66.7 17 1.21 0.44 9 14 23 1.64 19 5 9 0 4 0 141Richard Jeter 16/10 94/223 42.2 38/97 39.2 44/55 80.0 270 16.9 1.08 26 48 74 4.63 37 10 47 8 21 0 402Josh O'Connell 6/0 3/9 33.3 2/3 66.7 0/0 0.00 8 1.33 0.89 2 0 2 0.33 3 0 2 0 1 0 19:<strong>15</strong>Riki Dalzell 0/0 0/0 0.00 0/0 0.00 0/0 0.00 0 0.00 0.00 0 0 0 0.00 0 0 0 0 0 0 DNPRonald Allen 1/0 4/7 57.1 1/2 50.0 3/3 100 12 12.0 1.50 0 0 0 0.00 2 0 2 0 0 0 12:45Adrian Torrie 3/0 1/1 100 0/0 0.00 0/0 0.00 2 0.67 2.00 1 4 5 1.67 2 0 5 2 2 0 17:05Hugh Quinlivan 16/1 28/82 34.1 9/26 34.6 9/19 47.4 74 4.63 0.81 12 26 38 2.38 30 7 17 3 <strong>15</strong> 0 205Chris Reay 14/12 65/138 47.1 0/3 0.00 39/52 75.0 169 12.1 1.03 30 61 91 6.50 47 <strong>15</strong> 27 6 19 0 420Kos Yahata 1/0 2/5 40.0 1/3 33.3 0/0 0.00 5 5.00 1.00 0 0 0 0.00 1 0 1 0 1 0 14:55Darryl Hudson 11/11 80/172 46.5 20/59 33.9 79/95 83.2 259 23.5 1.18 21 54 75 6.82 28 41 32 2 18 0 408<strong>Team</strong> 49 55 104 1 9 3Totals 16 481/1138 42.3 129/372 34.7 262/359 73.0 1353 84.6 1.03 220 414 634 39.6 340 <strong>15</strong>8 268 31 <strong>15</strong>5 0G/GS FG FG% 3Pt 3Pt% FT FT% PTS Avg P/S ORB DRB TR Avg PF AST TO BS ST DAOpponents 16 552/1128 48.9 <strong>15</strong>4/407 37.8 3<strong>15</strong>/442 71.3 <strong>15</strong>75 98.4 1.17 233 487 720 45.0 283 251 247 58 162 0SHOOTING McDonalds Manawatu Jets OpponentsField Goal% 42.3 48.92Pt Goal% 46.0 55.23Pt Goal% 34.7 37.8Free Throw % 73.0 71.3BALL HANDLINGAssists <strong>15</strong>8 (9.9) 251 (<strong>15</strong>.7)Turnovers 268 (16.8) 247 (<strong>15</strong>.4)Steals <strong>15</strong>5 (9.7) 162 (10.1)Def. Assists 0 (0.0) 0 (0.0)BH Error% 19.7 18.1OTHEROff. Possessions 1360 (85.0) 1368 (85.5)Pts per Possession 0.99 1.<strong>15</strong>Def. Efficiency 48.3% 55.5%REBOUNDING McDonalds Manawatu Jets OpponentsTotal Rebound % 46.8 53.2Off. Rebound % 31.1 36.0Def. Rebound % 64.0 68.9Total Rebounds 634 (39.6) 720 (45.0)Off. Rebounds 220 (13.8) 233 (14.6)Def. Rebounds 414 (25.9) 487 (30.4)<strong>Team</strong> Rebounds 104 (6.5) 99 (6.2)SCORINGTotal Points 1353 (84.6) <strong>15</strong>75 (98.4)Pts off Turnovers 200 (12.5) 272 (17.0)2nd Effort Pts <strong>15</strong>5 (9.7) 188 (11.8)Pts off Bench 373 (23.3) 414 (25.9)3Pt Points 387 (24.2) 462 (28.9)Free Throw Pts 262 (16.4) 3<strong>15</strong> (19.7)Charges Taken 6 9
McDonalds Manawatu Jets Basketball - Season SummaryRecordDate OverallConf SiteScore Opponent High Point High Rebounder06/03/<strong>2010</strong> 0- 1 0- 1 H L 81-1<strong>15</strong> Wellington Saints 29-R Jeter 7-H Quinlivan13/03/<strong>2010</strong> 0- 2 0- 2 H L 76-118 0800 Easy LPG Bay Hawks16-M T Huna 6-C Brock26/03/<strong>2010</strong> 0- 3 0- 3 A L 73-105 Harbour Heat 30-R Jeter 5-P Bristol01/04/<strong>2010</strong> 0- 4 0- 4 A L 68-85 Chrischurch Cougars 29-R Jeter 11-R Jeter08/04/<strong>2010</strong> 0- 5 0- 5 H L 73-95 Waikato Pistons 25-R Jeter 9-C Reay17/04/<strong>2010</strong> 0- 6 0- 6 H L 120-123 2OTHarbour Heat 44-D Hudson 9-C MacLeod24/04/<strong>2010</strong> 0- 7 0- 7 H L 101-106 OT Chrischurch Cougars 34-D Hudson 10-R Jeter30/01/<strong>2010</strong> 0- 8 0- 8 A L 80-87 Waikato Pistons 23-D Hudson 14-C Reay06/05/<strong>2010</strong> 0- 9 0- 9 H L 86-106 Fico Finance Nelson Giants27-D Hudson 7-R Jeter21/05/<strong>2010</strong> 0-10 0-10A L 59-89 Zerofees Southland Sharks 10-Multiple 11-C Reay22/05/<strong>2010</strong> 1-10 1-10A W 89-68 Oceanagold Nuggets 34-R Jeter 7-L Funnell, D Hud28/05/<strong>2010</strong> 1-11 1-11A L 78-108 Taranaki Mountainairs 26-D Hudson 9-D Hudson03/06/<strong>2010</strong> 2-11 2-11H W 99-70 Oceanagold Nuggets 25-R Jeter 11-D Hudson05/06/<strong>2010</strong> 3-11 3-11A W 103-102 OT Fico Finance Nelson Giants23-C MacLeod, D Hudson7-C Reay07/06/<strong>2010</strong> 4-11 4-11H W 102-96 Taranaki Mountainairs 33-D Hudson 10-C MacLeod11/06/<strong>2010</strong> 4-12 4-12A L 65-102 Exodus Wellington Saints 13-C MacLeod, C Reay 10-C MacLeod<strong>Team</strong> Statistics SummaryOpponent FG 3 Pt FT PTS ORB DRB TR PF AST TO BS ST DAWellington Saints 28/66 10/28 <strong>15</strong>/18 81 12 25 37 20 10 23 0 11 00800 Easy LPG Bay Hawks 29/73 9/22 9/13 76 9 21 30 29 8 16 1 12 0Harbour Heat 25/65 7/23 16/26 73 8 18 26 18 11 18 2 <strong>15</strong> 0Chrischurch Cougars 25/77 8/29 10/18 68 22 27 49 23 9 17 0 9 0Waikato Pistons 27/66 7/19 12/19 73 <strong>15</strong> 28 43 27 8 27 2 16 0Harbour Heat 42/87 7/22 29/35 120 14 23 37 28 11 <strong>15</strong> 3 13 0Chrischurch Cougars 34/73 8/21 25/30 101 14 33 47 25 7 18 5 5 0Waikato Pistons 31/73 10/28 8/16 80 <strong>15</strong> 25 40 26 9 16 3 7 0Fico Finance Nelson Giants 30/84 8/26 18/21 86 20 22 42 17 9 10 2 13 0Zerofees Southland Sharks 21/75 5/25 12/22 59 24 27 51 24 8 23 1 7 0Oceanagold Nuggets 32/68 9/27 16/19 89 14 29 43 21 19 11 0 8 0Taranaki Mountainairs 28/68 6/19 16/23 78 12 17 29 14 6 16 4 6 0Oceanagold Nuggets 32/67 10/21 25/32 99 16 27 43 16 10 11 4 12 0Fico Finance Nelson Giants 39/71 14/26 11/18 103 7 32 39 19 <strong>15</strong> 18 1 12 0Taranaki Mountainairs 35/68 8/16 24/28 102 11 34 45 18 11 9 0 3 0Exodus Wellington Saints 23/57 3/20 16/21 65 7 26 33 23 7 20 3 6 0Individual Season Highs<strong>Team</strong> Season HighsMost Pts: 44 D Hudson vs. Harbour Heat Most Pts: 120 vs. Harbour HeatMost Fgm: 12 Multiple PlayersMost Fgm: 42 vs. Harbour HeatMost Fga: 25 D Hudson vs. Harbour Heat Most Fga: 87 vs. Harbour HeatMost 3pm: 6 R Jeter vs. Oceanagold Nuggets Most 3pm: 14 vs. Fico Finance Nelson GiantsMost 3pa: 11 Multiple PlayersMost 3pa: 29 vs. Chrischurch CougarsMost Ftm: 17 D Hudson vs. Harbour Heat Most Ftm: 29 vs. Harbour HeatMost Fta: 19 D Hudson vs. Harbour Heat Most Fta: 35 vs. Harbour HeatMost Reb: 14 C Reay vs. Waikato Pistons Most Reb: 51 vs. Zerofees Southland SharksMost Orb: 6 Multiple PlayersMost Orb: 24 vs. Zerofees Southland SharksMost Drb: 8 Multiple PlayersMost Drb: 34 vs. Taranaki MountainairsMost Ast: 7 D Hudson vs. Oceanagold Nuggets Most Ast: 19 vs. Oceanagold NuggetsMost Stl: 5 D Hudson vs. Oceanagold Nuggets Most Stl: 16 vs. Waikato PistonsMost Blk: 2 Multiple PlayersMost Blk: 5 vs. Chrischurch Cougars
CyberSports for Basketball - Offensive Lineup Combination AnalysisMcDonalds Manawatu JetsMost Often Used Lineup: 11-C MacLeod, 14-D Hudson, <strong>15</strong>-M T Huna, 22-C Reay, 23-R JeterMost Productive Offensive Lineup: 10-P Bristol, 11-C MacLeod, <strong>15</strong>-M T Huna, 23-R Jeter, 41-H QuinlivanMost Productive Rebounding Lineup: 11-C MacLeod, 14-D Hudson, <strong>15</strong>-M T Huna, 22-C Reay, 23-R JeterBest Defensive Combination: 10-P Bristol, 11-C MacLeod, <strong>15</strong>-M T Huna, 23-R Jeter, 41-H QuinlivanBest Lineup to Force Turnovers: 5-K Hokianga, 14-C Brock, <strong>15</strong>-M T Huna, 41-H Quinlivan, 23-R JeterBest Overall Lineup:11-C MacLeod, 14-D Hudson, <strong>15</strong>-M T Huna, 22-C Reay, 23-R JeterBest Free Throw Shooting Lineup: 14-D Hudson, 14-C Brock, 22-C Reay, 23-R Jeter, 32-R AllenLineups Sorted by Playing TimePlayers Time Pts11-C MacLeod, 14-D Hudson, <strong>15</strong>-M T Huna, 22-C Reay, 23-R Jeter 50.22 -75-K Hokianga, 14-D Hudson, <strong>15</strong>-M T Huna, 22-C Reay, 23-R Jeter 48.25 -165-K Hokianga, 10-P Bristol, <strong>15</strong>-M T Huna, 22-C Reay, 23-R Jeter 22.92 -85-K Hokianga, 6-L Funnell, 14-D Hudson, <strong>15</strong>-M T Huna, 22-C Reay 18.13 -125-K Hokianga, 11-C MacLeod, 14-D Hudson, <strong>15</strong>-M T Huna, 22-C Reay 16.28 -66-L Funnell, 11-C MacLeod, 14-D Hudson, <strong>15</strong>-M T Huna, 22-C Reay <strong>15</strong>.03 -56-L Funnell, 14-D Hudson, <strong>15</strong>-M T Huna, 22-C Reay, 23-R Jeter 10.17 -25-K Hokianga, 10-P Bristol, 11-C MacLeod, 21-P Finch, 23-R Jeter 8.53 -610-P Bristol, 11-C MacLeod, <strong>15</strong>-M T Huna, 23-R Jeter, 41-H Quinlivan 8.23 +214-D Hudson, <strong>15</strong>-M T Huna, 21-P Finch, 22-C Reay, 23-R Jeter 7.83 -2Lineups Sorted by Points per MinutePlayers PPM Norm Pts Time10-P Bristol, 11-C MacLeod, <strong>15</strong>-M T Huna, 23-R Jeter, 41-H Quinlivan +0.24 +9.72 +2 8.2311-C MacLeod, 14-D Hudson, <strong>15</strong>-M T Huna, 22-C Reay, 23-R Jeter -0.14 -5.58 -7 50.226-L Funnell, 14-D Hudson, <strong>15</strong>-M T Huna, 22-C Reay, 23-R Jeter -0.20 -7.87 -2 10.1714-D Hudson, <strong>15</strong>-M T Huna, 21-P Finch, 22-C Reay, 23-R Jeter -0.26 -10.21 -2 7.835-K Hokianga, 14-D Hudson, <strong>15</strong>-M T Huna, 22-C Reay, 23-R Jeter -0.33 -13.26 -16 48.256-L Funnell, 11-C MacLeod, 14-D Hudson, <strong>15</strong>-M T Huna, 22-C Reay -0.33 -13.30 -5 <strong>15</strong>.035-K Hokianga, 10-P Bristol, <strong>15</strong>-M T Huna, 22-C Reay, 23-R Jeter -0.35 -13.96 -8 22.925-K Hokianga, 11-C MacLeod, 14-D Hudson, <strong>15</strong>-M T Huna, 22-C Reay -0.37 -14.74 -6 16.285-K Hokianga, 6-L Funnell, 14-D Hudson, <strong>15</strong>-M T Huna, 22-C Reay -0.66 -26.47 -12 18.135-K Hokianga, 10-P Bristol, 11-C MacLeod, 21-P Finch, 23-R Jeter -0.70 -28.12 -6 8.53Lineups Sorted by Rebounds per MinutePlayers RPM Norm Reb Time11-C MacLeod, 14-D Hudson, <strong>15</strong>-M T Huna, 22-C Reay, 23-R Jeter +0.24 +9.56 +12 50.225-K Hokianga, 10-P Bristol, <strong>15</strong>-M T Huna, 22-C Reay, 23-R Jeter +0.00 +0.00 +0 22.926-L Funnell, 14-D Hudson, <strong>15</strong>-M T Huna, 22-C Reay, 23-R Jeter -0.20 -7.87 -2 10.175-K Hokianga, 14-D Hudson, <strong>15</strong>-M T Huna, 22-C Reay, 23-R Jeter -0.29 -11.61 -14 48.2510-P Bristol, 11-C MacLeod, <strong>15</strong>-M T Huna, 23-R Jeter, 41-H Quinlivan -0.36 -14.57 -3 8.235-K Hokianga, 11-C MacLeod, 14-D Hudson, <strong>15</strong>-M T Huna, 22-C Reay -0.37 -14.74 -6 16.2814-D Hudson, <strong>15</strong>-M T Huna, 21-P Finch, 22-C Reay, 23-R Jeter -0.38 -<strong>15</strong>.32 -3 7.836-L Funnell, 11-C MacLeod, 14-D Hudson, <strong>15</strong>-M T Huna, 22-C Reay -0.40 -<strong>15</strong>.96 -6 <strong>15</strong>.035-K Hokianga, 6-L Funnell, 14-D Hudson, <strong>15</strong>-M T Huna, 22-C Reay -0.55 -22.06 -10 18.135-K Hokianga, 10-P Bristol, 11-C MacLeod, 21-P Finch, 23-R Jeter -0.70 -28.12 -6 8.53Total time captured in lineups: 205.60Productive scoring minutes: 8.23Productive rebounding minutes: 50.22Productive scoring percentage: 4.00%Productive rebounding percentage: 24.42%
CyberSports for Basketball - Defensive Lineup Combination AnalysisMcDonalds Manawatu JetsLineup Sorted by Defensive PossessionsOppoDefPlayers Pts Poss5-K Hokianga, 14-D Hudson, <strong>15</strong>-M T Huna, 22-C Reay, 23-R Jeter 117 13311-C MacLeod, 14-D Hudson, <strong>15</strong>-M T Huna, 22-C Reay, 23-R Jeter 127 12<strong>15</strong>-K Hokianga, 10-P Bristol, <strong>15</strong>-M T Huna, 22-C Reay, 23-R Jeter 43 625-K Hokianga, 6-L Funnell, 14-D Hudson, <strong>15</strong>-M T Huna, 22-C Reay 46 525-K Hokianga, 11-C MacLeod, 14-D Hudson, <strong>15</strong>-M T Huna, 22-C Reay 48 506-L Funnell, 11-C MacLeod, 14-D Hudson, <strong>15</strong>-M T Huna, 22-C Reay 33 3710-P Bristol, 11-C MacLeod, <strong>15</strong>-M T Huna, 23-R Jeter, 41-H Quinlivan 18 275-K Hokianga, 10-P Bristol, 11-C MacLeod, 21-P Finch, 23-R Jeter 21 246-L Funnell, 14-D Hudson, <strong>15</strong>-M T Huna, 22-C Reay, 23-R Jeter 22 2<strong>15</strong>-K Hokianga, 14-C Brock, <strong>15</strong>-M T Huna, 41-H Quinlivan, 23-R Jeter 26 19Lineup Sorted by Points per Possession AllowedPts/DefPlayers Poss Poss10-P Bristol, 11-C MacLeod, <strong>15</strong>-M T Huna, 23-R Jeter, 41-H Quinlivan 0.67 275-K Hokianga, 10-P Bristol, <strong>15</strong>-M T Huna, 22-C Reay, 23-R Jeter 0.69 625-K Hokianga, 14-D Hudson, <strong>15</strong>-M T Huna, 22-C Reay, 23-R Jeter 0.88 1335-K Hokianga, 10-P Bristol, 11-C MacLeod, 21-P Finch, 23-R Jeter 0.88 245-K Hokianga, 6-L Funnell, 14-D Hudson, <strong>15</strong>-M T Huna, 22-C Reay 0.88 526-L Funnell, 11-C MacLeod, 14-D Hudson, <strong>15</strong>-M T Huna, 22-C Reay 0.89 375-K Hokianga, 11-C MacLeod, 14-D Hudson, <strong>15</strong>-M T Huna, 22-C Reay 0.96 5011-C MacLeod, 14-D Hudson, <strong>15</strong>-M T Huna, 22-C Reay, 23-R Jeter 1.05 1216-L Funnell, 14-D Hudson, <strong>15</strong>-M T Huna, 22-C Reay, 23-R Jeter 1.05 2<strong>15</strong>-K Hokianga, 14-C Brock, <strong>15</strong>-M T Huna, 41-H Quinlivan, 23-R Jeter 1.37 19Lineup Sorted by Defensive Efficiency (Stops)Def Def DefPlayers Eff Stops Poss5-K Hokianga, 10-P Bristol, <strong>15</strong>-M T Huna, 22-C Reay, 23-R Jeter 0.48 30 625-K Hokianga, 6-L Funnell, 14-D Hudson, <strong>15</strong>-M T Huna, 22-C Reay 0.38 20 5211-C MacLeod, 14-D Hudson, <strong>15</strong>-M T Huna, 22-C Reay, 23-R Jeter 0.38 46 1216-L Funnell, 14-D Hudson, <strong>15</strong>-M T Huna, 22-C Reay, 23-R Jeter 0.38 8 2<strong>15</strong>-K Hokianga, 14-C Brock, <strong>15</strong>-M T Huna, 41-H Quinlivan, 23-R Jeter 0.37 7 195-K Hokianga, 14-D Hudson, <strong>15</strong>-M T Huna, 22-C Reay, 23-R Jeter 0.34 45 13310-P Bristol, 11-C MacLeod, <strong>15</strong>-M T Huna, 23-R Jeter, 41-H Quinlivan 0.33 9 275-K Hokianga, 10-P Bristol, 11-C MacLeod, 21-P Finch, 23-R Jeter 0.33 8 246-L Funnell, 11-C MacLeod, 14-D Hudson, <strong>15</strong>-M T Huna, 22-C Reay 0.32 12 375-K Hokianga, 11-C MacLeod, 14-D Hudson, <strong>15</strong>-M T Huna, 22-C Reay 0.26 13 50Lineup Sorted by Percentage of Ball Handling Errors Forced% BH Oppo DefPlayers Err TO Poss5-K Hokianga, 14-C Brock, <strong>15</strong>-M T Huna, 41-H Quinlivan, 23-R Jeter 0.26 5 195-K Hokianga, 10-P Bristol, <strong>15</strong>-M T Huna, 22-C Reay, 23-R Jeter 0.23 14 625-K Hokianga, 6-L Funnell, 14-D Hudson, <strong>15</strong>-M T Huna, 22-C Reay 0.19 10 526-L Funnell, 14-D Hudson, <strong>15</strong>-M T Huna, 22-C Reay, 23-R Jeter 0.19 4 2110-P Bristol, 11-C MacLeod, <strong>15</strong>-M T Huna, 23-R Jeter, 41-H Quinlivan 0.19 5 2711-C MacLeod, 14-D Hudson, <strong>15</strong>-M T Huna, 22-C Reay, 23-R Jeter 0.13 16 1216-L Funnell, 11-C MacLeod, 14-D Hudson, <strong>15</strong>-M T Huna, 22-C Reay 0.14 5 375-K Hokianga, 14-D Hudson, <strong>15</strong>-M T Huna, 22-C Reay, 23-R Jeter 0.11 14 1335-K Hokianga, 11-C MacLeod, 14-D Hudson, <strong>15</strong>-M T Huna, 22-C Reay 0.08 4 505-K Hokianga, 10-P Bristol, 11-C MacLeod, 21-P Finch, 23-R Jeter 0.04 1 24
McDonalds Manawatu Jets Basketball - Season Statistical RankingField Goals Made Att FG% 3 Point Goals Made Att 3FG% Free Throws Made Att FT%TORRIE, Adrian 1 1 100 O'CONNELL, Josh 2 3 66.7 ALLEN, Ronald 3 3 100ALLEN, Ronald 4 7 57.1 ALLEN, Ronald 1 2 50.0 BROCK, Callum 1 1 100MACLEOD, Calum 59 110 53.6 BRISTOL, Paul 6 <strong>15</strong> 40.0 HUDSON, Darryl 79 95 83.2REAY, Chris 65 138 47.1 JETER, Richard 38 97 39.2 JETER, Richard 44 55 80.0HUDSON, Darryl 80 172 46.5 HUNA, Matt Te 25 72 34.7 REAY, Chris 39 52 75.0JETER, Richard 94 223 42.2 QUINLIVAN, Hugh 9 26 34.6 MACLEOD, Calum 29 40 72.5HOKIANGA, Kaine 46 113 40.7 HUDSON, Darryl 20 59 33.9 HOKIANGA, Kaine 11 16 68.8HUNA, Matt Te 60 <strong>15</strong>0 40.0 HOKIANGA, Kaine <strong>15</strong> 45 33.3 FINCH, Piers 4 6 66.7BROCK, Callum 6 <strong>15</strong> 40.0 FUNNELL, Logan 8 24 33.3 BRISTOL, Paul 12 19 63.2YAHATA, Kos 2 5 40.0 BROCK, Callum 1 3 33.3 HUNA, Matt Te 24 41 58.5BRISTOL, Paul 14 36 38.9 YAHATA, Kos 1 3 33.3 FUNNELL, Logan 7 12 58.3FUNNELL, Logan 14 40 35.0 FINCH, Piers 3 17 17.6 QUINLIVAN, Hugh 9 19 47.4QUINLIVAN, Hugh 28 82 34.1O'CONNELL, Josh 3 9 33.3FINCH, Piers 5 36 13.9Off Rebounds Num G Avg Def Rebounds Num G Avg Total Rebounds Num G AvgREAY, Chris 30 14 2.14 REAY, Chris 61 14 4.36 REAY, Chris 91 14 6.50MACLEOD, Calum 28 16 1.75 MACLEOD, Calum 54 16 3.38 MACLEOD, Calum 82 16 5.13JETER, Richard 26 16 1.63 HUDSON, Darryl 54 11 4.91 HUDSON, Darryl 75 11 6.82HUDSON, Darryl 21 11 1.91 JETER, Richard 48 16 3.00 JETER, Richard 74 16 4.63FUNNELL, Logan 14 12 1.17 HUNA, Matt Te 39 16 2.44 HUNA, Matt Te 50 16 3.13QUINLIVAN, Hugh 12 16 0.75 QUINLIVAN, Hugh 26 16 1.63 QUINLIVAN, Hugh 38 16 2.38HUNA, Matt Te 11 16 0.69 HOKIANGA, Kaine 22 16 1.38 FUNNELL, Logan 30 12 2.50BRISTOL, Paul 10 16 0.63 BRISTOL, Paul 17 16 1.06 HOKIANGA, Kaine 27 16 1.69FINCH, Piers 9 14 0.64 FUNNELL, Logan 16 12 1.33 BRISTOL, Paul 27 16 1.69HOKIANGA, Kaine 5 16 0.31 FINCH, Piers 14 14 1.00 FINCH, Piers 23 14 1.64BROCK, Callum 2 4 0.50 BROCK, Callum 4 4 1.00 BROCK, Callum 6 4 1.50O'CONNELL, Josh 2 6 0.33 TORRIE, Adrian 4 3 1.33 TORRIE, Adrian 5 3 1.67TORRIE, Adrian 1 3 0.33 O'CONNELL, Josh 2 6 0.33Assists Num G Avg Steals Num G Avg Scoring Num G AvgHUDSON, Darryl 41 11 3.73 HUNA, Matt Te 32 16 2.00 JETER, Richard 270 16 16.9HUNA, Matt Te 32 16 2.00 JETER, Richard 21 16 1.31 HUDSON, Darryl 259 11 23.5REAY, Chris <strong>15</strong> 14 1.07 REAY, Chris 19 14 1.36 HUNA, Matt Te 169 16 10.6BRISTOL, Paul 14 16 0.88 FUNNELL, Logan 18 12 1.50 REAY, Chris 169 14 12.1FUNNELL, Logan 12 12 1.00 HUDSON, Darryl 18 11 1.64 MACLEOD, Calum 147 16 9.19HOKIANGA, Kaine 11 16 0.69 QUINLIVAN, Hugh <strong>15</strong> 16 0.94 HOKIANGA, Kaine 118 16 7.38JETER, Richard 10 16 0.63 BRISTOL, Paul 10 16 0.63 QUINLIVAN, Hugh 74 16 4.63MACLEOD, Calum 9 16 0.56 HOKIANGA, Kaine 7 16 0.44 BRISTOL, Paul 46 16 2.88QUINLIVAN, Hugh 7 16 0.44 FINCH, Piers 4 14 0.29 FUNNELL, Logan 43 12 3.58FINCH, Piers 5 14 0.36 MACLEOD, Calum 3 16 0.19 FINCH, Piers 17 14 1.21SIMON, Daniel 1 1 1.00 TORRIE, Adrian 2 3 0.67 BROCK, Callum 14 4 3.50BROCK, Callum 1 4 0.25 ALLEN, Ronald 12 1 12.0O'CONNELL, Josh 1 6 0.17 O'CONNELL, Josh 8 6 1.33YAHATA, Kos 1 1 1.00 YAHATA, Kos 5 1 5.00TORRIE, Adrian 2 3 0.67Blocks Num G Avg Turn Overs Num G Avg Fouls Off Pers TotalJETER, Richard 8 16 0.50 JETER, Richard 47 16 2.94 HOKIANGA, Kaine 2 46 48MACLEOD, Calum 7 16 0.44 HUNA, Matt Te 34 16 2.13 REAY, Chris 4 43 47REAY, Chris 6 14 0.43 HUDSON, Darryl 32 11 2.91 MACLEOD, Calum 2 42 44QUINLIVAN, Hugh 3 16 0.19 BRISTOL, Paul 28 16 1.75 JETER, Richard 3 34 37HOKIANGA, Kaine 2 16 0.13 REAY, Chris 27 14 1.93 HUNA, Matt Te 1 31 32TORRIE, Adrian 2 3 0.67 HOKIANGA, Kaine 21 16 1.31 QUINLIVAN, Hugh 0 30 30HUDSON, Darryl 2 11 0.18 MACLEOD, Calum 21 16 1.31 HUDSON, Darryl 3 25 28HUNA, Matt Te 1 16 0.06 QUINLIVAN, Hugh 17 16 1.06 FUNNELL, Logan 0 26 26FINCH, Piers 9 14 0.64 FINCH, Piers 1 18 19FUNNELL, Logan 8 12 0.67 BRISTOL, Paul 0 16 16BROCK, Callum 5 4 1.25 BROCK, Callum 0 5 5TORRIE, Adrian 5 3 1.67 O'CONNELL, Josh 0 3 3O'CONNELL, Josh 2 6 0.33 ALLEN, Ronald 1 1 2ALLEN, Ronald 2 1 2.00 TORRIE, Adrian 0 2 2YAHATA, Kos 1 1 1.00 YAHATA, Kos 0 1 1Charges Taken Num G Avg Productivity Value G Avg Def Assist Num G AvgHUNA, Matt Te 2 16 0.13 HUDSON, Darryl 240 11 21.8HUDSON, Darryl 2 11 0.18 JETER, Richard 170 16 10.6ALLEN, Ronald 1 1 1.00 REAY, Chris <strong>15</strong>6 14 11.1REAY, Chris 1 14 0.07 MACLEOD, Calum 133 16 8.31HUNA, Matt Te 119 16 7.41FUNNELL, Logan 43.0 12 3.58
Oceanagold Nuggets Basketball - Season Box ScoreRecord Overall Home Away NeutralAll Games 0-18 0-9 0-9 0-0Conference 0-18 0-9 0-9 0-0Non-Conference 0-0 0-0 0-0 0-0Playoff 0-0 0-0 0-0 0-0Name G/GS FG FG% 3Pt 3Pt% FT FT% PTS Avg P/S ORB DRB TR Avg PF AST TO BS ST DA MINTom Rowe 17/12 28/78 35.9 0/5 0.00 11/<strong>15</strong> 73.3 67 3.94 0.79 28 42 70 4.12 37 10 <strong>15</strong> 1 4 0 406John Barber 10/9 53/134 39.6 13/45 28.9 22/29 75.9 141 14.1 0.95 16 50 66 6.60 14 10 22 7 <strong>15</strong> 0 336Steve Robinson 11/1 5/10 50.0 0/0 0.00 2/2 100 12 1.09 1.09 2 4 6 0.55 4 1 7 0 1 0 46:26Matt Trueman 16/8 19/43 44.2 0/1 0.00 1/8 12.5 39 2.44 0.83 20 23 43 2.69 42 8 9 2 5 0 223Matt Gillan 18/0 34/103 33.0 18/67 26.9 3/4 75.0 89 4.94 0.85 <strong>15</strong> 37 52 2.89 27 13 6 1 6 0 273Chris Hepburn 7/0 2/7 28.6 0/0 0.00 0/0 0.00 4 0.57 0.57 2 5 7 1.00 10 3 1 0 1 0 51:58James Ross 17/5 31/87 35.6 14/35 40.0 19/31 61.3 95 5.59 0.93 6 21 27 1.59 39 26 31 3 17 0 359Josh Kitson 1/0 0/1 0.00 0/1 0.00 0/0 0.00 0 0.00 0.00 0 0 0 0.00 1 0 0 0 0 0 4:05Tyler Amaya 18/18 135/333 40.5 46/<strong>15</strong>4 29.9 96/145 66.2 412 22.9 1.02 27 94 121 6.72 36 73 75 3 23 0 650Riki Buckrell 17/13 32/79 40.5 <strong>15</strong>/42 35.7 7/12 58.3 86 5.06 1.01 10 26 36 2.12 22 19 23 3 9 0 322Antoine Tisby 6/6 53/104 51.0 0/3 0.00 35/58 60.3 141 23.5 1.06 23 39 62 10.3 17 7 24 4 9 0 209Mitch McRae 2/0 0/1 0.00 0/1 0.00 0/0 0.00 0 0.00 0.00 0 0 0 0.00 1 1 0 0 0 0 6:36Hayden Miller 6/0 0/2 0.00 0/1 0.00 0/0 0.00 0 0.00 0.00 2 1 3 0.50 1 2 3 0 0 0 13:30Andrew Parke 2/0 0/2 0.00 0/0 0.00 0/0 0.00 0 0.00 0.00 1 5 6 3.00 3 0 1 0 0 0 17:48Luke Aston 14/0 7/26 26.9 5/17 29.4 4/4 100 23 1.64 0.82 9 <strong>15</strong> 24 1.71 23 3 8 1 5 0 117Sam To'omata 18/18 68/193 35.2 34/93 36.6 44/59 74.6 214 11.9 0.96 14 39 53 2.94 29 34 62 0 11 0 590Tim Coudret 3/0 0/0 0.00 0/0 0.00 0/2 0.00 0 0.00 0.00 0 3 3 1.00 5 0 1 0 0 0 17:32Tom Allen 0/0 0/0 0.00 0/0 0.00 0/0 0.00 0 0.00 0.00 0 0 0 0.00 0 0 0 0 0 0 DNP<strong>Team</strong> 32 56 88 10 9Totals 18 467/1203 38.8 145/465 31.2 244/369 66.1 1323 73.5 0.95 207 460 667 37.1 311 210 298 25 1<strong>15</strong> 0G/GS FG FG% 3Pt 3Pt% FT FT% PTS Avg P/S ORB DRB TR Avg PF AST TO BS ST DAOpponents 18 657/1320 49.8 <strong>15</strong>1/423 35.7 270/400 67.5 1735 96.4 1.14 276 585 861 47.8 291 346 230 49 176 0SHOOTING Oceanagold Nuggets OpponentsField Goal% 38.8 49.82Pt Goal% 43.6 56.43Pt Goal% 31.2 35.7Free Throw % 66.1 67.5BALL HANDLINGAssists 210 (11.7) 346 (19.2)Turnovers 298 (16.6) 230 (12.8)Steals 1<strong>15</strong> (6.4) 176 (9.8)Def. Assists 0 (0.0) 0 (0.0)BH Error% 20.1 <strong>15</strong>.5OTHEROff. Possessions 1482 (82.3) 1483 (82.4)Pts per Possession 0.89 1.17Def. Efficiency 46.5% 59.6%REBOUNDING Oceanagold Nuggets OpponentsTotal Rebound % 43.7 56.3Off. Rebound % 26.1 37.5Def. Rebound % 62.5 73.9Total Rebounds 667 (37.1) 861 (47.8)Off. Rebounds 207 (11.5) 276 (<strong>15</strong>.3)Def. Rebounds 460 (25.6) 585 (32.5)<strong>Team</strong> Rebounds 88 (4.9) 89 (4.9)SCORINGTotal Points 1323 (73.5) 1735 (96.4)Pts off Turnovers 203 (11.3) 362 (20.1)2nd Effort Pts 177 (9.8) 232 (12.9)Pts off Bench 231 (12.8) 497 (27.6)3Pt Points 435 (24.2) 453 (25.2)Free Throw Pts 244 (13.6) 270 (<strong>15</strong>.0)Charges Taken 7 8
Oceanagold Nuggets Basketball - Season SummaryRecordDate Overall Conf Site Score Opponent High Point High Rebounder06/03/<strong>2010</strong> 0- 1 0- 1 A L 82-99 Harbour Heat 32-A Tisby 19-A Tisby14/03/<strong>2010</strong> 0- 2 0- 2 H L 71-104 Chrischurch Cougars 23-T Amaya 9-A Tisby19/03/<strong>2010</strong> 0- 3 0- 3 A L 60-92 Fico Finance Nelson Giants 28-A Tisby 10-A Tisby26/03/<strong>2010</strong> 0- 4 0- 4 A L 64-97 Waikato Pistons 25-A Tisby 7-T Amaya27/03/<strong>2010</strong> 0- 5 0- 5 A L 82-94 Taranaki Mountainairs 23-T Amaya 5-Multiple03/04/<strong>2010</strong> 0- 6 0- 6 H L 61-82 Taranaki Mountainairs 23-A Tisby 13-A Tisby09/04/<strong>2010</strong> 0- 7 0- 7 H L 71-102 Fico Finance Nelson Giants 23-T Amaya 6-T Amaya17/04/<strong>2010</strong> 0- 8 0- 8 H L 76-82 Zerofees Southland Sharks 27-T Amaya 9-T Amaya24/04/<strong>2010</strong> 0- 9 0- 9 A L 63-80 Zerofees Southland Sharks 24-T Amaya 10-T Amaya, J Barber07/05/<strong>2010</strong> 0-10 0-10 H L 80-94 Exodus Wellington Saints 31-T Amaya 12-J Barber14/05/<strong>2010</strong> 0-11 0-11 H L 62-95 Waikato Pistons 22-S To'omata 10-S To'omata22/05/<strong>2010</strong> 0-12 0-12 H L 68-89 McDonalds Manawatu Jets 18-J Ross 11-T Amaya28/05/<strong>2010</strong> 0-13 0-13 A L 67-102 0800 Easy LPG Bay Hawks 24-T Amaya 6-T Amaya27/05/<strong>2010</strong> 0-14 0-14 H L 84-106 Harbour Heat 23-T Amaya 11-T Amaya03/06/<strong>2010</strong> 0-<strong>15</strong> 0-<strong>15</strong> A L 70-99 McDonalds Manawatu Jets 24-T Amaya 5-J Barber04/06/<strong>2010</strong> 0-16 0-16 A L 99-103 Exodus Wellington Saints 38-T Amaya 6-J Barber, T Amaya10/06/<strong>2010</strong> 0-17 0-17 A L 80-101 Chrischurch Cougars 27-T Amaya 11-T Rowe12/06/<strong>2010</strong> 0-18 0-18 H L 83-114 0800 Easy LPG Bay Hawks 29-T Amaya 8-T Rowe<strong>Team</strong> Statistics SummaryOpponent FG 3 Pt FT PTS ORB DRB TR PF AST TO BS ST DAHarbour Heat 28/66 6/20 20/32 82 11 31 42 18 13 21 1 14 0Chrischurch Cougars 26/72 3/27 16/19 71 11 30 41 18 10 14 3 3 0Fico Finance Nelson Giants 21/65 3/21 <strong>15</strong>/23 60 13 23 36 19 8 19 1 5 0Waikato Pistons 24/63 6/23 10/13 64 8 22 30 16 10 25 3 4 0Taranaki Mountainairs 27/65 12/31 16/25 82 9 23 32 18 12 9 1 6 0Taranaki Mountainairs 21/60 4/19 <strong>15</strong>/28 61 <strong>15</strong> 26 41 20 13 24 1 12 0Fico Finance Nelson Giants 30/69 3/19 8/18 71 8 20 28 25 9 14 0 9 0Zerofees Southland Sharks 26/74 9/24 <strong>15</strong>/25 76 14 30 44 21 11 16 1 11 0Zerofees Southland Sharks 20/68 6/23 17/25 63 14 28 42 11 6 17 3 4 0Exodus Wellington Saints 29/65 13/29 9/10 80 8 25 33 <strong>15</strong> 17 20 1 7 0Waikato Pistons 21/66 8/25 12/25 62 13 34 47 18 9 18 1 1 0McDonalds Manawatu Jets 23/57 9/24 13/21 68 10 24 34 16 <strong>15</strong> 14 0 2 00800 Easy LPG Bay Hawks 25/70 8/33 9/10 67 12 23 35 13 6 12 2 4 0Harbour Heat 32/74 12/28 8/<strong>15</strong> 84 10 27 37 20 18 13 2 7 0McDonalds Manawatu Jets 24/67 9/31 13/20 70 17 23 40 19 4 16 1 7 0Exodus Wellington Saints 33/58 11/27 22/27 99 6 23 29 16 20 20 2 8 0Chrischurch Cougars 28/69 12/34 12/17 80 10 29 39 19 18 18 1 8 00800 Easy LPG Bay Hawks 29/75 11/27 14/16 83 18 19 37 13 11 8 1 3 0Individual Season Highs<strong>Team</strong> Season HighsMost Pts: 38 T Amaya vs. Exodus Wellington Saints Most Pts: 99 vs. Exodus Wellington SaintsMost Fgm: 11 Multiple PlayersMost Fgm: 33 vs. Exodus Wellington SaintsMost Fga: 25 T Amaya vs. 0800 Easy LPG Bay Hawks Most Fga: 75 vs. 0800 Easy LPG Bay HawksMost 3pm: 5 Multiple PlayersMost 3pm: 13 vs. Exodus Wellington SaintsMost 3pa: 13 T Amaya vs. Exodus Wellington Saints Most 3pa: 34 vs. Chrischurch CougarsMost Ftm: 11 T Amaya vs. Exodus Wellington Saints Most Ftm: 22 vs. Exodus Wellington SaintsMost Fta: 16 A Tisby vs. Harbour HeatMost Fta: 32 vs. Harbour HeatMost Reb: 19 A Tisby vs. Harbour HeatMost Reb: 47 vs. Waikato PistonsMost Orb: 8 A Tisby vs. Taranaki Mountainairs Most Orb: 18 vs. 0800 Easy LPG Bay HawksMost Drb: 14 A Tisby vs. Harbour HeatMost Drb: 34 vs. Waikato PistonsMost Ast: 10 T Amaya vs. Chrischurch Cougars Most Ast: 20 vs. Exodus Wellington SaintsMost Stl: 4 Multiple PlayersMost Stl: 14 vs. Harbour HeatMost Blk: 2 Multiple PlayersMost Blk: 3 vs. Chrischurch Cougars
CyberSports for Basketball - Offensive Lineup Combination AnalysisOceanagold NuggetsMost Often Used Lineup: 6-T Rowe, 7-J Barber, 21-T Amaya, 22-R Buckrell, 53-S To'omataMost Productive Offensive Lineup: 7-J Barber, 9-M Trueman, <strong>15</strong>-J Ross, 21-T Amaya, 53-S To'omataMost Productive Rebounding Lineup: 6-T Rowe, 11-M Gillan, <strong>15</strong>-J Ross, 21-T Amaya, 32-A TisbyBest Defensive Combination: 11-M Gillan, 21-T Amaya, 22-R Buckrell, 32-A Tisby, 53-S To'omataBest Lineup to Force Turnovers: 6-T Rowe, 21-T Amaya, 22-R Buckrell, 32-A Tisby, 53-S To'omataBest Overall Lineup:7-J Barber, 11-M Gillan, 21-T Amaya, 32-A Tisby, 53-S To'omataBest Free Throw Shooting Lineup: 7-J Barber, 8-S Robinson, 11-M Gillan, 50-L Aston, 53-S To'omataLineups Sorted by Playing TimePlayers Time Pts6-T Rowe, 7-J Barber, 21-T Amaya, 22-R Buckrell, 53-S To'omata 62.95 -656-T Rowe, 7-J Barber, <strong>15</strong>-J Ross, 21-T Amaya, 53-S To'omata 47.58 -187-J Barber, 11-M Gillan, <strong>15</strong>-J Ross, 21-T Amaya, 53-S To'omata 29.23 -<strong>15</strong>9-M Trueman, 21-T Amaya, 22-R Buckrell, 32-A Tisby, 53-S To'omata 29.10 -126-T Rowe, 9-M Trueman, 21-T Amaya, 22-R Buckrell, 53-S To'omata 27.40 -3311-M Gillan, <strong>15</strong>-J Ross, 21-T Amaya, 32-A Tisby, 53-S To'omata 22.70 -<strong>15</strong>11-M Gillan, 21-T Amaya, 22-R Buckrell, 32-A Tisby, 53-S To'omata 21.17 -<strong>15</strong>7-J Barber, 9-M Trueman, <strong>15</strong>-J Ross, 21-T Amaya, 53-S To'omata 17.23 +16-T Rowe, 21-T Amaya, 22-R Buckrell, 32-A Tisby, 53-S To'omata <strong>15</strong>.75 -<strong>15</strong>6-T Rowe, 11-M Gillan, <strong>15</strong>-J Ross, 21-T Amaya, 32-A Tisby 13.38 -6Lineups Sorted by Points per MinutePlayers PPM Norm Pts Time7-J Barber, 9-M Trueman, <strong>15</strong>-J Ross, 21-T Amaya, 53-S To'omata +0.06 +2.32 +1 17.236-T Rowe, 7-J Barber, <strong>15</strong>-J Ross, 21-T Amaya, 53-S To'omata -0.38 -<strong>15</strong>.13 -18 47.589-M Trueman, 21-T Amaya, 22-R Buckrell, 32-A Tisby, 53-S To'omata -0.41 -16.49 -12 29.106-T Rowe, 11-M Gillan, <strong>15</strong>-J Ross, 21-T Amaya, 32-A Tisby -0.45 -17.93 -6 13.387-J Barber, 11-M Gillan, <strong>15</strong>-J Ross, 21-T Amaya, 53-S To'omata -0.51 -20.52 -<strong>15</strong> 29.2311-M Gillan, <strong>15</strong>-J Ross, 21-T Amaya, 32-A Tisby, 53-S To'omata -0.66 -26.43 -<strong>15</strong> 22.7011-M Gillan, 21-T Amaya, 22-R Buckrell, 32-A Tisby, 53-S To'omata -0.71 -28.35 -<strong>15</strong> 21.176-T Rowe, 21-T Amaya, 22-R Buckrell, 32-A Tisby, 53-S To'omata -0.95 -38.10 -<strong>15</strong> <strong>15</strong>.756-T Rowe, 7-J Barber, 21-T Amaya, 22-R Buckrell, 53-S To'omata -1.03 -41.30 -65 62.956-T Rowe, 9-M Trueman, 21-T Amaya, 22-R Buckrell, 53-S To'omata -1.20 -48.18 -33 27.40Lineups Sorted by Rebounds per MinutePlayers RPM Norm Reb Time6-T Rowe, 11-M Gillan, <strong>15</strong>-J Ross, 21-T Amaya, 32-A Tisby +0.22 +8.97 +3 13.3811-M Gillan, <strong>15</strong>-J Ross, 21-T Amaya, 32-A Tisby, 53-S To'omata -0.04 -1.76 -1 22.706-T Rowe, 21-T Amaya, 22-R Buckrell, 32-A Tisby, 53-S To'omata -0.06 -2.54 -1 <strong>15</strong>.759-M Trueman, 21-T Amaya, 22-R Buckrell, 32-A Tisby, 53-S To'omata -0.10 -4.12 -3 29.107-J Barber, 11-M Gillan, <strong>15</strong>-J Ross, 21-T Amaya, 53-S To'omata -0.21 -8.21 -6 29.237-J Barber, 9-M Trueman, <strong>15</strong>-J Ross, 21-T Amaya, 53-S To'omata -0.23 -9.28 -4 17.236-T Rowe, 7-J Barber, <strong>15</strong>-J Ross, 21-T Amaya, 53-S To'omata -0.29 -11.77 -14 47.586-T Rowe, 7-J Barber, 21-T Amaya, 22-R Buckrell, 53-S To'omata -0.49 -19.70 -31 62.956-T Rowe, 9-M Trueman, 21-T Amaya, 22-R Buckrell, 53-S To'omata -0.73 -29.20 -20 27.4011-M Gillan, 21-T Amaya, 22-R Buckrell, 32-A Tisby, 53-S To'omata -0.94 -37.80 -20 21.17Total time captured in lineups: 286.50Productive scoring minutes: 17.23Productive rebounding minutes: 13.38Productive scoring percentage: 6.02%Productive rebounding percentage: 4.67%
CyberSports for Basketball - Defensive Lineup Combination AnalysisOceanagold NuggetsLineup Sorted by Defensive PossessionsOppoDefPlayers Pts Poss6-T Rowe, 7-J Barber, 21-T Amaya, 22-R Buckrell, 53-S To'omata 175 1656-T Rowe, 7-J Barber, <strong>15</strong>-J Ross, 21-T Amaya, 53-S To'omata 120 1309-M Trueman, 21-T Amaya, 22-R Buckrell, 32-A Tisby, 53-S To'omata 67 776-T Rowe, 9-M Trueman, 21-T Amaya, 22-R Buckrell, 53-S To'omata 71 6911-M Gillan, 21-T Amaya, 22-R Buckrell, 32-A Tisby, 53-S To'omata 46 5811-M Gillan, <strong>15</strong>-J Ross, 21-T Amaya, 32-A Tisby, 53-S To'omata 56 587-J Barber, 11-M Gillan, <strong>15</strong>-J Ross, 21-T Amaya, 53-S To'omata 60 526-T Rowe, 21-T Amaya, 22-R Buckrell, 32-A Tisby, 53-S To'omata 35 437-J Barber, 9-M Trueman, <strong>15</strong>-J Ross, 21-T Amaya, 53-S To'omata 32 406-T Rowe, <strong>15</strong>-J Ross, 21-T Amaya, 32-A Tisby, 53-S To'omata 39 37Lineup Sorted by Points per Possession AllowedPts/DefPlayers Poss Poss11-M Gillan, 21-T Amaya, 22-R Buckrell, 32-A Tisby, 53-S To'omata 0.79 587-J Barber, 9-M Trueman, <strong>15</strong>-J Ross, 21-T Amaya, 53-S To'omata 0.80 406-T Rowe, 21-T Amaya, 22-R Buckrell, 32-A Tisby, 53-S To'omata 0.81 439-M Trueman, 21-T Amaya, 22-R Buckrell, 32-A Tisby, 53-S To'omata 0.87 776-T Rowe, 7-J Barber, <strong>15</strong>-J Ross, 21-T Amaya, 53-S To'omata 0.92 13011-M Gillan, <strong>15</strong>-J Ross, 21-T Amaya, 32-A Tisby, 53-S To'omata 0.97 586-T Rowe, 9-M Trueman, 21-T Amaya, 22-R Buckrell, 53-S To'omata 1.03 696-T Rowe, <strong>15</strong>-J Ross, 21-T Amaya, 32-A Tisby, 53-S To'omata 1.05 376-T Rowe, 7-J Barber, 21-T Amaya, 22-R Buckrell, 53-S To'omata 1.06 1657-J Barber, 11-M Gillan, <strong>15</strong>-J Ross, 21-T Amaya, 53-S To'omata 1.<strong>15</strong> 52Lineup Sorted by Defensive Efficiency (Stops)Def Def DefPlayers Eff Stops Poss7-J Barber, 11-M Gillan, <strong>15</strong>-J Ross, 21-T Amaya, 53-S To'omata 0.46 24 5211-M Gillan, <strong>15</strong>-J Ross, 21-T Amaya, 32-A Tisby, 53-S To'omata 0.40 23 589-M Trueman, 21-T Amaya, 22-R Buckrell, 32-A Tisby, 53-S To'omata 0.39 30 776-T Rowe, 7-J Barber, <strong>15</strong>-J Ross, 21-T Amaya, 53-S To'omata 0.38 50 1307-J Barber, 9-M Trueman, <strong>15</strong>-J Ross, 21-T Amaya, 53-S To'omata 0.38 <strong>15</strong> 406-T Rowe, 21-T Amaya, 22-R Buckrell, 32-A Tisby, 53-S To'omata 0.35 <strong>15</strong> 4311-M Gillan, 21-T Amaya, 22-R Buckrell, 32-A Tisby, 53-S To'omata 0.31 18 586-T Rowe, 7-J Barber, 21-T Amaya, 22-R Buckrell, 53-S To'omata 0.32 52 1656-T Rowe, 9-M Trueman, 21-T Amaya, 22-R Buckrell, 53-S To'omata 0.29 20 696-T Rowe, <strong>15</strong>-J Ross, 21-T Amaya, 32-A Tisby, 53-S To'omata 0.27 10 37Lineup Sorted by Percentage of Ball Handling Errors Forced% BH Oppo DefPlayers Err TO Poss6-T Rowe, 21-T Amaya, 22-R Buckrell, 32-A Tisby, 53-S To'omata 0.19 8 437-J Barber, 11-M Gillan, <strong>15</strong>-J Ross, 21-T Amaya, 53-S To'omata 0.<strong>15</strong> 8 5211-M Gillan, 21-T Amaya, 22-R Buckrell, 32-A Tisby, 53-S To'omata 0.16 9 587-J Barber, 9-M Trueman, <strong>15</strong>-J Ross, 21-T Amaya, 53-S To'omata 0.<strong>15</strong> 6 409-M Trueman, 21-T Amaya, 22-R Buckrell, 32-A Tisby, 53-S To'omata 0.12 9 776-T Rowe, 9-M Trueman, 21-T Amaya, 22-R Buckrell, 53-S To'omata 0.12 8 6911-M Gillan, <strong>15</strong>-J Ross, 21-T Amaya, 32-A Tisby, 53-S To'omata 0.10 6 586-T Rowe, 7-J Barber, <strong>15</strong>-J Ross, 21-T Amaya, 53-S To'omata 0.11 14 1306-T Rowe, 7-J Barber, 21-T Amaya, 22-R Buckrell, 53-S To'omata 0.10 16 1656-T Rowe, <strong>15</strong>-J Ross, 21-T Amaya, 32-A Tisby, 53-S To'omata 0.03 1 37
Oceanagold Nuggets Basketball - Season Statistical RankingField Goals Made Att FG% 3 Point Goals Made Att 3FG% Free Throws Made Att FT%TISBY, Antoine 53 104 51.0 ROSS, James 14 35 40.0 ASTON, Luke 4 4 100ROBINSON, Steve 5 10 50.0 TO'OMATA, Sam 34 93 36.6 ROBINSON, Steve 2 2 100TRUEMAN, Matt 19 43 44.2 BUCKRELL, Riki <strong>15</strong> 42 35.7 BARBER, John 22 29 75.9AMAYA, Tyler 135 333 40.5 AMAYA, Tyler 46 <strong>15</strong>4 29.9 GILLAN, Matt 3 4 75.0BUCKRELL, Riki 32 79 40.5 ASTON, Luke 5 17 29.4 TO'OMATA, Sam 44 59 74.6BARBER, John 53 134 39.6 BARBER, John 13 45 28.9 ROWE, Tom 11 <strong>15</strong> 73.3ROWE, Tom 28 78 35.9 GILLAN, Matt 18 67 26.9 AMAYA, Tyler 96 145 66.2ROSS, James 31 87 35.6 ROSS, James 19 31 61.3TO'OMATA, Sam 68 193 35.2 TISBY, Antoine 35 58 60.3GILLAN, Matt 34 103 33.0 BUCKRELL, Riki 7 12 58.3HEPBURN, Chris 2 7 28.6 TRUEMAN, Matt 1 8 12.5ASTON, Luke 7 26 26.9Off Rebounds Num G Avg Def Rebounds Num G Avg Total Rebounds Num G AvgROWE, Tom 28 17 1.65 AMAYA, Tyler 94 18 5.22 AMAYA, Tyler 121 18 6.72AMAYA, Tyler 27 18 1.50 BARBER, John 50 10 5.00 ROWE, Tom 70 17 4.12TISBY, Antoine 23 6 3.83 ROWE, Tom 42 17 2.47 BARBER, John 66 10 6.60TRUEMAN, Matt 20 16 1.25 TISBY, Antoine 39 6 6.50 TISBY, Antoine 62 6 10.3BARBER, John 16 10 1.60 TO'OMATA, Sam 39 18 2.17 TO'OMATA, Sam 53 18 2.94GILLAN, Matt <strong>15</strong> 18 0.83 GILLAN, Matt 37 18 2.06 GILLAN, Matt 52 18 2.89TO'OMATA, Sam 14 18 0.78 BUCKRELL, Riki 26 17 1.53 TRUEMAN, Matt 43 16 2.69BUCKRELL, Riki 10 17 0.59 TRUEMAN, Matt 23 16 1.44 BUCKRELL, Riki 36 17 2.12ASTON, Luke 9 14 0.64 ROSS, James 21 17 1.24 ROSS, James 27 17 1.59ROSS, James 6 17 0.35 ASTON, Luke <strong>15</strong> 14 1.07 ASTON, Luke 24 14 1.71ROBINSON, Steve 2 11 0.18 HEPBURN, Chris 5 7 0.71 HEPBURN, Chris 7 7 1.00HEPBURN, Chris 2 7 0.29 PARKE, Andrew 5 2 2.50 ROBINSON, Steve 6 11 0.55MILLER, Hayden 2 6 0.33 ROBINSON, Steve 4 11 0.36 PARKE, Andrew 6 2 3.00PARKE, Andrew 1 2 0.50 COUDRET, Tim 3 3 1.00 MILLER, Hayden 3 6 0.50MILLER, Hayden 1 6 0.17 COUDRET, Tim 3 3 1.00Assists Num G Avg Steals Num G Avg Scoring Num G AvgAMAYA, Tyler 73 18 4.06 AMAYA, Tyler 23 18 1.28 AMAYA, Tyler 412 18 22.9TO'OMATA, Sam 34 18 1.89 ROSS, James 17 17 1.00 TO'OMATA, Sam 214 18 11.9ROSS, James 26 17 1.53 BARBER, John <strong>15</strong> 10 1.50 BARBER, John 141 10 14.1BUCKRELL, Riki 19 17 1.12 TO'OMATA, Sam 11 18 0.61 TISBY, Antoine 141 6 23.5GILLAN, Matt 13 18 0.72 BUCKRELL, Riki 9 17 0.53 ROSS, James 95 17 5.59ROWE, Tom 10 17 0.59 TISBY, Antoine 9 6 1.50 GILLAN, Matt 89 18 4.94BARBER, John 10 10 1.00 GILLAN, Matt 6 18 0.33 BUCKRELL, Riki 86 17 5.06TRUEMAN, Matt 8 16 0.50 TRUEMAN, Matt 5 16 0.31 ROWE, Tom 67 17 3.94TISBY, Antoine 7 6 1.17 ASTON, Luke 5 14 0.36 TRUEMAN, Matt 39 16 2.44HEPBURN, Chris 3 7 0.43 ROWE, Tom 4 17 0.24 ASTON, Luke 23 14 1.64ASTON, Luke 3 14 0.21 ROBINSON, Steve 1 11 0.09 ROBINSON, Steve 12 11 1.09MILLER, Hayden 2 6 0.33 HEPBURN, Chris 1 7 0.14 HEPBURN, Chris 4 7 0.57ROBINSON, Steve 1 11 0.09McRAE, Mitch 1 2 0.50Blocks Num G Avg Turn Overs Num G Avg Fouls Off Pers TotalBARBER, John 7 10 0.70 AMAYA, Tyler 75 18 4.17 TRUEMAN, Matt 3 39 42TISBY, Antoine 4 6 0.67 TO'OMATA, Sam 62 18 3.44 ROSS, James 1 38 39ROSS, James 3 17 0.18 ROSS, James 31 17 1.82 ROWE, Tom 0 37 37AMAYA, Tyler 3 18 0.17 TISBY, Antoine 24 6 4.00 AMAYA, Tyler 6 30 36BUCKRELL, Riki 3 17 0.18 BUCKRELL, Riki 23 17 1.35 TO'OMATA, Sam 2 27 29TRUEMAN, Matt 2 16 0.13 BARBER, John 22 10 2.20 GILLAN, Matt 1 26 27ROWE, Tom 1 17 0.06 ROWE, Tom <strong>15</strong> 17 0.88 ASTON, Luke 0 23 23GILLAN, Matt 1 18 0.06 TRUEMAN, Matt 9 16 0.56 BUCKRELL, Riki 0 22 22ASTON, Luke 1 14 0.07 ASTON, Luke 8 14 0.57 TISBY, Antoine 2 <strong>15</strong> 17ROBINSON, Steve 7 11 0.64 BARBER, John 1 13 14GILLAN, Matt 6 18 0.33 HEPBURN, Chris 0 10 10MILLER, Hayden 3 6 0.50 COUDRET, Tim 0 5 5HEPBURN, Chris 1 7 0.14 ROBINSON, Steve 0 4 4PARKE, Andrew 1 2 0.50 PARKE, Andrew 0 3 3COUDRET, Tim 1 3 0.33 KITSON, Josh 0 1 1Charges Taken Num G Avg Productivity Value G Avg Def Assist Num G AvgROWE, Tom 2 17 0.12 AMAYA, Tyler 282 18 <strong>15</strong>.6ROSS, James 2 17 0.12 BARBER, John 123 10 12.3TISBY, Antoine 1 6 0.17 TISBY, Antoine 121 6 20.1PARKE, Andrew 1 2 0.50 TO'OMATA, Sam 89.0 18 4.94TO'OMATA, Sam 1 18 0.06 GILLAN, Matt 65.5 18 3.64ROWE, Tom 62.0 17 3.65BUCKRELL, Riki 61.0 17 3.59ROSS, James 35.0 17 2.06
Waikato Pistons Basketball - Season Box ScoreRecord Overall Home Away NeutralAll Games 13-4 8-0 5-4 0-0Conference 13-4 8-0 5-4 0-0Non-Conference 0-0 0-0 0-0 0-0Playoff 0-0 0-0 0-0 0-0Name G/GS FG FG% 3Pt 3Pt% FT FT% PTS Avg P/S ORB DRB TR Avg PF AST TO BS ST DA MINTony Ronaldson <strong>15</strong>/<strong>15</strong> 76/195 39.0 22/82 26.8 29/45 64.4 203 13.5 0.94 17 53 70 4.67 28 28 33 1 8 0 474Ray Cameron 17/0 18/50 36.0 4/22 18.2 8/12 66.7 48 2.82 0.86 12 28 40 2.35 33 16 <strong>15</strong> 2 17 0 213Roble Ali 4/0 0/2 0.00 0/0 0.00 0/0 0.00 0 0.00 0.00 0 1 1 0.25 1 0 2 0 0 0 9:33Hayden Allen 17/17 84/205 41.0 40/107 37.4 52/61 85.2 260 <strong>15</strong>.3 1.11 <strong>15</strong> 34 49 2.88 60 39 32 1 18 0 533Thomas Abercrombie 17/17 129/255 50.6 23/71 32.4 79/112 70.5 360 21.2 1.16 37 97 134 7.88 40 45 38 35 28 0 6<strong>15</strong>Alex Pledger 17/17 82/<strong>15</strong>4 53.2 1/1 100 31/54 57.4 196 11.5 1.08 82 132 214 12.6 49 19 43 33 9 0 427Rashad Tucker 4/4 13/29 44.8 1/2 50.0 0/6 0.00 27 6.75 0.84 12 23 35 8.75 12 11 <strong>15</strong> 2 3 0 122John Auld 4/0 0/2 0.00 0/2 0.00 0/0 0.00 0 0.00 0.00 0 0 0 0.00 2 0 2 0 1 0 5:54Kurtis Elliot 2/0 0/1 0.00 0/1 0.00 0/0 0.00 0 0.00 0.00 0 0 0 0.00 2 1 1 0 0 0 3:52Eric Devendorff 7/7 64/113 56.6 13/24 54.2 29/36 80.6 170 24.3 1.30 3 22 25 3.57 20 29 21 4 19 0 229Carl Krauser 5/5 19/38 50.0 10/16 62.5 2/4 50.0 50 10.0 1.25 5 17 22 4.40 14 16 10 0 11 0 143Gerard Bowden 17/1 30/83 36.1 16/49 32.7 22/26 84.6 98 5.76 1.02 18 27 45 2.65 28 21 28 5 9 0 297Puke Lendon 11/0 17/31 54.8 4/8 50.0 5/6 83.3 43 3.91 1.26 7 24 31 2.82 12 11 9 3 6 0 <strong>15</strong>4Mike Homik 9/0 12/31 38.7 0/0 0.00 1/4 25.0 25 2.78 0.76 13 24 37 4.11 24 12 13 5 6 0 144Josh Dix 0/0 0/0 0.00 0/0 0.00 0/0 0.00 0 0.00 0.00 0 0 0 0.00 0 0 0 0 0 0 DNPJoseph Dix 0/0 0/0 0.00 0/0 0.00 0/0 0.00 0 0.00 0.00 0 0 0 0.00 0 0 0 0 0 0 DNPDavid Gruber 2/2 9/14 64.3 0/0 0.00 4/4 100 22 11.0 1.38 3 9 12 6.00 4 4 4 4 5 0 69Dennis Tawhiti 2/0 0/0 0.00 0/0 0.00 1/2 50.0 1 0.50 1.00 1 1 2 1.00 2 0 2 1 0 0 6:35Max Williams 0/0 0/0 0.00 0/0 0.00 0/0 0.00 0 0.00 0.00 0 0 0 0.00 0 0 0 0 0 0 DNP<strong>Team</strong> 32 44 76 10 1Totals 17 553/1203 46.0 134/385 34.8 263/372 70.7 <strong>15</strong>03 88.4 1.08 257 536 793 46.6 331 252 278 96 141 0G/GS FG FG% 3Pt 3Pt% FT FT% PTS Avg P/S ORB DRB TR Avg PF AST TO BS ST DAOpponents 17 471/1<strong>15</strong>9 40.6 114/317 36.0 245/365 67.1 1301 76.5 0.97 212 444 656 38.6 314 191 276 40 140 0SHOOTING Waikato Pistons OpponentsField Goal% 46.0 40.62Pt Goal% 51.2 42.43Pt Goal% 34.8 36.0Free Throw % 70.7 67.1BALL HANDLINGAssists 252 (14.8) 191 (11.2)Turnovers 278 (16.4) 276 (16.2)Steals 141 (8.3) 140 (8.2)Def. Assists 0 (0.0) 0 (0.0)BH Error% 20.0 19.9OTHEROff. Possessions 1389 (81.7) 1390 (81.8)Pts per Possession 1.08 0.94Def. Efficiency 58.4% 52.0%REBOUNDING Waikato Pistons OpponentsTotal Rebound % 54.7 45.3Off. Rebound % 36.7 28.3Def. Rebound % 71.7 63.3Total Rebounds 793 (46.6) 656 (38.6)Off. Rebounds 257 (<strong>15</strong>.1) 212 (12.5)Def. Rebounds 536 (31.5) 444 (26.1)<strong>Team</strong> Rebounds 76 (4.5) 82 (4.8)SCORINGTotal Points <strong>15</strong>03 (88.4) 1301 (76.5)Pts off Turnovers 313 (18.4) 277 (16.3)2nd Effort Pts 227 (13.4) 167 (9.8)Pts off Bench 275 (16.2) 262 (<strong>15</strong>.4)3Pt Points 402 (23.6) 342 (20.1)Free Throw Pts 263 (<strong>15</strong>.5) 245 (14.4)Charges Taken <strong>15</strong> 18
Waikato Pistons Basketball - Season SummaryRecordDate OverallConf SiteScore Opponent High Point High Rebounder04/03/<strong>2010</strong> 1- 0 1- 0 H W 92-73 Fico Finance Nelson Giants49-E Devendorff 20-A Pledger13/03/<strong>2010</strong> 2- 0 2- 0 H W 96-78 Taranaki Mountainairs 37-T Abercrombie11-A Pledger18/03/<strong>2010</strong> 3- 0 3- 0 H W 104-74 Chrischurch Cougars 28-T Ronaldson 16-A Pledger26/03/<strong>2010</strong> 4- 0 4- 0 H W 97-64 Oceanagold Nuggets 29-E Devendorff 16-A Pledger04/04/<strong>2010</strong> 5- 0 5- 0 H W 82-79 OT0800 Easy LPG Bay Hawks22-T Abercrombie8-H Allen, A Pledger08/04/<strong>2010</strong> 6- 0 6- 0 A W 95-73 McDonalds Manawatu Jets 25-H Allen 9-T Abercrombie, A Pledger09/04/<strong>2010</strong> 6- 1 6- 1 A L 73-78 0800 Easy LPG Bay Hawks21-H Allen 12-A Pledger22/04/<strong>2010</strong> 7- 1 7- 1 H W 95-67 Harbour Heat 23-T Abercrombie17-A Pledger30/01/<strong>2010</strong> 8- 1 8- 1 H W 87-80 McDonalds Manawatu Jets 32-T Abercrombie10-T Abercrombie, A Pledger07/05/<strong>2010</strong> 9- 1 9- 1 A W 88-83 Chrischurch Cougars 31-T Abercrombie12-A Pledger08/06/<strong>2010</strong>10- 1 10- 1A W 78-71 Harbour Heat 21-T Abercrombie13-T Abercrombie14/05/<strong>2010</strong>11- 1 11- 1A W 97-72 Zerofees Southland Sharks 19-T Abercrombie12-A Pledger14/05/<strong>2010</strong>12- 1 12- 1A W 95-62 Oceanagold Nuggets 22-T Abercrombie18-A Pledger22/05/<strong>2010</strong>12- 2 12- 2A L 79-85 Taranaki Mountainairs 19-H Allen 13-A Pledger28/05/<strong>2010</strong>12- 3 12- 3A L 71-76 Fico Finance Nelson Giants24-T Abercrombie11-A Pledger29/05/<strong>2010</strong>12- 4 12- 4A L 84-103 Exodus Wellington Saints 21-T Abercrombie10-A Pledger12/07/<strong>2010</strong>13- 4 13- 4H W 90-83 OTZerofees Southland Sharks 26-T Abercrombie<strong>15</strong>-A Pledger<strong>Team</strong> Statistics SummaryOpponent FG 3 Pt FT PTS ORB DRB TR PF AST TO BS ST DAFico Finance Nelson Giants 33/73 9/22 17/22 92 24 33 57 21 8 18 4 8 0Taranaki Mountainairs 37/64 6/18 16/22 96 8 29 37 21 20 19 9 8 0Chrischurch Cougars 39/76 5/18 21/26 104 17 37 54 17 22 21 8 10 0Oceanagold Nuggets 42/81 3/20 10/<strong>15</strong> 97 20 31 51 13 16 19 6 13 00800 Easy LPG Bay Hawks 25/70 5/21 27/33 82 8 31 39 22 10 10 3 12 0McDonalds Manawatu Jets 30/67 7/22 28/34 95 13 27 40 18 14 19 6 21 00800 Easy LPG Bay Hawks 27/61 5/20 14/18 73 8 30 38 20 13 11 7 5 0Harbour Heat 38/77 8/21 11/<strong>15</strong> 95 17 40 57 16 23 14 7 7 0McDonalds Manawatu Jets 30/66 4/23 23/32 87 <strong>15</strong> 32 47 22 19 14 7 5 0Chrischurch Cougars 33/78 7/26 <strong>15</strong>/23 88 18 26 44 20 <strong>15</strong> 12 8 10 0Harbour Heat 24/65 <strong>15</strong>/32 <strong>15</strong>/23 78 17 28 45 19 13 19 6 8 0Zerofees Southland Sharks 39/70 12/28 7/13 97 17 34 51 20 6 19 5 4 0Oceanagold Nuggets 36/79 10/25 13/27 95 18 39 57 19 22 7 3 11 0Taranaki Mountainairs 27/68 10/25 <strong>15</strong>/23 79 21 29 50 27 <strong>15</strong> 25 2 8 0Fico Finance Nelson Giants 28/59 9/16 6/10 71 7 25 32 21 8 19 2 2 0Exodus Wellington Saints 31/66 10/22 12/12 84 10 25 35 24 14 16 4 3 0Zerofees Southland Sharks 34/83 9/26 13/24 90 19 40 59 17 14 16 9 6 0Individual Season Highs<strong>Team</strong> Season HighsMost Pts: 49 E Devendorff vs. Fico Finance Nelson Giants Most Pts: 104 vs. Chrischurch CougarsMost Fgm: 17 E Devendorff vs. Fico Finance Nelson Giants Most Fgm: 42 vs. Oceanagold NuggetsMost Fga: 26 E Devendorff vs. Fico Finance Nelson Giants Most Fga: 83 vs. Zerofees Southland SharksMost 3pm: 7 E Devendorff vs. Fico Finance Nelson Giants Most 3pm: <strong>15</strong> vs. Harbour HeatMost 3pa: 11 T Ronaldson vs. Zerofees Southland Sharks Most 3pa: 32 vs. Harbour HeatMost Ftm: 10 T Abercrombie vs. McDonalds Manawatu Jets Most Ftm: 28 vs. McDonalds Manawatu JetsMost Fta: 13 T Abercrombie vs. Harbour HeatMost Fta: 34 vs. McDonalds Manawatu JetsMost Reb: 20 A Pledger vs. Fico Finance Nelson Giants Most Reb: 59 vs. Zerofees Southland SharksMost Orb: 9 A Pledger vs. Fico Finance Nelson Giants Most Orb: 24 vs. Fico Finance Nelson GiantsMost Drb: 14 A Pledger vs. Harbour HeatMost Drb: 40 vs. Harbour HeatMost Ast: 9 E Devendorff vs. Chrischurch Cougars Most Ast: 23 vs. Harbour HeatMost Stl: 6 R Cameron vs. McDonalds Manawatu Jets Most Stl: 21 vs. McDonalds Manawatu JetsMost Blk: 6 A Pledger vs. Chrischurch CougarsMost Blk: 9 vs. Taranaki Mountainairs
CyberSports for Basketball - Offensive Lineup Combination AnalysisWaikato PistonsMost Often Used Lineup: 4-T Ronaldson, 9-H Allen, 10-T Abercrombie, 11-A Pledger, 23-E DevendorffMost Productive Offensive Lineup: 4-T Ronaldson, 9-H Allen, 10-T Abercrombie, 11-A Pledger, 23-E DevendorffMost Productive Rebounding Lineup: 4-T Ronaldson, 10-T Abercrombie, 11-A Pledger, 23-E Devendorff, 25-G BowdenBest Defensive Combination: 4-T Ronaldson, 10-T Abercrombie, 11-A Pledger, 23-E Devendorff, 25-G BowdenBest Lineup to Force Turnovers: 4-T Ronaldson, 6-R Cameron, 9-H Allen, 10-T Abercrombie, 25-G BowdenBest Overall Lineup:4-T Ronaldson, 9-H Allen, 10-T Abercrombie, 11-A Pledger, 25-G BowdenBest Free Throw Shooting Lineup: 9-H Allen, 10-T Abercrombie, 25-G Bowden, 33-P Lendon, 35-D GruberLineups Sorted by Playing TimePlayers Time Pts4-T Ronaldson, 9-H Allen, 10-T Abercrombie, 11-A Pledger, 23-E Devendorff 75.43 +414-T Ronaldson, 9-H Allen, 10-T Abercrombie, 11-A Pledger, 23-C Krauser 41.80 +284-T Ronaldson, 9-H Allen, 10-T Abercrombie, 11-A Pledger, 12-R Tucker 39.65 -64-T Ronaldson, 6-R Cameron, 9-H Allen, 10-T Abercrombie, 25-G Bowden 36.88 +199-H Allen, 10-T Abercrombie, 11-A Pledger, 23-E Devendorff, 35-D Gruber 34.93 +274-T Ronaldson, 9-H Allen, 10-T Abercrombie, 11-A Pledger, 25-G Bowden 34.62 +174-T Ronaldson, 10-T Abercrombie, 11-A Pledger, 23-E Devendorff, 25-G Bowden 25.93 +234-T Ronaldson, 9-H Allen, 10-T Abercrombie, 23-C Krauser, 40-M Homik 17.20 +04-T Ronaldson, 9-H Allen, 10-T Abercrombie, 11-A Pledger, 33-P Lendon 12.32 +26-R Cameron, 9-H Allen, 10-T Abercrombie, 11-A Pledger, 25-G Bowden 11.97 -4Lineups Sorted by Points per MinutePlayers PPM Norm Pts Time4-T Ronaldson, 10-T Abercrombie, 11-A Pledger, 23-E Devendorff, 25-G Bowden +0.89 +35.48 +23 25.939-H Allen, 10-T Abercrombie, 11-A Pledger, 23-E Devendorff, 35-D Gruber +0.77 +30.92 +27 34.934-T Ronaldson, 9-H Allen, 10-T Abercrombie, 11-A Pledger, 23-C Krauser +0.67 +26.79 +28 41.804-T Ronaldson, 9-H Allen, 10-T Abercrombie, 11-A Pledger, 23-E Devendorff +0.54 +21.74 +41 75.434-T Ronaldson, 6-R Cameron, 9-H Allen, 10-T Abercrombie, 25-G Bowden +0.52 +20.61 +19 36.884-T Ronaldson, 9-H Allen, 10-T Abercrombie, 11-A Pledger, 25-G Bowden +0.49 +19.64 +17 34.624-T Ronaldson, 9-H Allen, 10-T Abercrombie, 11-A Pledger, 33-P Lendon +0.16 +6.50 +2 12.324-T Ronaldson, 9-H Allen, 10-T Abercrombie, 23-C Krauser, 40-M Homik +0.00 +0.00 +0 17.204-T Ronaldson, 9-H Allen, 10-T Abercrombie, 11-A Pledger, 12-R Tucker -0.<strong>15</strong> -6.05 -6 39.656-R Cameron, 9-H Allen, 10-T Abercrombie, 11-A Pledger, 25-G Bowden -0.33 -13.37 -4 11.97Lineups Sorted by Rebounds per MinutePlayers RPM Norm Reb Time4-T Ronaldson, 10-T Abercrombie, 11-A Pledger, 23-E Devendorff, 25-G Bowden +0.66 +26.22 +17 25.934-T Ronaldson, 9-H Allen, 10-T Abercrombie, 11-A Pledger, 33-P Lendon +0.49 +19.49 +6 12.324-T Ronaldson, 9-H Allen, 10-T Abercrombie, 11-A Pledger, 12-R Tucker +0.45 +18.16 +18 39.656-R Cameron, 9-H Allen, 10-T Abercrombie, 11-A Pledger, 25-G Bowden +0.42 +16.71 +5 11.974-T Ronaldson, 9-H Allen, 10-T Abercrombie, 11-A Pledger, 25-G Bowden +0.40 +16.18 +14 34.624-T Ronaldson, 9-H Allen, 10-T Abercrombie, 11-A Pledger, 23-C Krauser +0.38 +<strong>15</strong>.31 +16 41.804-T Ronaldson, 9-H Allen, 10-T Abercrombie, 11-A Pledger, 23-E Devendorff +0.33 +13.26 +25 75.434-T Ronaldson, 9-H Allen, 10-T Abercrombie, 23-C Krauser, 40-M Homik +0.17 +6.98 +3 17.204-T Ronaldson, 6-R Cameron, 9-H Allen, 10-T Abercrombie, 25-G Bowden +0.11 +4.34 +4 36.889-H Allen, 10-T Abercrombie, 11-A Pledger, 23-E Devendorff, 35-D Gruber +0.09 +3.44 +3 34.93Total time captured in lineups: 330.73Productive scoring minutes: 261.92Productive rebounding minutes: 330.73Productive scoring percentage: 79.19%Productive rebounding percentage: 100.00%
CyberSports for Basketball - Defensive Lineup Combination AnalysisWaikato PistonsLineup Sorted by Defensive PossessionsOppoDefPlayers Pts Poss4-T Ronaldson, 9-H Allen, 10-T Abercrombie, 11-A Pledger, 23-E Devendorff 136 1824-T Ronaldson, 9-H Allen, 10-T Abercrombie, 11-A Pledger, 23-C Krauser 76 1094-T Ronaldson, 9-H Allen, 10-T Abercrombie, 11-A Pledger, 12-R Tucker 81 964-T Ronaldson, 6-R Cameron, 9-H Allen, 10-T Abercrombie, 25-G Bowden 64 949-H Allen, 10-T Abercrombie, 11-A Pledger, 23-E Devendorff, 35-D Gruber 56 924-T Ronaldson, 9-H Allen, 10-T Abercrombie, 11-A Pledger, 25-G Bowden 64 804-T Ronaldson, 10-T Abercrombie, 11-A Pledger, 23-E Devendorff, 25-G Bowden 40 714-T Ronaldson, 9-H Allen, 10-T Abercrombie, 23-C Krauser, 40-M Homik 33 506-R Cameron, 9-H Allen, 10-T Abercrombie, 11-A Pledger, 25-G Bowden 32 344-T Ronaldson, 9-H Allen, 10-T Abercrombie, 25-G Bowden, 40-M Homik 29 34Lineup Sorted by Points per Possession AllowedPts/DefPlayers Poss Poss4-T Ronaldson, 10-T Abercrombie, 11-A Pledger, 23-E Devendorff, 25-G Bowden 0.56 719-H Allen, 10-T Abercrombie, 11-A Pledger, 23-E Devendorff, 35-D Gruber 0.61 924-T Ronaldson, 9-H Allen, 10-T Abercrombie, 23-C Krauser, 40-M Homik 0.66 504-T Ronaldson, 6-R Cameron, 9-H Allen, 10-T Abercrombie, 25-G Bowden 0.68 944-T Ronaldson, 9-H Allen, 10-T Abercrombie, 11-A Pledger, 23-C Krauser 0.70 1094-T Ronaldson, 9-H Allen, 10-T Abercrombie, 11-A Pledger, 23-E Devendorff 0.75 1824-T Ronaldson, 9-H Allen, 10-T Abercrombie, 11-A Pledger, 25-G Bowden 0.80 804-T Ronaldson, 9-H Allen, 10-T Abercrombie, 11-A Pledger, 12-R Tucker 0.84 964-T Ronaldson, 9-H Allen, 10-T Abercrombie, 25-G Bowden, 40-M Homik 0.85 346-R Cameron, 9-H Allen, 10-T Abercrombie, 11-A Pledger, 25-G Bowden 0.94 34Lineup Sorted by Defensive Efficiency (Stops)Def Def DefPlayers Eff Stops Poss4-T Ronaldson, 10-T Abercrombie, 11-A Pledger, 23-E Devendorff, 25-G Bowden 0.54 38 714-T Ronaldson, 6-R Cameron, 9-H Allen, 10-T Abercrombie, 25-G Bowden 0.53 50 944-T Ronaldson, 9-H Allen, 10-T Abercrombie, 11-A Pledger, 25-G Bowden 0.51 41 804-T Ronaldson, 9-H Allen, 10-T Abercrombie, 11-A Pledger, 23-C Krauser 0.50 55 1094-T Ronaldson, 9-H Allen, 10-T Abercrombie, 11-A Pledger, 23-E Devendorff 0.48 88 1829-H Allen, 10-T Abercrombie, 11-A Pledger, 23-E Devendorff, 35-D Gruber 0.48 44 924-T Ronaldson, 9-H Allen, 10-T Abercrombie, 11-A Pledger, 12-R Tucker 0.47 45 964-T Ronaldson, 9-H Allen, 10-T Abercrombie, 23-C Krauser, 40-M Homik 0.42 21 504-T Ronaldson, 9-H Allen, 10-T Abercrombie, 25-G Bowden, 40-M Homik 0.35 12 346-R Cameron, 9-H Allen, 10-T Abercrombie, 11-A Pledger, 25-G Bowden 0.29 10 34Lineup Sorted by Percentage of Ball Handling Errors Forced% BH Oppo DefPlayers Err TO Poss4-T Ronaldson, 6-R Cameron, 9-H Allen, 10-T Abercrombie, 25-G Bowden 0.24 23 949-H Allen, 10-T Abercrombie, 11-A Pledger, 23-E Devendorff, 35-D Gruber 0.23 21 924-T Ronaldson, 9-H Allen, 10-T Abercrombie, 11-A Pledger, 23-C Krauser 0.17 19 1094-T Ronaldson, 9-H Allen, 10-T Abercrombie, 11-A Pledger, 23-E Devendorff 0.17 31 1824-T Ronaldson, 9-H Allen, 10-T Abercrombie, 11-A Pledger, 25-G Bowden 0.16 13 804-T Ronaldson, 9-H Allen, 10-T Abercrombie, 25-G Bowden, 40-M Homik 0.<strong>15</strong> 5 344-T Ronaldson, 10-T Abercrombie, 11-A Pledger, 23-E Devendorff, 25-G Bowden 0.14 10 714-T Ronaldson, 9-H Allen, 10-T Abercrombie, 23-C Krauser, 40-M Homik 0.14 7 504-T Ronaldson, 9-H Allen, 10-T Abercrombie, 11-A Pledger, 12-R Tucker 0.11 11 966-R Cameron, 9-H Allen, 10-T Abercrombie, 11-A Pledger, 25-G Bowden 0.09 3 34
Waikato Pistons Basketball - Season Statistical RankingField Goals Made Att FG% 3 Point Goals Made Att 3FG% Free Throws Made Att FT%GRUBER, David 9 14 64.3 PLEDGER, Alex 1 1 100 GRUBER, David 4 4 100DEVENDORFF, Eric 64 113 56.6 KRAUSER, Carl 10 16 62.5 ALLEN, Hayden 52 61 85.2LENDON, Puke 17 31 54.8 DEVENDORFF, Eric 13 24 54.2 BOWDEN, Gerard 22 26 84.6PLEDGER, Alex 82 <strong>15</strong>4 53.2 LENDON, Puke 4 8 50.0 LENDON, Puke 5 6 83.3ABERCROMBIE, Thomas 129 255 50.6 TUCKER, Rashad 1 2 50.0 DEVENDORFF, Eric 29 36 80.6KRAUSER, Carl 19 38 50.0 ALLEN, Hayden 40 107 37.4 ABERCROMBIE, Thomas 79 112 70.5TUCKER, Rashad 13 29 44.8 BOWDEN, Gerard 16 49 32.7 CAMERON, Ray 8 12 66.7ALLEN, Hayden 84 205 41.0 ABERCROMBIE, Thomas 23 71 32.4 RONALDSON, Tony 29 45 64.4RONALDSON, Tony 76 195 39.0 RONALDSON, Tony 22 82 26.8 PLEDGER, Alex 31 54 57.4HOMIK, Mike 12 31 38.7 CAMERON, Ray 4 22 18.2 KRAUSER, Carl 2 4 50.0BOWDEN, Gerard 30 83 36.1 TAWHITI, Dennis 1 2 50.0CAMERON, Ray 18 50 36.0 HOMIK, Mike 1 4 25.0Off Rebounds Num G Avg Def Rebounds Num G Avg Total Rebounds Num G AvgPLEDGER, Alex 82 17 4.82 PLEDGER, Alex 132 17 7.76 PLEDGER, Alex 214 17 12.6ABERCROMBIE, Thomas 37 17 2.18 ABERCROMBIE, Thomas 97 17 5.71 ABERCROMBIE, Thomas 134 17 7.88BOWDEN, Gerard 18 17 1.06 RONALDSON, Tony 53 <strong>15</strong> 3.53 RONALDSON, Tony 70 <strong>15</strong> 4.67RONALDSON, Tony 17 <strong>15</strong> 1.13 ALLEN, Hayden 34 17 2.00 ALLEN, Hayden 49 17 2.88ALLEN, Hayden <strong>15</strong> 17 0.88 CAMERON, Ray 28 17 1.65 BOWDEN, Gerard 45 17 2.65HOMIK, Mike 13 9 1.44 BOWDEN, Gerard 27 17 1.59 CAMERON, Ray 40 17 2.35CAMERON, Ray 12 17 0.71 LENDON, Puke 24 11 2.18 HOMIK, Mike 37 9 4.11TUCKER, Rashad 12 4 3.00 HOMIK, Mike 24 9 2.67 TUCKER, Rashad 35 4 8.75LENDON, Puke 7 11 0.64 TUCKER, Rashad 23 4 5.75 LENDON, Puke 31 11 2.82KRAUSER, Carl 5 5 1.00 DEVENDORFF, Eric 22 7 3.14 DEVENDORFF, Eric 25 7 3.57DEVENDORFF, Eric 3 7 0.43 KRAUSER, Carl 17 5 3.40 KRAUSER, Carl 22 5 4.40GRUBER, David 3 2 1.50 GRUBER, David 9 2 4.50 GRUBER, David 12 2 6.00TAWHITI, Dennis 1 2 0.50 ALI, Roble 1 4 0.25 TAWHITI, Dennis 2 2 1.00TAWHITI, Dennis 1 2 0.50 ALI, Roble 1 4 0.25Assists Num G Avg Steals Num G Avg Scoring Num G AvgABERCROMBIE, Thomas 45 17 2.65 ABERCROMBIE, Thomas 28 17 1.65 ABERCROMBIE, Thomas 360 17 21.2ALLEN, Hayden 39 17 2.29 DEVENDORFF, Eric 19 7 2.71 ALLEN, Hayden 260 17 <strong>15</strong>.3DEVENDORFF, Eric 29 7 4.14 ALLEN, Hayden 18 17 1.06 RONALDSON, Tony 203 <strong>15</strong> 13.5RONALDSON, Tony 28 <strong>15</strong> 1.87 CAMERON, Ray 17 17 1.00 PLEDGER, Alex 196 17 11.5BOWDEN, Gerard 21 17 1.24 KRAUSER, Carl 11 5 2.20 DEVENDORFF, Eric 170 7 24.3PLEDGER, Alex 19 17 1.12 PLEDGER, Alex 9 17 0.53 BOWDEN, Gerard 98 17 5.76CAMERON, Ray 16 17 0.94 BOWDEN, Gerard 9 17 0.53 KRAUSER, Carl 50 5 10.0KRAUSER, Carl 16 5 3.20 RONALDSON, Tony 8 <strong>15</strong> 0.53 CAMERON, Ray 48 17 2.82HOMIK, Mike 12 9 1.33 LENDON, Puke 6 11 0.55 LENDON, Puke 43 11 3.91TUCKER, Rashad 11 4 2.75 HOMIK, Mike 6 9 0.67 TUCKER, Rashad 27 4 6.75LENDON, Puke 11 11 1.00 GRUBER, David 5 2 2.50 HOMIK, Mike 25 9 2.78GRUBER, David 4 2 2.00 TUCKER, Rashad 3 4 0.75 GRUBER, David 22 2 11.0ELLIOT, Kurtis 1 2 0.50 AULD, John 1 4 0.25 TAWHITI, Dennis 1 2 0.50Blocks Num G Avg Turn Overs Num G Avg Fouls Off Pers TotalABERCROMBIE, Thomas 35 17 2.06 PLEDGER, Alex 43 17 2.53 ALLEN, Hayden 1 59 60PLEDGER, Alex 33 17 1.94 ABERCROMBIE, Thomas 38 17 2.24 PLEDGER, Alex 11 38 49BOWDEN, Gerard 5 17 0.29 RONALDSON, Tony 33 <strong>15</strong> 2.20 ABERCROMBIE, Thomas 0 40 40HOMIK, Mike 5 9 0.56 ALLEN, Hayden 32 17 1.88 CAMERON, Ray 4 29 33DEVENDORFF, Eric 4 7 0.57 BOWDEN, Gerard 28 17 1.65 RONALDSON, Tony 4 24 28GRUBER, David 4 2 2.00 DEVENDORFF, Eric 21 7 3.00 BOWDEN, Gerard 0 28 28LENDON, Puke 3 11 0.27 CAMERON, Ray <strong>15</strong> 17 0.88 HOMIK, Mike 2 22 24CAMERON, Ray 2 17 0.12 TUCKER, Rashad <strong>15</strong> 4 3.75 DEVENDORFF, Eric 0 20 20TUCKER, Rashad 2 4 0.50 HOMIK, Mike 13 9 1.44 KRAUSER, Carl 0 14 14RONALDSON, Tony 1 <strong>15</strong> 0.07 KRAUSER, Carl 10 5 2.00 TUCKER, Rashad 0 12 12ALLEN, Hayden 1 17 0.06 LENDON, Puke 9 11 0.82 LENDON, Puke 0 12 12TAWHITI, Dennis 1 2 0.50 GRUBER, David 4 2 2.00 GRUBER, David 0 4 4ALI, Roble 2 4 0.50 AULD, John 0 2 2AULD, John 2 4 0.50 ELLIOT, Kurtis 0 2 2TAWHITI, Dennis 2 2 1.00 TAWHITI, Dennis 0 2 2Charges Taken Num G Avg Productivity Value G Avg Def Assist Num G AvgRONALDSON, Tony 4 <strong>15</strong> 0.27 ABERCROMBIE, Thomas 387 17 22.7ABERCROMBIE, Thomas 3 17 0.18 PLEDGER, Alex 325 17 19.1DEVENDORFF, Eric 3 7 0.43 DEVENDORFF, Eric <strong>15</strong>5 7 22.1CAMERON, Ray 2 17 0.12 ALLEN, Hayden <strong>15</strong>3 17 8.97BOWDEN, Gerard 2 17 0.12 RONALDSON, Tony 123 <strong>15</strong> 8.17ALI, Roble 1 4 0.25 BOWDEN, Gerard 76.0 17 4.47LENDON, Puke 59.5 11 5.41KRAUSER, Carl 54.5 5 10.9CAMERON, Ray 45.0 17 2.65GRUBER, David 35.5 2 17.8
Exodus Wellington Saints Basketball - Season Box ScoreRecord Overall Home Away NeutralAll Games 13-4 8-1 5-3 0-0Conference 13-4 8-1 5-3 0-0Non-Conference 0-0 0-0 0-0 0-0Playoff 0-0 0-0 0-0 0-0Name G/GS FG FG% 3Pt 3Pt% FT FT% PTS Avg P/S ORB DRB TR Avg PF AST TO BS ST DA MINLindsay Tait 14/14 67/138 48.6 11/34 32.4 82/104 78.8 227 16.2 1.19 6 44 50 3.57 27 101 40 2 25 0 452Erron Maxey 16/2 87/185 47.0 21/72 29.2 23/35 65.7 218 13.6 1.08 32 72 104 6.50 35 14 19 3 17 0 367Damien Ekenasio 16/0 8/16 50.0 0/1 0.00 5/6 83.3 21 1.31 1.11 10 12 22 1.38 24 14 7 0 8 0 104Darryl Hudson 7/7 45/109 41.3 10/35 28.6 42/56 75.0 142 20.3 1.04 10 18 28 4.00 14 18 <strong>15</strong> 2 13 0 246George Le'afa <strong>15</strong>/0 6/23 26.1 0/5 0.00 5/10 50.0 17 1.13 0.61 2 16 18 1.20 16 21 17 1 2 0 105Ross Taurima 11/0 10/18 55.6 2/6 33.3 4/5 80.0 26 2.36 1.30 0 3 3 0.27 13 3 5 0 5 0 62Leon Henry 17/17 61/140 43.6 38/85 44.7 <strong>15</strong>/28 53.6 175 10.3 1.14 32 43 75 4.41 48 22 22 4 24 0 401Eric Devendorf 6/6 57/99 57.6 21/33 63.6 28/31 90.3 163 27.2 1.43 4 18 22 3.67 17 17 10 2 10 0 176Randall Bishop 6/0 2/7 28.6 0/2 0.00 0/0 0.00 4 0.67 0.57 0 1 1 0.17 0 1 1 0 4 0 19:42Casey Frank 17/11 74/126 58.7 11/27 40.7 24/33 72.7 183 10.8 1.29 50 86 136 8.00 49 48 49 4 18 0 486Nick Horvath 17/16 89/<strong>15</strong>7 56.7 3/19 <strong>15</strong>.8 26/33 78.8 207 12.2 1.20 45 66 111 6.53 38 14 28 <strong>15</strong> 11 0 436Troy McLean 17/12 72/<strong>15</strong>8 45.6 46/111 41.4 19/22 86.4 209 12.3 1.24 10 37 47 2.76 29 34 18 2 19 0 487Marcel Jones 4/0 14/30 46.7 0/6 0.00 3/7 42.9 31 7.75 0.94 4 7 11 2.75 2 3 0 0 5 0 52:08<strong>Team</strong> 36 37 73 4Totals 17 592/1206 49.1 163/436 37.4 276/370 74.6 1623 95.5 1.17 241 460 701 41.2 312 310 235 35 161 0G/GS FG FG% 3Pt 3Pt% FT FT% PTS Avg P/S ORB DRB TR Avg PF AST TO BS ST DAOpponents 17 494/1120 44.1 128/361 35.5 281/358 78.5 1397 82.2 1.08 204 423 627 36.9 314 223 280 40 126 0SHOOTING Exodus Wellington Saints OpponentsField Goal% 49.1 44.12Pt Goal% 55.7 48.23Pt Goal% 37.4 35.5Free Throw % 74.6 78.5BALL HANDLINGAssists 310 (18.2) 223 (13.1)Turnovers 235 (13.8) 280 (16.5)Steals 161 (9.5) 126 (7.4)Def. Assists 0 (0.0) 0 (0.0)BH Error% 17.4 20.6OTHEROff. Possessions 1353 (79.6) 1361 (80.1)Pts per Possession 1.20 1.03Def. Efficiency 54.4% 48.6%REBOUNDING Exodus Wellington Saints OpponentsTotal Rebound % 52.8 47.2Off. Rebound % 36.3 30.7Def. Rebound % 69.3 63.7Total Rebounds 701 (41.2) 627 (36.9)Off. Rebounds 241 (14.2) 204 (12.0)Def. Rebounds 460 (27.1) 423 (24.9)<strong>Team</strong> Rebounds 73 (4.3) 70 (4.1)SCORINGTotal Points 1623 (95.5) 1397 (82.2)Pts off Turnovers 335 (19.7) 235 (13.8)2nd Effort Pts 189 (11.1) 178 (10.5)Pts off Bench 378 (22.2) 276 (16.2)3Pt Points 489 (28.8) 384 (22.6)Free Throw Pts 276 (16.2) 281 (16.5)Charges Taken 11 10
Exodus Wellington Saints Basketball - Season SummaryRecordDate Overall Conf Site Score Opponent High Point High Rebounder06/03/<strong>2010</strong> 1- 0 1- 0 A W 1<strong>15</strong>-81 McDonalds Manawatu Jets 29-N Horvarth 11-D Hudson11/03/<strong>2010</strong> 2- 0 2- 0 A W 85-72 Chrischurch Cougars 33-D Hudson 16-N Horvarth13/03//<strong>2010</strong> 2- 1 2- 1 A L 86-92 Fico Finance Nelson Giants 25-E Maxey 9-C Frank19/03/<strong>2010</strong> 2- 2 2- 2 A L 95-1<strong>15</strong> Harbour Heat 19-D Hudson 9-N Horvarth25/03/<strong>2010</strong> 3- 2 3- 2 H W 114-70 Zerofees Southland Sharks 22-D Hudson 10-E Maxey01/04/<strong>2010</strong> 3- 3 3- 3 A L 72-92 0800 Easy LPG Bay Hawks 23-E Maxey 8-E Maxey09/04/<strong>2010</strong> 4- 3 4- 3 H W 98-71 Taranaki Mountainairs 25-L Tait 13-E Maxey16/04/<strong>2010</strong> 5- 3 5- 3 H W 97-73 Chrischurch Cougars 31-E Devendorf 10-E Devendorf29/04/<strong>2010</strong> 6- 3 6- 3 H W 126-90 Harbour Heat 38-E Devendorf 10-C Frank07/05/<strong>2010</strong> 7- 3 7- 3 A W 94-80 Oceanagold Nuggets 31-E Devendorf 9-N Horvath08/06/<strong>2010</strong> 8- 3 8- 3 A W 81-69 Zerofees Southland Sharks 23-E Devendorf 9-N Horvath13/05/<strong>2010</strong> 9- 3 9- 3 H W 103-91 0800 Easy LPG Bay Hawks 36-E Devendorf 8-C Frank21/05/<strong>2010</strong> 9- 4 9- 4 H L 65-80 Fico Finance Nelson Giants 14-C Frank 10-C Frank29/05/<strong>2010</strong> 10- 4 10- 4 H W 103-84 Waikato Pistons 27-T McLean 8-E Maxey27/05/<strong>2010</strong> 11- 4 11- 4 A W 84-73 Taranaki Mountainairs 25-L Tait 14-C Frank04/06/<strong>2010</strong> 12- 4 12- 4 H W 103-99 Oceanagold Nuggets 24-L Tait 8-E Maxey11/06/<strong>2010</strong> 13- 4 13- 4 H W 102-65 McDonalds Manawatu Jets 19-M Jones 8-E Maxey, C Frank<strong>Team</strong> Statistics SummaryOpponent FG 3 Pt FT PTS ORB DRB TR PF AST TO BS ST DAMcDonalds Manawatu Jets 40/76 14/37 21/29 1<strong>15</strong> 16 28 44 14 16 13 2 16 0Chrischurch Cougars 30/63 8/18 17/30 85 <strong>15</strong> 35 50 18 17 18 4 6 0Fico Finance Nelson Giants 32/78 10/35 12/16 86 18 25 43 23 <strong>15</strong> 12 2 3 0Harbour Heat 35/79 12/24 13/16 95 <strong>15</strong> 21 36 20 21 <strong>15</strong> 1 5 0Zerofees Southland Sharks 41/78 14/31 18/22 114 17 31 48 21 19 16 1 18 00800 Easy LPG Bay Hawks 22/59 4/22 24/31 72 9 30 39 20 14 14 2 8 0Taranaki Mountainairs 32/66 11/25 23/28 98 16 27 43 19 13 16 3 12 0Chrischurch Cougars 34/68 13/28 16/19 97 7 36 43 23 20 14 4 10 0Harbour Heat 52/79 16/27 6/9 126 10 22 32 17 26 8 6 9 0Oceanagold Nuggets 37/75 11/31 9/13 94 16 29 45 16 27 18 0 9 0Zerofees Southland Sharks 31/66 3/12 16/23 81 13 28 41 22 4 16 2 9 00800 Easy LPG Bay Hawks 38/68 4/<strong>15</strong> 23/26 103 16 23 39 22 23 11 1 6 0Fico Finance Nelson Giants 26/61 6/20 7/10 65 11 21 32 14 17 <strong>15</strong> 0 5 0Waikato Pistons 35/68 12/28 21/30 103 13 25 38 18 24 14 4 11 0Taranaki Mountainairs 28/68 8/27 20/25 84 <strong>15</strong> 31 46 13 10 12 1 8 0Oceanagold Nuggets 41/81 10/35 11/13 103 18 20 38 20 24 12 0 14 0McDonalds Manawatu Jets 38/73 7/21 19/30 102 16 28 44 16 20 11 2 12 0Individual Season Highs<strong>Team</strong> Season HighsMost Pts: 38 E Devendorf vs. Harbour HeatMost Pts: 126 vs. Harbour HeatMost Fgm: <strong>15</strong> E Devendorf vs. Harbour HeatMost Fgm: 52 vs. Harbour HeatMost Fga: 24 E Devendorf vs. 0800 Easy LPG Bay Hawks Most Fga: 81 vs. Oceanagold NuggetsMost 3pm: 7 Multiple PlayersMost 3pm: 16 vs. Harbour HeatMost 3pa: 14 E Devendorf vs. Oceanagold Nuggets Most 3pa: 37 vs. McDonalds Manawatu JetsMost Ftm: 14 L Tait vs. Taranaki MountainairsMost Ftm: 24 vs. 0800 Easy LPG Bay HawksMost Fta: 17 Multiple PlayersMost Fta: 31 vs. 0800 Easy LPG Bay HawksMost Reb: 16 N Horvath vs. Chrischurch Cougars Most Reb: 45 vs. Chrischurch CougarsMost Orb: 8 N Horvath vs. Chrischurch Cougars Most Orb: 18 vs. Fico Finance Nelson GiantsMost Drb: 10 E Devendorf vs. Chrischurch Cougars Most Drb: 36 vs. Chrischurch CougarsMost Ast: 16 L Tait vs. Oceanagold NuggetsMost Ast: 27 vs. Oceanagold NuggetsMost Stl: 4 Multiple PlayersMost Stl: 18 vs. Zerofees Southland SharksMost Blk: 3 N Horvath vs. Waikato PistonsMost Blk: 6 vs. Harbour Heat
CyberSports for Basketball - Offensive Lineup Combination AnalysisExodus Wellington SaintsMost Often Used Lineup: 4-L Tait, 10-L Henry, 43-C Frank, 44-N Horvath, 55-T McLeanMost Productive Offensive Lineup: 4-L Tait, 10-L Henry, 43-C Frank, 44-N Horvath, 55-T McLeanMost Productive Rebounding Lineup: 4-L Tait, 10-L Henry, 43-C Frank, 44-N Horvath, 55-T McLeanBest Defensive Combination: 8-D Hudson, 10-L Henry, 43-C Frank, 44-N Horvath, 55-T McLeanBest Lineup to Force Turnovers: 4-L Tait, 6-E Maxey, 43-C Frank, 44-N Horvath, 55-T McLeanBest Overall Lineup:4-L Tait, 6-E Maxey, 43-C Frank, 44-N Horvath, 55-T McLeanBest Free Throw Shooting Lineup: 4-L Tait, 7-D Ekenasio, <strong>15</strong>-R Taurima, 23-E Devendorf, 55-T McLeanLineups Sorted by Playing TimePlayers Time Pts4-L Tait, 10-L Henry, 43-C Frank, 44-N Horvath, 55-T McLean 43.20 +338-D Hudson, 10-L Henry, 43-C Frank, 44-N Horvath, 55-T McLean 31.22 +164-L Tait, 10-L Henry, 23-E Devendorf, 43-C Frank, 44-N Horvath 30.43 +114-L Tait, 6-E Maxey, 43-C Frank, 44-N Horvath, 55-T McLean 26.98 +254-L Tait, 6-E Maxey, 10-L Henry, 43-C Frank, 55-T McLean 23.85 -24-L Tait, 6-E Maxey, 10-L Henry, 23-E Devendorf, 43-C Frank 22.25 +204-L Tait, 10-L Henry, 23-E Devendorf, 44-N Horvath, 55-T McLean 20.88 +144-L Tait, 23-E Devendorf, 43-C Frank, 44-N Horvath, 55-T McLean 19.70 +136-E Maxey, 8-D Hudson, 10-L Henry, 44-N Horvath, 55-T McLean 18.65 -64-L Tait, 8-D Hudson, 10-L Henry, 44-N Horvath, 55-T McLean <strong>15</strong>.80 +13Lineups Sorted by Points per MinutePlayers PPM Norm Pts Time4-L Tait, 6-E Maxey, 43-C Frank, 44-N Horvath, 55-T McLean +0.93 +37.06 +25 26.984-L Tait, 6-E Maxey, 10-L Henry, 23-E Devendorf, 43-C Frank +0.90 +35.96 +20 22.254-L Tait, 8-D Hudson, 10-L Henry, 44-N Horvath, 55-T McLean +0.82 +32.91 +13 <strong>15</strong>.804-L Tait, 10-L Henry, 43-C Frank, 44-N Horvath, 55-T McLean +0.76 +30.56 +33 43.204-L Tait, 10-L Henry, 23-E Devendorf, 44-N Horvath, 55-T McLean +0.67 +26.82 +14 20.884-L Tait, 23-E Devendorf, 43-C Frank, 44-N Horvath, 55-T McLean +0.66 +26.40 +13 19.708-D Hudson, 10-L Henry, 43-C Frank, 44-N Horvath, 55-T McLean +0.51 +20.50 +16 31.224-L Tait, 10-L Henry, 23-E Devendorf, 43-C Frank, 44-N Horvath +0.36 +14.46 +11 30.434-L Tait, 6-E Maxey, 10-L Henry, 43-C Frank, 55-T McLean -0.08 -3.35 -2 23.856-E Maxey, 8-D Hudson, 10-L Henry, 44-N Horvath, 55-T McLean -0.32 -12.87 -6 18.65Lineups Sorted by Rebounds per MinutePlayers RPM Norm Reb Time4-L Tait, 10-L Henry, 43-C Frank, 44-N Horvath, 55-T McLean +0.51 +20.37 +22 43.204-L Tait, 6-E Maxey, 10-L Henry, 23-E Devendorf, 43-C Frank +0.45 +17.98 +10 22.258-D Hudson, 10-L Henry, 43-C Frank, 44-N Horvath, 55-T McLean +0.42 +16.66 +13 31.224-L Tait, 8-D Hudson, 10-L Henry, 44-N Horvath, 55-T McLean +0.32 +12.66 +5 <strong>15</strong>.804-L Tait, 6-E Maxey, 43-C Frank, 44-N Horvath, 55-T McLean +0.22 +8.89 +6 26.986-E Maxey, 8-D Hudson, 10-L Henry, 44-N Horvath, 55-T McLean +0.11 +4.29 +2 18.654-L Tait, 6-E Maxey, 10-L Henry, 43-C Frank, 55-T McLean +0.04 +1.68 +1 23.854-L Tait, 10-L Henry, 23-E Devendorf, 43-C Frank, 44-N Horvath -0.10 -3.94 -3 30.434-L Tait, 10-L Henry, 23-E Devendorf, 44-N Horvath, 55-T McLean -0.29 -11.49 -6 20.884-L Tait, 23-E Devendorf, 43-C Frank, 44-N Horvath, 55-T McLean -0.41 -16.24 -8 19.70Total time captured in lineups: 252.97Productive scoring minutes: 210.47Productive rebounding minutes: 181.95Productive scoring percentage: 83.20%Productive rebounding percentage: 71.93%
CyberSports for Basketball - Defensive Lineup Combination AnalysisExodus Wellington SaintsLineup Sorted by Defensive PossessionsOppoDefPlayers Pts Poss4-L Tait, 10-L Henry, 43-C Frank, 44-N Horvath, 55-T McLean 80 1088-D Hudson, 10-L Henry, 43-C Frank, 44-N Horvath, 55-T McLean 52 814-L Tait, 10-L Henry, 23-E Devendorf, 43-C Frank, 44-N Horvath 51 784-L Tait, 10-L Henry, 23-E Devendorf, 44-N Horvath, 55-T McLean 45 594-L Tait, 6-E Maxey, 43-C Frank, 44-N Horvath, 55-T McLean 38 584-L Tait, 6-E Maxey, 10-L Henry, 43-C Frank, 55-T McLean 51 574-L Tait, 23-E Devendorf, 43-C Frank, 44-N Horvath, 55-T McLean 45 544-L Tait, 6-E Maxey, 10-L Henry, 23-E Devendorf, 43-C Frank 44 506-E Maxey, 8-D Hudson, 10-L Henry, 44-N Horvath, 55-T McLean 43 434-L Tait, 8-D Hudson, 10-L Henry, 44-N Horvath, 55-T McLean 29 41Lineup Sorted by Points per Possession AllowedPts/DefPlayers Poss Poss8-D Hudson, 10-L Henry, 43-C Frank, 44-N Horvath, 55-T McLean 0.64 814-L Tait, 10-L Henry, 23-E Devendorf, 43-C Frank, 44-N Horvath 0.65 784-L Tait, 6-E Maxey, 43-C Frank, 44-N Horvath, 55-T McLean 0.66 584-L Tait, 8-D Hudson, 10-L Henry, 44-N Horvath, 55-T McLean 0.71 414-L Tait, 10-L Henry, 43-C Frank, 44-N Horvath, 55-T McLean 0.74 1084-L Tait, 10-L Henry, 23-E Devendorf, 44-N Horvath, 55-T McLean 0.76 594-L Tait, 23-E Devendorf, 43-C Frank, 44-N Horvath, 55-T McLean 0.83 544-L Tait, 6-E Maxey, 10-L Henry, 23-E Devendorf, 43-C Frank 0.88 504-L Tait, 6-E Maxey, 10-L Henry, 43-C Frank, 55-T McLean 0.89 576-E Maxey, 8-D Hudson, 10-L Henry, 44-N Horvath, 55-T McLean 1.00 43Lineup Sorted by Defensive Efficiency (Stops)Def Def DefPlayers Eff Stops Poss4-L Tait, 6-E Maxey, 43-C Frank, 44-N Horvath, 55-T McLean 0.50 29 588-D Hudson, 10-L Henry, 43-C Frank, 44-N Horvath, 55-T McLean 0.47 38 814-L Tait, 8-D Hudson, 10-L Henry, 44-N Horvath, 55-T McLean 0.46 19 414-L Tait, 6-E Maxey, 10-L Henry, 23-E Devendorf, 43-C Frank 0.46 23 504-L Tait, 10-L Henry, 43-C Frank, 44-N Horvath, 55-T McLean 0.44 47 1084-L Tait, 6-E Maxey, 10-L Henry, 43-C Frank, 55-T McLean 0.44 25 574-L Tait, 10-L Henry, 23-E Devendorf, 43-C Frank, 44-N Horvath 0.42 33 784-L Tait, 23-E Devendorf, 43-C Frank, 44-N Horvath, 55-T McLean 0.39 21 546-E Maxey, 8-D Hudson, 10-L Henry, 44-N Horvath, 55-T McLean 0.37 16 434-L Tait, 10-L Henry, 23-E Devendorf, 44-N Horvath, 55-T McLean 0.36 21 59Lineup Sorted by Percentage of Ball Handling Errors Forced% BH Oppo DefPlayers Err TO Poss4-L Tait, 6-E Maxey, 43-C Frank, 44-N Horvath, 55-T McLean 0.22 13 584-L Tait, 6-E Maxey, 10-L Henry, 43-C Frank, 55-T McLean 0.23 13 574-L Tait, 6-E Maxey, 10-L Henry, 23-E Devendorf, 43-C Frank 0.22 11 504-L Tait, 10-L Henry, 23-E Devendorf, 43-C Frank, 44-N Horvath 0.21 16 788-D Hudson, 10-L Henry, 43-C Frank, 44-N Horvath, 55-T McLean 0.17 14 814-L Tait, 8-D Hudson, 10-L Henry, 44-N Horvath, 55-T McLean 0.<strong>15</strong> 6 414-L Tait, 23-E Devendorf, 43-C Frank, 44-N Horvath, 55-T McLean 0.13 7 544-L Tait, 10-L Henry, 43-C Frank, 44-N Horvath, 55-T McLean 0.12 13 1086-E Maxey, 8-D Hudson, 10-L Henry, 44-N Horvath, 55-T McLean 0.09 4 434-L Tait, 10-L Henry, 23-E Devendorf, 44-N Horvath, 55-T McLean 0.08 5 59
Exodus Wellington Saints Basketball - Season Statistical RankingField Goals Made Att FG% 3 Point Goals Made Att 3FG% Free Throws Made Att FT%FRANK, Casey 74 126 58.7 DEVENDORF, Eric 21 33 63.6 DEVENDORF, Eric 28 31 90.3DEVENDORF, Eric 57 99 57.6 HENRY, Leon 38 85 44.7 McLEAN, Troy 19 22 86.4HORVATH, Nick 89 <strong>15</strong>7 56.7 McLEAN, Troy 46 111 41.4 EKENASIO, Damien 5 6 83.3TAURIMA, Ross 10 18 55.6 FRANK, Casey 11 27 40.7 TAURIMA, Ross 4 5 80.0EKENASIO, Damien 8 16 50.0 TAURIMA, Ross 2 6 33.3 TAIT, Lindsay 82 104 78.8TAIT, Lindsay 67 138 48.6 TAIT, Lindsay 11 34 32.4 HORVATH, Nick 26 33 78.8MAXEY, Erron 87 185 47.0 MAXEY, Erron 21 72 29.2 HUDSON, Darryl 42 56 75.0JONES, Marcel 14 30 46.7 HUDSON, Darryl 10 35 28.6 FRANK, Casey 24 33 72.7McLEAN, Troy 72 <strong>15</strong>8 45.6 HORVATH, Nick 3 19 <strong>15</strong>.8 MAXEY, Erron 23 35 65.7HENRY, Leon 61 140 43.6 HENRY, Leon <strong>15</strong> 28 53.6HUDSON, Darryl 45 109 41.3 LE'AFA, George 5 10 50.0BISHOP, Randall 2 7 28.6 JONES, Marcel 3 7 42.9LE'AFA, George 6 23 26.1Off Rebounds Num G Avg Def Rebounds Num G Avg Total Rebounds Num G AvgFRANK, Casey 50 17 2.94 FRANK, Casey 86 17 5.06 FRANK, Casey 136 17 8.00HORVATH, Nick 45 17 2.65 MAXEY, Erron 72 16 4.50 HORVATH, Nick 111 17 6.53MAXEY, Erron 32 16 2.00 HORVATH, Nick 66 17 3.88 MAXEY, Erron 104 16 6.50HENRY, Leon 32 17 1.88 TAIT, Lindsay 44 14 3.14 HENRY, Leon 75 17 4.41EKENASIO, Damien 10 16 0.63 HENRY, Leon 43 17 2.53 TAIT, Lindsay 50 14 3.57HUDSON, Darryl 10 7 1.43 McLEAN, Troy 37 17 2.18 McLEAN, Troy 47 17 2.76McLEAN, Troy 10 17 0.59 HUDSON, Darryl 18 7 2.57 HUDSON, Darryl 28 7 4.00TAIT, Lindsay 6 14 0.43 DEVENDORF, Eric 18 6 3.00 EKENASIO, Damien 22 16 1.38DEVENDORF, Eric 4 6 0.67 LE'AFA, George 16 <strong>15</strong> 1.07 DEVENDORF, Eric 22 6 3.67JONES, Marcel 4 4 1.00 EKENASIO, Damien 12 16 0.75 LE'AFA, George 18 <strong>15</strong> 1.20LE'AFA, George 2 <strong>15</strong> 0.13 JONES, Marcel 7 4 1.75 JONES, Marcel 11 4 2.75TAURIMA, Ross 3 11 0.27 TAURIMA, Ross 3 11 0.27BISHOP, Randall 1 6 0.17 BISHOP, Randall 1 6 0.17Assists Num G Avg Steals Num G Avg Scoring Num G AvgTAIT, Lindsay 101 14 7.21 TAIT, Lindsay 25 14 1.79 TAIT, Lindsay 227 14 16.2FRANK, Casey 48 17 2.82 HENRY, Leon 24 17 1.41 MAXEY, Erron 218 16 13.6McLEAN, Troy 34 17 2.00 McLEAN, Troy 19 17 1.12 McLEAN, Troy 209 17 12.3HENRY, Leon 22 17 1.29 FRANK, Casey 18 17 1.06 HORVATH, Nick 207 17 12.2LE'AFA, George 21 <strong>15</strong> 1.40 MAXEY, Erron 17 16 1.06 FRANK, Casey 183 17 10.8HUDSON, Darryl 18 7 2.57 HUDSON, Darryl 13 7 1.86 HENRY, Leon 175 17 10.3DEVENDORF, Eric 17 6 2.83 HORVATH, Nick 11 17 0.65 DEVENDORF, Eric 163 6 27.2MAXEY, Erron 14 16 0.88 DEVENDORF, Eric 10 6 1.67 HUDSON, Darryl 142 7 20.3EKENASIO, Damien 14 16 0.88 EKENASIO, Damien 8 16 0.50 JONES, Marcel 31 4 7.75HORVATH, Nick 14 17 0.82 TAURIMA, Ross 5 11 0.45 TAURIMA, Ross 26 11 2.36TAURIMA, Ross 3 11 0.27 JONES, Marcel 5 4 1.25 EKENASIO, Damien 21 16 1.31JONES, Marcel 3 4 0.75 BISHOP, Randall 4 6 0.67 LE'AFA, George 17 <strong>15</strong> 1.13BISHOP, Randall 1 6 0.17 LE'AFA, George 2 <strong>15</strong> 0.13 BISHOP, Randall 4 6 0.67Blocks Num G Avg Turn Overs Num G Avg Fouls Off Pers TotalHORVATH, Nick <strong>15</strong> 17 0.88 FRANK, Casey 49 17 2.88 FRANK, Casey 4 45 49HENRY, Leon 4 17 0.24 TAIT, Lindsay 40 14 2.86 HENRY, Leon 2 46 48FRANK, Casey 4 17 0.24 HORVATH, Nick 28 17 1.65 HORVATH, Nick 3 35 38MAXEY, Erron 3 16 0.19 HENRY, Leon 22 17 1.29 MAXEY, Erron 1 34 35TAIT, Lindsay 2 14 0.14 MAXEY, Erron 19 16 1.19 McLEAN, Troy 0 29 29HUDSON, Darryl 2 7 0.29 McLEAN, Troy 18 17 1.06 TAIT, Lindsay 4 23 27DEVENDORF, Eric 2 6 0.33 LE'AFA, George 17 <strong>15</strong> 1.13 EKENASIO, Damien 2 22 24McLEAN, Troy 2 17 0.12 HUDSON, Darryl <strong>15</strong> 7 2.14 DEVENDORF, Eric 1 16 17LE'AFA, George 1 <strong>15</strong> 0.07 DEVENDORF, Eric 10 6 1.67 LE'AFA, George 0 16 16EKENASIO, Damien 7 16 0.44 HUDSON, Darryl 0 14 14TAURIMA, Ross 5 11 0.45 TAURIMA, Ross 1 12 13BISHOP, Randall 1 6 0.17 JONES, Marcel 0 2 2Charges Taken Num G Avg Productivity Value G Avg Def Assist Num G AvgFRANK, Casey 5 17 0.29 FRANK, Casey 260 17 <strong>15</strong>.3EKENASIO, Damien 3 16 0.19 TAIT, Lindsay 248 14 17.7DEVENDORF, Eric 1 6 0.17 HORVATH, Nick 238 17 14.0McLEAN, Troy 1 17 0.06 MAXEY, Erron 208 16 13.0McLEAN, Troy 181 17 10.6HENRY, Leon <strong>15</strong>2 17 8.94DEVENDORF, Eric 143 6 23.8HUDSON, Darryl 101 7 14.4EKENASIO, Damien 33.0 16 2.06JONES, Marcel 30.0 4 7.50TAURIMA, Ross 10.0 11 0.91LE'AFA, George 5.00 <strong>15</strong> 0.33BISHOP, Randall 4.00 6 0.67
Zerofees Southland Sharks Basketball - Season Box ScoreRecord Overall Home Away NeutralAll Games 8-8 4-5 4-3 0-0Conference 8-8 4-5 4-3 0-0Non-Conference 0-0 0-0 0-0 0-0Playoff 0-0 0-0 0-0 0-0Name G/GS FG FG% 3Pt 3Pt% FT FT% PTS Avg P/S ORB DRB TR Avg PF AST TO BS ST DA MINMartin Iti 13/13 38/73 52.1 0/2 0.00 12/34 35.3 88 6.77 0.98 22 57 79 6.08 44 6 13 10 8 0 276Paratene McLeod 6/0 3/9 33.3 0/5 0.00 1/1 100 7 1.17 0.78 0 5 5 0.83 0 0 3 0 0 0 40:06Tavita Bower 1/0 0/1 0.00 0/0 0.00 0/0 0.00 0 0.00 0.00 0 0 0 0.00 0 0 0 0 0 0 4:19Ian Carthcart <strong>15</strong>/0 11/30 36.7 0/3 0.00 7/13 53.8 29 1.93 0.81 6 9 <strong>15</strong> 1.00 11 10 13 0 3 0 135Bubba Lauese 3/0 0/0 0.00 0/0 0.00 0/0 0.00 0 0.00 0.00 0 0 0 0.00 1 0 0 0 0 0 6:05Izaac Williams 2/0 2/4 50.0 0/1 0.00 4/4 100 8 4.00 1.33 1 0 1 0.50 0 1 2 0 2 0 11:01Luke Martin 14/14 58/121 47.9 19/52 36.5 16/23 69.6 <strong>15</strong>1 10.8 1.14 8 31 39 2.79 35 63 52 1 24 0 436Arthur Trousdell 6/2 29/52 55.8 0/2 0.00 20/29 69.0 78 13.0 1.18 9 29 38 6.33 12 3 11 6 3 0 182Gareth Dawson 16/9 54/113 47.8 0/1 0.00 16/29 55.2 124 7.75 0.98 36 56 92 5.75 38 4 35 9 6 0 4<strong>15</strong>Peter Burgess 4/0 0/0 0.00 0/0 0.00 0/0 0.00 0 0.00 0.00 0 2 2 0.50 1 0 3 0 0 0 12:26Daniel Munday 16/3 32/97 33.0 20/73 27.4 12/14 85.7 96 6.00 0.92 2 20 22 1.38 13 13 16 1 9 0 300James Paringatai 16/8 48/104 46.2 3/8 37.5 25/40 62.5 124 7.75 1.00 16 43 59 3.69 30 13 34 3 4 0 324Mike Helms 8/8 63/147 42.9 17/59 28.8 35/45 77.8 178 22.3 1.05 10 29 39 4.88 14 21 31 1 20 0 276Mike Rose 7/7 51/124 41.1 24/57 42.1 34/46 73.9 160 22.9 1.09 10 36 46 6.57 11 <strong>15</strong> 17 4 19 0 271Rene Rougeau 16/16 103/205 50.2 8/28 28.6 49/68 72.1 263 16.4 1.10 34 95 129 8.06 47 32 38 20 66 0 552Andrew Wheeler 3/0 0/1 0.00 0/1 0.00 0/0 0.00 0 0.00 0.00 0 0 0 0.00 0 0 0 0 0 0 5:30<strong>Team</strong> 36 50 86 8 7Totals 16 492/1081 45.5 91/292 31.2 231/346 66.8 1306 81.6 1.04 190 462 652 40.8 257 181 276 55 171 0G/GS FG FG% 3Pt 3Pt% FT FT% PTS Avg P/S ORB DRB TR Avg PF AST TO BS ST DAOpponents 16 501/1168 42.9 128/380 33.7 203/318 63.8 1333 83.3 1.00 254 459 713 44.6 280 182 271 50 127 0SHOOTING Zerofees Southland Sharks OpponentsField Goal% 45.5 42.92Pt Goal% 50.8 47.33Pt Goal% 31.2 33.7Free Throw % 66.8 63.8BALL HANDLINGAssists 181 (11.3) 182 (11.4)Turnovers 276 (17.3) 271 (16.9)Steals 171 (10.7) 127 (7.9)Def. Assists 0 (0.0) 0 (0.0)BH Error% 20.9 20.4OTHEROff. Possessions 1319 (82.4) 1329 (83.1)Pts per Possession 0.99 1.00Def. Efficiency 55.2% 55.7%REBOUNDING Zerofees Southland Sharks OpponentsTotal Rebound % 47.8 52.2Off. Rebound % 29.3 35.5Def. Rebound % 64.5 70.7Total Rebounds 652 (40.8) 713 (44.6)Off. Rebounds 190 (11.9) 254 (<strong>15</strong>.9)Def. Rebounds 462 (28.9) 459 (28.7)<strong>Team</strong> Rebounds 86 (5.4) 84 (5.3)SCORINGTotal Points 1306 (81.6) 1333 (83.3)Pts off Turnovers 313 (19.6) 291 (18.2)2nd Effort Pts 147 (9.2) 197 (12.3)Pts off Bench 278 (17.4) 270 (16.9)3Pt Points 273 (17.1) 384 (24.0)Free Throw Pts 231 (14.4) 203 (12.7)Charges Taken 7 12
Zerofees Southland Sharks Basketball - Season SummaryRecordDate OverallConfSiteScore Opponent High Point High Rebounder06/03/<strong>2010</strong> 0- 1 0- 1H L 90-105 OT0800 Easy LPG Bay Hawks29-M Rose 10-J Paringatai14/03/<strong>2010</strong> 0- 2 0- 2A L 82-96 Harbour Heat 21-M Rose 7-M Rose19/03/<strong>2010</strong> 1- 2 1- 2A W 85-79 0800 Easy LPG Bay Hawks20-R Rougeau 11-M Rose25/03/<strong>2010</strong> 1- 3 1- 3A L 70-114 Exodus Wellington Saints 23-M Rose 8-J Paringatai26/03/<strong>2010</strong> 2- 3 2- 3A W 79-75 Chrischurch Cougars 20-M Rose 13-M Iti01/04/<strong>2010</strong> 2- 4 2- 4H L 81-82 Taranaki Mountainairs 24-M Rose 7-M Iti03/04/<strong>2010</strong> 3- 4 3- 4H W 85-79 Chrischurch Cougars 24-M Rose 7-G Dawson, M Ros09/04/<strong>2010</strong> 3- 5 3- 5H L 72-74 Fico Finance Nelson Giants19-J Paringatai, R Rougeau11-R Rougeau17/04/<strong>2010</strong> 4- 5 4- 5A W 82-76 Oceanagold Nuggets 24-R Rougeau 13-R Rougeau24/04/<strong>2010</strong> 5- 5 5- 5H W 80-63 Oceanagold Nuggets 24-M Helms 11-R Rougeau08/06/<strong>2010</strong> 5- 6 5- 6H L 69-81 Exodus Wellington Saints 25-M Helms 9-G Dawson14/05/<strong>2010</strong> 5- 7 5- 7H L 72-97 Waikato Pistons 22-L Martin 6-M Iti21/05/<strong>2010</strong> 6- 7 6- 7H W 89-59 McDonalds Manawatu Jets 25-R Rougeau 10-R Rougeau05/26/<strong>2010</strong> 7- 7 7- 7H W 88-79 Harbour Heat 30-M Helms 9-A Trousdell12/07/<strong>2010</strong> 7- 8 7- 8A L 83-90 OT Waikato Pistons 29-M Helms 12-R Rougeau13/06/<strong>2010</strong> 8- 8 8- 8A W 99-84 Taranaki Mountainairs 22-M Helms 10-R Rougeau<strong>Team</strong> Statistics SummaryOpponent FG 3 Pt FT PTS ORB DRB TR PF AST TO BS ST DA0800 Easy LPG Bay Hawks 34/77 5/17 17/24 90 12 36 48 22 11 16 2 7 0Harbour Heat 32/61 7/18 11/16 82 9 20 29 12 14 27 7 20 00800 Easy LPG Bay Hawks 31/63 7/18 16/21 85 7 30 37 16 16 16 6 11 0Exodus Wellington Saints 25/71 5/21 <strong>15</strong>/21 70 18 21 39 18 8 26 4 7 0Chrischurch Cougars 28/70 5/18 18/23 79 16 31 47 11 9 12 4 10 0Taranaki Mountainairs 33/64 5/17 10/23 81 11 22 33 <strong>15</strong> 8 13 2 9 0Chrischurch Cougars 30/63 9/<strong>15</strong> 16/25 85 8 33 41 <strong>15</strong> <strong>15</strong> 16 5 12 0Fico Finance Nelson Giants 32/61 1/13 7/9 72 4 33 37 17 13 18 1 7 0Oceanagold Nuggets 27/66 6/24 22/32 82 16 36 52 14 13 17 0 10 0Oceanagold Nuggets 34/72 4/21 8/16 80 14 39 53 <strong>15</strong> 13 18 4 11 0Exodus Wellington Saints 21/62 5/21 22/29 69 17 24 41 22 5 20 3 7 0Waikato Pistons 29/73 4/<strong>15</strong> 10/24 72 <strong>15</strong> 16 31 13 4 11 2 12 0McDonalds Manawatu Jets 31/66 4/<strong>15</strong> 23/29 89 11 35 46 19 9 16 4 16 0Harbour Heat 30/58 7/18 21/31 88 <strong>15</strong> 29 44 20 13 22 4 10 0Waikato Pistons 34/80 3/13 12/18 83 10 33 43 18 <strong>15</strong> 11 4 6 0Taranaki Mountainairs 41/74 14/28 3/5 99 7 24 31 13 <strong>15</strong> 17 3 16 0Individual Season Highs<strong>Team</strong> Season HighsMost Pts: 30 M Helms vs. Harbour HeatMost Pts: 99 vs. Taranaki MountainairsMost Fgm: 10 Multiple PlayersMost Fgm: 41 vs. Taranaki MountainairsMost Fga: 27 M Helms vs. Waikato Pistons Most Fga: 80 vs. Waikato PistonsMost 3pm: 5 M Rose vs. Multiple Oppo.Most 3pm: 14 vs. Taranaki MountainairsMost 3pa: 12 M Rose vs. Exodus Wellington Saints Most 3pa: 28 vs. Taranaki MountainairsMost Ftm: 10 M Rose vs. 0800 Easy LPG Bay Hawks Most Ftm: 23 vs. McDonalds Manawatu JetsMost Fta: 14 M Rose vs. 0800 Easy LPG Bay Hawks Most Fta: 32 vs. Oceanagold NuggetsMost Reb: 13 Multiple PlayersMost Reb: 53 vs. Oceanagold NuggetsMost Orb: 5 Multiple PlayersMost Orb: 18 vs. Exodus Wellington SaintsMost Drb: 11 R Rougeau vs. Waikato Pistons Most Drb: 39 vs. Oceanagold NuggetsMost Ast: 8 L Martin vs. Harbour HeatMost Ast: 16 vs. 0800 Easy LPG Bay HawksMost Stl: 8 R Rougeau vs. Taranaki Mountainairs Most Stl: 20 vs. Harbour HeatMost Blk: 7 R Rougeau vs. Harbour Heat Most Blk: 7 vs. Harbour Heat
CyberSports for Basketball - Offensive Lineup Combination AnalysisZerofees Southland SharksMost Often Used Lineup: 23-M Helms, 4-M Iti, 10-L Martin, 12-G Dawson, 24-R RougeauMost Productive Offensive Lineup: 23-M Helms, 4-M Iti, 10-L Martin, 12-G Dawson, 24-R RougeauMost Productive Rebounding Lineup: 23-M Helms, 4-M Iti, 10-L Martin, 12-G Dawson, 24-R RougeauBest Defensive Combination: 4-M Iti, 10-L Martin, 11-A Trousdell, 23-M Helms, 24-R RougeauBest Lineup to Force Turnovers: 4-M Iti, 10-L Martin, 11-A Trousdell, 23-M Helms, 24-R RougeauBest Overall Lineup:4-M Iti, 10-L Martin, 12-G Dawson, 23-M Helms, 24-R RougeauBest Free Throw Shooting Lineup: 5-P McLeod, 9-I Williams, <strong>15</strong>-D Munday, 23-M Helms, 24-R RougeauLineups Sorted by Playing TimePlayers Time Pts23-M Helms, 4-M Iti, 10-L Martin, 12-G Dawson, 24-R Rougeau 54.22 +<strong>15</strong>23-M Helms, 10-L Martin, 11-A Trousdell, 12-G Dawson, 24-R Rougeau 54.18 +110-L Martin, 12-G Dawson, 21-J Paringatai, 23-M Rose, 24-R Rougeau 40.80 -124-M Iti, 10-L Martin, 21-J Paringatai, 23-M Rose, 24-R Rougeau 33.08 +04-M Iti, 10-L Martin, 12-G Dawson, 23-M Rose, 24-R Rougeau 28.18 -2612-G Dawson, <strong>15</strong>-D Munday, 21-J Paringatai, 23-M Rose, 24-R Rougeau 25.80 -104-M Iti, <strong>15</strong>-D Munday, 21-J Paringatai, 23-M Rose, 24-R Rougeau 21.53 -810-L Martin, 12-G Dawson, <strong>15</strong>-D Munday, 23-M Rose, 24-R Rougeau <strong>15</strong>.75 -1410-L Martin, <strong>15</strong>-D Munday, 21-J Paringatai, 23-M Rose, 24-R Rougeau 14.<strong>15</strong> +04-M Iti, 10-L Martin, 11-A Trousdell, 23-M Helms, 24-R Rougeau 13.37 +7Lineups Sorted by Points per MinutePlayers PPM Norm Pts Time4-M Iti, 10-L Martin, 11-A Trousdell, 23-M Helms, 24-R Rougeau +0.52 +20.95 +7 13.3723-M Helms, 4-M Iti, 10-L Martin, 12-G Dawson, 24-R Rougeau +0.28 +11.07 +<strong>15</strong> 54.2223-M Helms, 10-L Martin, 11-A Trousdell, 12-G Dawson, 24-R Rougeau +0.02 +0.74 +1 54.184-M Iti, 10-L Martin, 21-J Paringatai, 23-M Rose, 24-R Rougeau +0.00 +0.00 +0 33.0810-L Martin, <strong>15</strong>-D Munday, 21-J Paringatai, 23-M Rose, 24-R Rougeau +0.00 +0.00 +0 14.<strong>15</strong>10-L Martin, 12-G Dawson, 21-J Paringatai, 23-M Rose, 24-R Rougeau -0.29 -11.76 -12 40.804-M Iti, <strong>15</strong>-D Munday, 21-J Paringatai, 23-M Rose, 24-R Rougeau -0.37 -14.86 -8 21.5312-G Dawson, <strong>15</strong>-D Munday, 21-J Paringatai, 23-M Rose, 24-R Rougeau -0.39 -<strong>15</strong>.50 -10 25.8010-L Martin, 12-G Dawson, <strong>15</strong>-D Munday, 23-M Rose, 24-R Rougeau -0.89 -35.56 -14 <strong>15</strong>.754-M Iti, 10-L Martin, 12-G Dawson, 23-M Rose, 24-R Rougeau -0.92 -36.90 -26 28.18Lineups Sorted by Rebounds per MinutePlayers RPM Norm Reb Time23-M Helms, 4-M Iti, 10-L Martin, 12-G Dawson, 24-R Rougeau +0.<strong>15</strong> +5.90 +8 54.224-M Iti, <strong>15</strong>-D Munday, 21-J Paringatai, 23-M Rose, 24-R Rougeau -0.05 -1.86 -1 21.534-M Iti, 10-L Martin, 21-J Paringatai, 23-M Rose, 24-R Rougeau -0.06 -2.42 -2 33.0823-M Helms, 10-L Martin, 11-A Trousdell, 12-G Dawson, 24-R Rougeau -0.18 -7.38 -10 54.184-M Iti, 10-L Martin, 11-A Trousdell, 23-M Helms, 24-R Rougeau -0.22 -8.98 -3 13.3710-L Martin, 12-G Dawson, 21-J Paringatai, 23-M Rose, 24-R Rougeau -0.22 -8.82 -9 40.804-M Iti, 10-L Martin, 12-G Dawson, 23-M Rose, 24-R Rougeau -0.43 -17.03 -12 28.1810-L Martin, <strong>15</strong>-D Munday, 21-J Paringatai, 23-M Rose, 24-R Rougeau -0.57 -22.61 -8 14.<strong>15</strong>10-L Martin, 12-G Dawson, <strong>15</strong>-D Munday, 23-M Rose, 24-R Rougeau -0.63 -25.40 -10 <strong>15</strong>.7512-G Dawson, <strong>15</strong>-D Munday, 21-J Paringatai, 23-M Rose, 24-R Rougeau -0.81 -32.56 -21 25.80Total time captured in lineups: 301.07Productive scoring minutes: 121.77Productive rebounding minutes: 54.22Productive scoring percentage: 40.45%Productive rebounding percentage: 18.01%
CyberSports for Basketball - Defensive Lineup Combination AnalysisZerofees Southland SharksLineup Sorted by Defensive PossessionsOppoDefPlayers Pts Poss23-M Helms, 10-L Martin, 11-A Trousdell, 12-G Dawson, 24-R Rougeau 128 <strong>15</strong>623-M Helms, 4-M Iti, 10-L Martin, 12-G Dawson, 24-R Rougeau 96 14110-L Martin, 12-G Dawson, 21-J Paringatai, 23-M Rose, 24-R Rougeau 86 1104-M Iti, 10-L Martin, 21-J Paringatai, 23-M Rose, 24-R Rougeau 64 8712-G Dawson, <strong>15</strong>-D Munday, 21-J Paringatai, 23-M Rose, 24-R Rougeau 64 854-M Iti, 10-L Martin, 12-G Dawson, 23-M Rose, 24-R Rougeau 75 684-M Iti, <strong>15</strong>-D Munday, 21-J Paringatai, 23-M Rose, 24-R Rougeau 48 5410-L Martin, 12-G Dawson, <strong>15</strong>-D Munday, 23-M Rose, 24-R Rougeau 46 4910-L Martin, <strong>15</strong>-D Munday, 21-J Paringatai, 23-M Rose, 24-R Rougeau 28 424-M Iti, 10-L Martin, 11-A Trousdell, 23-M Helms, 24-R Rougeau 25 41Lineup Sorted by Points per Possession AllowedPts/DefPlayers Poss Poss4-M Iti, 10-L Martin, 11-A Trousdell, 23-M Helms, 24-R Rougeau 0.61 4110-L Martin, <strong>15</strong>-D Munday, 21-J Paringatai, 23-M Rose, 24-R Rougeau 0.67 4223-M Helms, 4-M Iti, 10-L Martin, 12-G Dawson, 24-R Rougeau 0.68 1414-M Iti, 10-L Martin, 21-J Paringatai, 23-M Rose, 24-R Rougeau 0.74 8712-G Dawson, <strong>15</strong>-D Munday, 21-J Paringatai, 23-M Rose, 24-R Rougeau 0.75 8510-L Martin, 12-G Dawson, 21-J Paringatai, 23-M Rose, 24-R Rougeau 0.78 11023-M Helms, 10-L Martin, 11-A Trousdell, 12-G Dawson, 24-R Rougeau 0.82 <strong>15</strong>64-M Iti, <strong>15</strong>-D Munday, 21-J Paringatai, 23-M Rose, 24-R Rougeau 0.89 5410-L Martin, 12-G Dawson, <strong>15</strong>-D Munday, 23-M Rose, 24-R Rougeau 0.94 494-M Iti, 10-L Martin, 12-G Dawson, 23-M Rose, 24-R Rougeau 1.10 68Lineup Sorted by Defensive Efficiency (Stops)Def Def DefPlayers Eff Stops Poss23-M Helms, 4-M Iti, 10-L Martin, 12-G Dawson, 24-R Rougeau 0.48 68 1414-M Iti, 10-L Martin, 21-J Paringatai, 23-M Rose, 24-R Rougeau 0.47 41 8710-L Martin, 12-G Dawson, 21-J Paringatai, 23-M Rose, 24-R Rougeau 0.44 48 1104-M Iti, <strong>15</strong>-D Munday, 21-J Paringatai, 23-M Rose, 24-R Rougeau 0.43 23 544-M Iti, 10-L Martin, 11-A Trousdell, 23-M Helms, 24-R Rougeau 0.41 17 4123-M Helms, 10-L Martin, 11-A Trousdell, 12-G Dawson, 24-R Rougeau 0.40 62 <strong>15</strong>610-L Martin, <strong>15</strong>-D Munday, 21-J Paringatai, 23-M Rose, 24-R Rougeau 0.36 <strong>15</strong> 4212-G Dawson, <strong>15</strong>-D Munday, 21-J Paringatai, 23-M Rose, 24-R Rougeau 0.34 29 8510-L Martin, 12-G Dawson, <strong>15</strong>-D Munday, 23-M Rose, 24-R Rougeau 0.33 16 494-M Iti, 10-L Martin, 12-G Dawson, 23-M Rose, 24-R Rougeau 0.29 20 68Lineup Sorted by Percentage of Ball Handling Errors Forced% BH Oppo DefPlayers Err TO Poss4-M Iti, 10-L Martin, 11-A Trousdell, 23-M Helms, 24-R Rougeau 0.22 9 4112-G Dawson, <strong>15</strong>-D Munday, 21-J Paringatai, 23-M Rose, 24-R Rougeau 0.19 16 8523-M Helms, 4-M Iti, 10-L Martin, 12-G Dawson, 24-R Rougeau 0.18 25 1414-M Iti, 10-L Martin, 21-J Paringatai, 23-M Rose, 24-R Rougeau 0.17 <strong>15</strong> 8723-M Helms, 10-L Martin, 11-A Trousdell, 12-G Dawson, 24-R Rougeau 0.17 27 <strong>15</strong>610-L Martin, 12-G Dawson, <strong>15</strong>-D Munday, 23-M Rose, 24-R Rougeau 0.16 8 4910-L Martin, 12-G Dawson, 21-J Paringatai, 23-M Rose, 24-R Rougeau 0.<strong>15</strong> 17 1104-M Iti, 10-L Martin, 12-G Dawson, 23-M Rose, 24-R Rougeau 0.<strong>15</strong> 10 684-M Iti, <strong>15</strong>-D Munday, 21-J Paringatai, 23-M Rose, 24-R Rougeau 0.13 7 5410-L Martin, <strong>15</strong>-D Munday, 21-J Paringatai, 23-M Rose, 24-R Rougeau 0.10 4 42
Zerofees Southland Sharks Basketball - Season Statistical RankingField Goals Made Att FG% 3 Point Goals Made Att 3FG% Free Throws Made Att FT%TROUSDELL, Arthur 29 52 55.8 ROSE, Mike 24 57 42.1 WILLIAMS, Izaac 4 4 100ITI, Martin 38 73 52.1 PARINGATAI, James 3 8 37.5 McLEOD, Paratene 1 1 100ROUGEAU, Rene 103 205 50.2 MARTIN, Luke 19 52 36.5 MUNDAY, Daniel 12 14 85.7WILLIAMS, Izaac 2 4 50.0 HELMS, Mike 17 59 28.8 HELMS, Mike 35 45 77.8MARTIN, Luke 58 121 47.9 ROUGEAU, Rene 8 28 28.6 ROSE, Mike 34 46 73.9DAWSON, Gareth 54 113 47.8 MUNDAY, Daniel 20 73 27.4 ROUGEAU, Rene 49 68 72.1PARINGATAI, James 48 104 46.2 MARTIN, Luke 16 23 69.6HELMS, Mike 63 147 42.9 TROUSDELL, Arthur 20 29 69.0ROSE, Mike 51 124 41.1 PARINGATAI, James 25 40 62.5CARTHCART, Ian 11 30 36.7 DAWSON, Gareth 16 29 55.2McLEOD, Paratene 3 9 33.3 CARTHCART, Ian 7 13 53.8MUNDAY, Daniel 32 97 33.0 ITI, Martin 12 34 35.3Off Rebounds Num G Avg Def Rebounds Num G Avg Total Rebounds Num G AvgDAWSON, Gareth 36 16 2.25 ROUGEAU, Rene 95 16 5.94 ROUGEAU, Rene 129 16 8.06ROUGEAU, Rene 34 16 2.13 ITI, Martin 57 13 4.38 DAWSON, Gareth 92 16 5.75ITI, Martin 22 13 1.69 DAWSON, Gareth 56 16 3.50 ITI, Martin 79 13 6.08PARINGATAI, James 16 16 1.00 PARINGATAI, James 43 16 2.69 PARINGATAI, James 59 16 3.69HELMS, Mike 10 8 1.25 ROSE, Mike 36 7 5.14 ROSE, Mike 46 7 6.57ROSE, Mike 10 7 1.43 MARTIN, Luke 31 14 2.21 MARTIN, Luke 39 14 2.79TROUSDELL, Arthur 9 6 1.50 TROUSDELL, Arthur 29 6 4.83 HELMS, Mike 39 8 4.88MARTIN, Luke 8 14 0.57 HELMS, Mike 29 8 3.63 TROUSDELL, Arthur 38 6 6.33CARTHCART, Ian 6 <strong>15</strong> 0.40 MUNDAY, Daniel 20 16 1.25 MUNDAY, Daniel 22 16 1.38MUNDAY, Daniel 2 16 0.13 CARTHCART, Ian 9 <strong>15</strong> 0.60 CARTHCART, Ian <strong>15</strong> <strong>15</strong> 1.00WILLIAMS, Izaac 1 2 0.50 McLEOD, Paratene 5 6 0.83 McLEOD, Paratene 5 6 0.83BURGESS, Peter 2 4 0.50 BURGESS, Peter 2 4 0.50WILLIAMS, Izaac 1 2 0.50Assists Num G Avg Steals Num G Avg Scoring Num G AvgMARTIN, Luke 63 14 4.50 ROUGEAU, Rene 66 16 4.13 ROUGEAU, Rene 263 16 16.4ROUGEAU, Rene 32 16 2.00 MARTIN, Luke 24 14 1.71 HELMS, Mike 178 8 22.3HELMS, Mike 21 8 2.63 HELMS, Mike 20 8 2.50 ROSE, Mike 160 7 22.9ROSE, Mike <strong>15</strong> 7 2.14 ROSE, Mike 19 7 2.71 MARTIN, Luke <strong>15</strong>1 14 10.8MUNDAY, Daniel 13 16 0.81 MUNDAY, Daniel 9 16 0.56 DAWSON, Gareth 124 16 7.75PARINGATAI, James 13 16 0.81 ITI, Martin 8 13 0.62 PARINGATAI, James 124 16 7.75CARTHCART, Ian 10 <strong>15</strong> 0.67 DAWSON, Gareth 6 16 0.38 MUNDAY, Daniel 96 16 6.00ITI, Martin 6 13 0.46 PARINGATAI, James 4 16 0.25 ITI, Martin 88 13 6.77DAWSON, Gareth 4 16 0.25 CARTHCART, Ian 3 <strong>15</strong> 0.20 TROUSDELL, Arthur 78 6 13.0TROUSDELL, Arthur 3 6 0.50 TROUSDELL, Arthur 3 6 0.50 CARTHCART, Ian 29 <strong>15</strong> 1.93WILLIAMS, Izaac 1 2 0.50 WILLIAMS, Izaac 2 2 1.00 WILLIAMS, Izaac 8 2 4.00McLEOD, Paratene 7 6 1.17Blocks Num G Avg Turn Overs Num G Avg Fouls Off Pers TotalROUGEAU, Rene 20 16 1.25 MARTIN, Luke 52 14 3.71 ROUGEAU, Rene 4 43 47ITI, Martin 10 13 0.77 ROUGEAU, Rene 38 16 2.38 ITI, Martin 2 42 44DAWSON, Gareth 9 16 0.56 DAWSON, Gareth 35 16 2.19 DAWSON, Gareth 2 36 38TROUSDELL, Arthur 6 6 1.00 PARINGATAI, James 34 16 2.13 MARTIN, Luke 1 34 35ROSE, Mike 4 7 0.57 HELMS, Mike 31 8 3.88 PARINGATAI, James 2 28 30PARINGATAI, James 3 16 0.19 ROSE, Mike 17 7 2.43 HELMS, Mike 3 11 14MARTIN, Luke 1 14 0.07 MUNDAY, Daniel 16 16 1.00 MUNDAY, Daniel 1 12 13MUNDAY, Daniel 1 16 0.06 ITI, Martin 13 13 1.00 TROUSDELL, Arthur 0 12 12HELMS, Mike 1 8 0.13 CARTHCART, Ian 13 <strong>15</strong> 0.87 ROSE, Mike 4 7 11TROUSDELL, Arthur 11 6 1.83 CARTHCART, Ian 0 11 11McLEOD, Paratene 3 6 0.50 LAUESE, Bubba 0 1 1BURGESS, Peter 3 4 0.75 BURGESS, Peter 0 1 1WILLIAMS, Izaac 2 2 1.00Charges Taken Num G Avg Productivity Value G Avg Def Assist Num G AvgROSE, Mike 2 7 0.29 ROUGEAU, Rene 323 16 20.2ROUGEAU, Rene 2 16 0.13 ROSE, Mike 138 7 19.7DAWSON, Gareth 1 16 0.06 MARTIN, Luke 125 14 8.93PARINGATAI, James 1 16 0.06 HELMS, Mike 122 8 <strong>15</strong>.3HELMS, Mike 1 8 0.13 DAWSON, Gareth 109 16 6.81ITI, Martin 88.0 13 6.77TROUSDELL, Arthur 77.5 6 12.9PARINGATAI, James 77.0 16 4.81MUNDAY, Daniel 46.0 16 2.88CARTHCART, Ian 11.0 <strong>15</strong> 0.73WILLIAMS, Izaac 8.50 2 4.25McLEOD, Paratene 3.00 6 0.50