Mean, Median, Mode and Range
Mean, Median, Mode and Range
Mean, Median, Mode and Range
- No tags were found...

Create successful ePaper yourself
Turn your PDF publications into a flip-book with our unique Google optimized e-Paper software.
Day 1Objective: Students will define <strong>and</strong> find the mean, median, mode <strong>and</strong> range of givendata.St<strong>and</strong>ards:NCTM St<strong>and</strong>ards: Number <strong>and</strong> Operations, Data AnalysisNew York State Key Ideas: 5DMaterials:student notebookscalculatorsOpening: The following question is placed on the front board for students to answer asthey come into class.If you received the following grades on your tests, what should your grade be on yourreport card <strong>and</strong> why? 75, 95, 80, <strong>and</strong> 90Main: Notes: on the overhead, vocabulary <strong>and</strong> problems, students coping <strong>and</strong> solve. Dofirst three or four examples together, then let students work on the rest of the examples bythemselves or with a partner.Closing: Have students go to the board <strong>and</strong> put their solutions on the board.H<strong>and</strong> out <strong>and</strong> discuss the Unit ProjectHomework: Unit ProjectAssessment: As students are working walk around <strong>and</strong> make sure they are on task.Student work on the board at the end of class.Teacher’s Notes: Make sure students are rounding, adding <strong>and</strong> dividing negativescorrectly for the mean. For the median check to see if students are putting numbers inorder before find the middle number.5
Day 2Objective: Students will gather data from the internet <strong>and</strong> find mean, median, mode <strong>and</strong>range from the data.St<strong>and</strong>ards:NCTM St<strong>and</strong>ards: Number <strong>and</strong> Operations, Data AnalysisNew York State Key Ideas: 5DMaterials:Computer lab, with internet accessStudent WorksheetCalculatorOpening: In what state do you think the highest temperature occurred yesterday, <strong>and</strong> inwhat state do you think the lowest temperature occur last night?Main: Have students go to the following website from the National Weather Servicehttp://iwin.nws.noaa.gov/iwin/us/tempprecip.htmlStudents will find the high <strong>and</strong> low temperatures for the past 2 days. Explain what theinformation given to them represents. Answer the opening question <strong>and</strong> give a prize tothe student who was the closest. Students will use this data to answer the questions onthe student worksheet. Assign half of the class to work with one day <strong>and</strong> the other half toanswer the question based on the other day.Closing: Have students close out of the internet <strong>and</strong> discuss their findings, based onquestion 10.Homework: page 412 9-14Unit ProjectAssessment: As students are working walk around <strong>and</strong> make sure they are on task.Teacher’s Notes: Make sure they are using the same date <strong>and</strong> looking at all of the data.Some students may have to print off the data so they can highlight the numbers they arelooking for.7
Name _______________________Weather WorksheetDateClass __________Answer the following questions. If work needs to be shown, show it below the problem.1. What is the date of your data? ______________2. What is the high temperature for Columbus, Georgia? ______, Columbus, Ohio? ____3. What is the low temperature for Peoria, Illinois? _____.4. What is the range in high temperatures between Harrisburg, Pennsylvania, Las Vegas,Nevada <strong>and</strong> Fairbanks, Alaska? ________(show work)5. What is the mean low temperatures of all cities that begin with P? _______(showwork)6. What is the mode high temperature for all cities? _______7. What is the median amount of precipitation for all cities? __________(show work)8. What is the range of high <strong>and</strong> low temperature of Nashville Tennessee? _________(show work)9. What city has the greatest range between high <strong>and</strong> low temperatures? ___________(show work)10.Based on the forecast for tomorrow what city would you like to visit? ___________8
Day 3Objective: Students will find their heights then find how they compare to the class.Students will make analyze a box <strong>and</strong> whiskers plot <strong>and</strong> find mean median mode <strong>and</strong>range of the class data.St<strong>and</strong>ards:NCTM St<strong>and</strong>ards: Number <strong>and</strong> Operations, Data Analysis, MeasurementNew York State Key Ideas: 5A, 5DMaterials:Tape measureCalculatorStudent WorksheetOpening: Students will be asked to write down some generalizations about what theybelieve to be true about the class’ height.Main: Students will work in pairs <strong>and</strong> measure their heights in centimeters. Studentswill then record the heights on the chart taped to the front board. Also students will inputtheir data into a list on the TI- 73 calculator. Chart is separated into males <strong>and</strong> females.Once everyone is finished the class will have a discussion about the tallest, shortestheight. Are there any heights that do not make sense? Students will work in pairs to findthe mean, median mode <strong>and</strong> range of the entire class data, male data <strong>and</strong> female data.Closing: We will then see if there are any patterns, or is the data what they expected todiscover. From the lists on the calculator, make a box <strong>and</strong> whiskers plot of the males <strong>and</strong>the females. See the data from the box <strong>and</strong> whiskers plot match what the students foundto be true.Homework: Unit ProjectAssessment: As students are working walk around <strong>and</strong> make sure they are on task.Teacher’s Notes: Make sure students underst<strong>and</strong> that the tape measure is not as tall asthe students <strong>and</strong> they need to add an amount to it. Having two calculators one for thefemales <strong>and</strong> one for the males to input data, may be useful not to confuse the data. Thentransfer the lists to one calculator.9
Name _____________Date__________Student MeasurementClass__________What is your height measured in centimeters? (Remember the tape measure is not as tallas you) ________________Record the class’s heights below1. What is the tallest male height?__________2. What is the shortest female height? ________3. What is the median of all heights? __________4. What is the mode of all heights? ___________5. What is the mean of the male heights? _________6. What is the mean of the female heights? __________7. What is the range of the class heights? __________Day 4Objective: Students will find the mean, median, mode, <strong>and</strong> range from graphs, tables<strong>and</strong> charts.St<strong>and</strong>ards:NCTM St<strong>and</strong>ards: Number <strong>and</strong> Operations, Data AnalysisNew York State Key Ideas: 5DMaterials:Student WorksheetCalculatorOpening: Look at the chart on the overhead <strong>and</strong> discuss what can be determine from thegraph.Main: Work on the first problem together. Students will work by themselves to finishthe student worksheet.Closing: Review the worksheet10
Homework: Unit ProjectGo through the newspaper or a magazine, find a chart or table cut it out, staple tothe homework assignment. Students need to find the mean, median, mode <strong>and</strong> range.Assessment: Student worksheet <strong>and</strong> homework.Teacher’s Notes: Students need to be aware the mode is the tallest bar on the graph, notthe height of the bar that happens most. Have a supply of newspaper or magazines forstudents that do not have any available at home.11
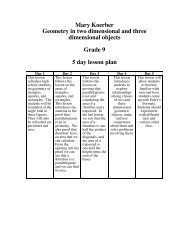
transparencyTime to get to school1098765People 432101:00- 1:30 1:31-2:00 2:01-2:30 2:31-3:00 3:01-3:30MinutesWhat can be determined by looking at this graph ?Is it appropriate to use a bar graph to show this data?12
Name _____________Graphs <strong>and</strong> DataDate__________Class__________Look at the following graph <strong>and</strong> answer the following questions.1.Favorite Colors86420red blue green purple black white1. What color is the mode? _____________2. How many people were surveyed? ________2.Test scoresfrequency65-69 370-74 575-79 280-84 885-89 1290-94 1595-100 91. How many students were tested? _____________2. What is the mean test score? ________________3. What is the median test score? _______________4. What test score is the mode? _______________3.13
Shoe Sizes64207 7.5 8 8.5 9 9.5 10Shoe sizes1. What is the range of shoe sizes? ___________2. What is the mode of show sizes? ___________3. What is the mean shoe size? _________4. What is the median shoe size? __________4.Rain fall for OctoberRain fall (inches) Days0 15.01-.25 10.26-.5 2.51-.75 2.76-1.0 11.01 - 1.25 01.26 - 1.50 0more than 1.51 11. What is the range of rain fall? _________2. What amount of rain fall is the mode? ________3. What is the mean amount of rain fall? _______4. What is the median amount of rain fall? ______14
Day 5Objective: Students will practice finding mean, median, mode <strong>and</strong> rangeSt<strong>and</strong>ards:NCTM St<strong>and</strong>ards: Number <strong>and</strong> Operations, Data AnalysisNew York State Key Ideas: 5DMaterials:Student WorksheetCalculatorOpening: Write down the definition <strong>and</strong> how to find the mean, median, mode <strong>and</strong> range.Main: Students will get in groups of four <strong>and</strong> compare the graphs they found forhomework <strong>and</strong> tell the other group members how they found the mean, median, mode<strong>and</strong> range.Students will work on Glencoe, Mathematics Course 3, Practice 4-4 worksheet. Add todirections find the range.Closing: Review the answersHomework:Unit ProjectAssessment: As students are working walk around <strong>and</strong> make sure they are on task.Teacher’s Notes: Make sure students are showing work15
Name _____________Unit ProjectDate__________Class__________During this week you must survey between 40 <strong>and</strong> 50 people. You may ask them anyquestion that will result in your ability to find the mean, median, mode <strong>and</strong> range of thedata.Some examples:shoe sizetime to get to school/worktime they wake uptime they go to bedtime to get ready in the morningageyear they were bornamount of time they watch TV per day/ weekYour data must be organized <strong>and</strong> answers labeled, showing the mean, median, mode<strong>and</strong> range.Your data should be presented in a frequency table <strong>and</strong> a graphDue next Monday16