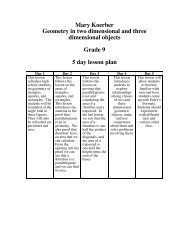
5- Day Lesson Plan Unit: Linear Equations Grade Level: Grade 9 ...
5- Day Lesson Plan Unit: Linear Equations Grade Level: Grade 9 ...
5- Day Lesson Plan Unit: Linear Equations Grade Level: Grade 9 ...
- No tags were found...

You also want an ePaper? Increase the reach of your titles
YUMPU automatically turns print PDFs into web optimized ePapers that Google loves.
<strong>Linear</strong><strong>Equations</strong>5- <strong>Day</strong> <strong>Lesson</strong> <strong>Plan</strong><strong>Unit</strong>: <strong>Linear</strong> <strong>Equations</strong><strong>Grade</strong> <strong>Level</strong>: <strong>Grade</strong> 9Time Span: 50 minute class periodsBy: Richard WeberTools:Geometer’s Sketchpad SoftwareOverhead projector with TI- 83 adapterMath BookGraph PaperTI-83 plus CalculatorsComputersCalculator-Based Ranger (CBR 2)Green Globs SoftwarePencilsPaperJournals
2<strong>Unit</strong> ObjectivesGiven a five day instruction on linear equations, the following are unit objectives:• Given instruction on how to create a table of values on the calculator from a linearequation, students will demonstrate how to make a table of values.• Given technology instruction on how to use Geometers Sketchpad, students willbe able to graph linear equations in Geometers Sketchpad.• Given a technical briefing on the TI-83 calculator, the students will be able tograph linear equations with their calculators.• Students will calculate the x and y intercepts on the graph given linear equations.• Students will create graphs and describe their slopes given instruction on theCBR.• Students will be able to find the slope of a line.• Students will be able to describe slopes with appropriate mathematicalvocabulary.• Given the TI-83 calculators, students will be able to find the slope.• Given the slope-intercept formula, the students will be able to rewrite linearequations into the slope-intercept form.• Using the Green Globs software the students will be able to write linear equations.• Given the slope and a point on the line, students will be able to write linearequations.• Given a technical briefing of the TI-83 calculator, students will be able to entersystem of equations into the calculator.• Given instruction on the matrix program of the TI-83 calculator, students will beable to solve systems of equations.• Students will be able to explore equations on the calculator by graphing the linearequations.New York State Standards
3Standard 3: Mathematics• A.PS.4 – Use multiple representations to represent and explain problemsituations.• A.CM.2 – Use mathematical representations to communicate with appropriateaccuracy, including numerical tables, formulas, function, equations, charts,graphs, Venn diagrams, and other diagrams.• A.R.3 – Use representation as a tool for exploring and understandingmathematical ideas.• A.G.9 – Solve system of linear equations graphically.• A.R.1 – Use physical objects, diagrams, charts, tables, graphs, symbols, equation,or objects created using technology as representation of mathematical concepts.• A.G.4 – Identify and graph linear functions• Given a technical briefing on the TI-83 calculator, the students will be able tograph linear equations.• A.PS.4 – Use multiple representations to represent and explain problemsituations.• A.A.33 – Determine the slope of a line, given the coordinates of two points on theline.• A.A.34 – Write the equation of a line, given its slope and the coordinates of apoint on the line.NCTM Standards• Create and use representations to organize, record, and communicatemathematical ideas.• Use Mathematical models to represent and understand quantitative relationships.• Understand patterns, relations, and functions.• Organize and consolidate their mathematical thinking through communication.• Communicate their mathematical thinking coherently and clearly to peers,teachers, and others.• Analyze and evaluate the mathematical thinking and strategies of others.• Represent and analyze mathematical situations and structures using algebraicsymbols.• Apply and adapt a variety of appropriate strategies to solve problems.Resources
4McDougal Littell, Math Course 3, by Boswell, Laurie, Kanold, Timothy, Larson, Ron,Stiff, Lee, Houghton Mifflin, Chapter 11, pages 556-582, copyright 2004.Getting Started with the CBR 2 Sonic Motion Detector, Texas Instruments, HoldenCustom Products, pages 10-13, copyright 2004http://www.purplemath.com/modules/graphlin.htm, Graphing <strong>Linear</strong> <strong>Equations</strong>,Elizabeth Stapel.Texas Instruments TI-84 Plus Silver Edition Guidebook, Texas Instruments, Banta BookGroup, pages chapter 1-2, 1-93, copyright 2004Principles and Standards for School Mathematics, National Council of Teachers ofMathematics, chapter 7, pages 286-364, copyright 2000http://www.emsc.nysed.gov, Mathematics Core Curriculum MST Standard 3, StateEducation Department, pages 89- 127, copyright 2005Materials Used Daily
5<strong>Day</strong> 1:Geometer’s SketchpadClass work worksheetPaperPencilJournals<strong>Day</strong> 2:TI-83 plus CalculatorOverhead with TI adapterInstructional worksheetPaperPencilJournals<strong>Day</strong> 3:Calculator-Based RangerTI- 83 plus CalculatorOverheard with TI-84 adapterGraph PaperWorksheet on CBRPaperPencilJournals<strong>Day</strong> 4:Green Globs programWorksheet on writing equationsPaperPencilJournals<strong>Day</strong> 5:TI-83 plus CalculatorOverhead with TI adaptorClass worksheetFind solutions worksheetPaperPencilJournals5-<strong>Day</strong> Overview
6<strong>Day</strong> 1: Graphs of <strong>Linear</strong> <strong>Equations</strong>Class discussion on what makes up a lineCreating a table of values of a linear equationPlotting points on Geometers Sketchpad to create a lineAssessment: Hand in their class work from Geometer’s Sketchpad and therejournals. Students will need to complete a worksheet on graphing linearequations.<strong>Day</strong> 2: Using InterceptsClass discussion on: What is an intercept?Exploring the TI-83 Plus calculatorFinding intercepts using the TI- 83 Plus calculator (looking at graph and table)Group work on finding interceptsFull class discussion on class workAssessment: Turn in journals and class work<strong>Day</strong> 3: Introduction to SlopeClass discussion on positive, negative and zero slopeInstruction on CBRGroup work with CBRInstruction using slope formulaAssessment: Worksheet on finding slopes of different lines and turn in journals<strong>Day</strong> 4: Writing an equation for a lineClass Discussion of equations for a lineInstructions on Green Globs programIndividually work in Green Globs with prizesAssessment: Worksheet on writing equations and turn in journals<strong>Day</strong> 5: Introduction to Solving Systems of <strong>Equations</strong>Class discussion on solving systems of equationsInstruction on solving systems of equations with TI- 83 Plus calculatorClass worksheet on solving systems of equationsGroup work on solving systems of equationsAssessment: Finding solutions to systems of equations worksheet and turn injournals<strong>Day</strong> One <strong>Lesson</strong> <strong>Plan</strong><strong>Lesson</strong> Topic: Graphs of <strong>Linear</strong> <strong>Equations</strong>
7<strong>Grade</strong> <strong>Level</strong>: 9Materials: Geometer’s Sketchpad, Worksheets, Computers, Journals<strong>Lesson</strong> Overview: Students will work with Geometer Sketchpad to develop anunderstanding of graphing linear equations..<strong>Lesson</strong> Objectives:• Students will demonstrate how to make a table of values.• Students will be able to graph linear equations in Geometers Sketchpad.New York Standards:• A.R.1 – Use physical objects, diagrams, charts, tables, graphs, symbols, equation,or objects created using technology as representation of mathematical concepts.• A.R.3 – Use representation as a tool for exploring and understandingmathematical ideas.• A.G.4 – Identify and graph linear functions• A.A.21- Determine whether a given value is a solution to a given linear equationin one variable or linear inequality in one variable.NCTM Standards:• Create and use representations to organize, record, and communicatemathematical ideas.• Use Mathematical models to represent and understand quantitative relationships.Anticipatory Set: The teacher will open the class by asking a variety of differentquestions that pertain to graphing linear equations:1. What makes up a line?2. How many points make up a line?3. If you are given a linear equation, what information would you need from theequation inorder to graph it?Possible Responses:1. A line consists of points2. 2 points make a line3. PointsDevelopmental Activity:1. The teacher will discuss with the students how to find the values of points ona linear equation by creating a table and solving for different values. Theteacher will show the students an example of a linear equation and set up atable on the overhead. Then the teacher will show the students how to find thevalues, by algebraically solving for y when placing different numbers in for x,while using the overhead. (Worksheet)
82. The teacher will give the students a worksheet, with an example on how tofind different values for y. Also on the worksheet will be many differentlinear equations for which the students will need to create a table and find afew points on that linear equation.3. The teacher will walk the students through the procedure of graphing linesfrom the tables they have created using Geometers Sketchpad. Then show thestudents how to plot points, and then find the linear equation from those pointswithin Geometers Sketchpad.4. With the worksheet on linear equations the students will find a few points foreach equation. Then each student will plot the points in Geometers Sketchpadand find the linear equation in the program. By finding the linear equationwithin Geometers Sketchpad, will be a way to check to see if they graphed theequation correctly.5. Once the students find the linear equations in Geometers Sketchpad they willprint there results.Closure: The students will write into their journals how to draw a linear equation ongraph paper without using geometers sketchpad. The students will write down how theyfelt about Geometers Sketchpad and if they were confused about anything.Assessment: The teacher will collect the worksheet and printed results of the graphsthey created in Geometers Sketchpad. The students will be given a handout which willinclude linear equations, which they will need to create a table of values and graph forhomework.WorksheetName: __________________________Date: _______________
9Given equation the equation y = 3x + 2 find at least 4 values for y by creating a tableX -4 -2 0 2Y -10 -4 2 8Just by plugging -4, -2, 0, and 2 into the equation y = 3x + 2 for x, we were able to solvefor y!Directions: Create a table of points for each linear equation. Then in GeometersSketchpad plot the points on the graph and create the linear equation.1. y = ½ x + 12. y = x – 23. y = 64. y = x + 95. y = x +106. y = 8xHomeworkName: ________________________Date: ____________
10Directions: Similar to class, create a table of values for each linear equation. With yourtable of values, DRAW the linear equation on graph paper.1. y = x + 52. y = -2x +13. y = -7x + 84. y = 65. x = 66. 9x + 3y = 187. You are taking a photography class and need a digital camera. The payment planfor the camera can be modeled by the equation C = 10m +50, where C is the totalamount paid and m is the number of months. Graph the equation and thenestimate how much you pay in 12 months.Answer Key:
1142-10 -5 5 10-21.-442-10 -5 5 10-22.-442-10 -5 5 10-2-43.86424.-2
128642-10 -5 5 105.-28642-10 -5 5 106.-280604020-100 -50 50 100 150-20-407.-60In 12 months you pay: $170. Because when x = 12 the y-value is 170.
13<strong>Day</strong> Two <strong>Lesson</strong> <strong>Plan</strong><strong>Lesson</strong> Topic: Using Intercepts<strong>Grade</strong> <strong>Level</strong>: 9Materials: TI-83 plus calculator, Overhead with calculator adaptor, InstructionWorksheet (graphing), Instruction Worksheet (finding intercepts), X-Y InterceptsWorksheet.<strong>Lesson</strong> Overview: Students will work with their calculators to develop an understandingof intercepts.<strong>Lesson</strong> Objectives:• Students will be able to graph linear equations.• Given linear equations, students will calculate the x and y intercepts on the graph.• Given linear equations, students will be able to draw conclusions about linearequations and their intercepts.• A.A.21- Determine whether a given value is a solution to a given linear equationin one variable or linear inequality in one variable.New York Standard:• A.CM.1 – Communicate verbally and in writing a correct, complete, coherent,and clear design and explanation for the steps used in solving a problem.• A.CM.5 – Communicate logical arguments clearly, showing why a result makessense and why the reasoning is valid.• A.R.3 – Use representation as a tool for exploring and understandingmathematical ideas.NCTM Standards:• Understand patterns, relations, and functions.• Organize and consolidate their mathematical thinking through communication.• Communicate their mathematical thinking coherently and clearly to peers,teachers, and others.• Analyze and evaluate the mathematical thinking and strategies of others.• Create and use representations to organize, record, and communicatemathematical ideas.Anticipatory Set: The teacher will begin class with a few questions:1. What does intercept mean?2. How many intercepts do you think there are in graphing a line?3. What do you think intercepts represent in graphing a line?Possible Responses:1. When something crosses something, where they cross is the intercept2. 1 or 23. Where a line crosses the axis
14Developmental Activity:Lecture/Activities:1. We are going to look at the y-intercept of different linear equations.First we need know how to enter an equation into our calculator. Gothrough instruction page with students. (Instruction Worksheet)2. The students will now follow along with the teacher on how to find theintercepts using the graph and table with their calculator. They willalso have an instruction worksheet to follow. (Instruction Worksheet)3. The students will now get a worksheet of a variety of linear equations,where they will need to work independently to find the x and yintercepts. (X/Y intercepts worksheet)4. When the students finish their worksheet they will need to get intogroups of 3 and compare answers. They will also need to answer thequestions on the bottom of the worksheet within their groups.5. When all the groups have completed their handout, the class will cometogether and each group will present an assigned problem from theworksheet using the overhead adaptor with their calculators.6. The teacher will monitor each group while they work together andcorrect the students as they present their problems, if there is amistake.7. Once the groups present their assigned problem, the whole class willhave a discussion on the written questions, on the worksheet.Closure: The students will write a paragraph into their journals about what they learnedfrom the lesson. They will also write down at least one question that they have about thecalculator or anything that they were confused about.Assessment: The teacher will collect the worksheet on finding the intercepts that thestudents completed in class. The teacher will collect and read the student’s journals tosee how they feel about find intercepts with the calculators. The students will be gradedon the group work they did in class.Instruction
15(Graphing an equation)Graph the equation y = x + 51. First press the [Y=] button:2. Now type your equation into the y1 slot:3. Press the [Zoom] button:4. Select “Zoom Fit” (It will graph your equation): You can play with the zoomfeatures and the window button, to find an appropriate viewInstruction
16(Finding intercepts with a graph and table)Find the x-intercept and y- intercept of the equation y = x + 51. First graph the line:2. To find x-intercept press [2 nd ] then [CALC] then select Zero. Make sure yourcurser is to the left of the x-axis and on the line and press [enter].3. Then move your curser so it passes the x-axis and still on the line, and select[enter].3. Now make a guess where you believe the line crosses the x-axis by moving yourcurser.
174. Finally the calculator gives us the point at which the line crosses the x-axis. Theexact values that cross the x-axis. This line crosses the x-axis at point (-5, 0).1. First graph the equation:Find the y-intercept of y = x + 52. Press [2 nd ] then press [CALC] and select Value:3. Enter into “0” into the X= (because where the line crosses the y axis the value forx is zero. Then press [enter]. This point is where the line crosses the y-axis,which is (0, 5). This is the y-intercept point.
18Find the x and y intercept point according to the table.1. Press [2 nd ] then press [Tblset], In this situation, enter -10 for Tblstart and 1 for▲Tbl =2. Press [2 nd ] then press [TABLE]3. Now look for when x = 0 and where y = 0. These are your intercepts on the x andy axis. In this situation you can find that x-intercept = -5 and y-intercept = 5.X/Y Intercepts
19Directions: With your calculator, graph each equation and find the x and y intercepts.Once you find the x and y intercepts by the graph, check it by looking at your table.Once you have finished the problems, get together with your group and discuss youranswers. Then with your groups answer the questions at the bottom. Make sure that yourequations are solved for y in terms of x before graphing.1. y = 5x – 152. y = -2.5x + 6.53. 8x + 10y = 304. y = 1/2x + 15. y = 1.95x – 12.05Group work:1. What kind of line has no y-intercept?2. If the x-intercept of a line is positive and the y-intercept is negative, does the lineslat up or down from left to right? Explain your reasoning.3. What did you notice about the intercepts and slope in relation to the equation?Answer Key:
201. y-intercept = -15 x-intercept = 32. y-intercept = 6.5 x-intercept = 2.63. y-intercept = 3 x-intercept = 3.754. y-intercept = 1 x-intercept = -25. y-intercept = -12.05 x-intercept = 6.181. What kind of line has no y-intercept?A line that does not cross the y-axis, for example the equation x = 52. If the x-intercept of a line is positive and the y-intercept is negative, does the lineslat up or down from left to right? Explain your reasoning.Slants up from left to right as the line would cross the y- axis through thenegative portion of the axis and it would cross the x-axis through thepositive portion of the x-axis.3. What did you notice about the y-intercept and the equation?That the y-intercept matches the “b” in the linear equation y = mx + b.The slope is the coefficient of the x-value.<strong>Day</strong> Three <strong>Lesson</strong> <strong>Plan</strong><strong>Lesson</strong> Topic: Introduction to Slope
21<strong>Grade</strong> <strong>Level</strong>: 9Materials: Calculator-Based Ranger (CBR 2), Overhead with TI-adapter, TI-83 plusCalculator, Graph paper, CBR Worksheet 1, Homework Worksheet, Journals, Pencil.<strong>Lesson</strong> Overview: Students will work the CBR to develop an understanding of slope.The students will also be introduced to the slope formula to compute slope.<strong>Lesson</strong> Objectives:• Given instruction on the CBR, the students will create graphs and describe theirslopes• Given the slope formula, students will be able to find the slope of a line.• Students will be able to describe slopes with appropriate mathematicalvocabulary.• Given the TI-83 calculators, students will be able to graph a linear equation andfind the slope.New York State Standards:• A.PS.4 – Use multiple representations to represent and explain problemsituations.• A.CM.2 – Use mathematical representations to communicate with appropriateaccuracy, including numerical tables, formulas, functions, equations, charts,graphs, Venn diagrams, and other diagrams.• A.R.3 – Use representation as a tool for exploring and understandingmathematical ideas.• A.A.33 – Determine the slope of a line, given the coordinates of two points onthe line.• A.A.32- Explain slope as a rate of change between dependant and independentvariables.NCTM Standards:• Understand patterns, relations, and functions.• Communicate their mathematical thinking coherently and clearly to peers,teachers, and others.• Use the language of mathematics to express mathematical ideas precisely.• Create and use representations to organize, record, and communicatemathematical ideas.Anticipatory Set: The teacher asks the students to answer the following question:Determine whether each statement is positive slope, negative slope or no slope1. John walks up a hill2. Marie walks down a hill3. Bill walks across flat ground.Possible Response:
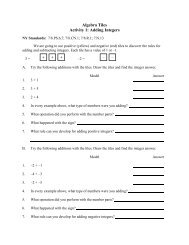
221. Positive slope2. Negative slope3. No slopeDevelopmental Activity:Lecture/Activities:1. Teacher introduces the Calculator-Based Ranger (CBR 2) by directinstruction as it is connected to the overhead. The teacher does a fewexamples of walking close to the CBR and walking away from theCBR. Then shows the students the different graphs created by the CBRof him walking. The teacher will ask the students “what do the graphslook like when I walk close to the CBR and what do the graphs looklike when I walk away from the CBR?”2. The teacher discusses why the graphs look the way they do. Forexample, as the teacher walks close to the CBR the slope is negative.3. To find slope the teacher traces the graphs that were created from theCBR and finds two random points. Then uses the slope formula tocalculate the slope of the graphs. This will be done by directinstruction from the teacher on the board.4. The students break up into groups of 3 and with their TI-83 pluscalculators and CBR they need to complete a handout. (Worksheet 1)5. The teacher will demonstrate to the students how to find the slope of alinear equation by finding the coefficient of the x term on theoverhead, from a linear equation when the students have finished theirCBR activity.Closure:1. The students will write in there journals what they learned in classabout different slopes.2. The students will turn in there journals and their handout theycompleted with the CBR, before they leave class.Assessment: Give the student’s homework on finding slopes of given points andthere will also be a writing question for the students to do. (Worksheet 2)Worksheet 1Name: ___________________________Date: ________________
23Directions:Connect your CBR to the calculator and place the CBR onto your desk.First stand 1meter away from CBR, facing away from CBR and walkaway from the CBR. Then answer questions 1-4.Now stand 3 meters away from the CBR and walk towards the CBR.Then answer questions 5-8.Lastly stand 3 meters away and stand still and answer questions 9-121. What kind of slope did you come up with? Why?2. Sketch your graph on graph paper.3. Find two points from the graph on your calculator and find the slope of the graphusing the slope formula.4. What does the slope of the graph tell you?5. What kind of slope did you come up with? Why?6. Sketch your graph on graph paper7. Find two points from the graph on your calculator and find the slope of the graphusing the slope formula.8. What does the slope of the graph tell you?9. What kind of slope did you come up with? Why?10. Sketch your graph on graph paper11. Find two points from the graph on your calculator and find the slope of the graphusing the slope formula.12. What does the slope of the graph tell you?Answer Key:
241. Positive Slope. As I walked away the slope of the graph increased steadily, this isa positive slope.42-10 -5 5 10-22. graph:3. Point 1: (0.0, 1.13) slope = 2.47 – 1.13 = .50Point 2: (2.7, 2.47) 2.7 – 0.04. That the slope of the graph is .50. That I was walking away from the CBR at arate of .5meters per second5. Negative Slope. As I walked toward the CBR, the slope of the graph decreasedsteadily, this is a negative slope.6. graph:-442-10 -5 5 10-2-47. Point 1: (0.0, 2.46) slope = .96 – 2.46 = -.56Point 2: (2.7, .96) 2.7 – 0.08. The slope of the graph is -.56. That I was walking toward the CBR at a rate of .56meters per second9. Zero Slope. As I stood still the slope of the graph stayed the same. There is azero slope.
258642-20 -15 -10 -5 5 10 15 20-2-4-610. slope-1011. Point 1: (.35, .85) Slope = .85 - .85 = 0.0Point 2: (.40, .85) .40 - .3512. There is no slope. The horizontal line gives you no slope.-8
26HomeworkName: ________________________Date: ________________Directions: Find the slope of the line passing through the points. Also write down thetype of slope of the points: (positive, negative, Zero or Undefined). HINT: If there is azero in the numerator than the line is undefined. If there is a zero in the denominator theslope does not exist or undefined. Write a paragraph on the last question. Use yourcalculator, if needed.1. (-4, 8), (6, 6)2. (1, 4), (1, -7)3. (-2, -4), (4, 2)4. (-5, 4), (3,4)5. (5, 8), (0, 5)6. (-3, 1), (-3, -2)7. (-6, -2), (6, -7)8. (9, -8), (15, -8)9. (12, 22), (-20, 19)10. One line passes through eh points M (1, 1) and N (3, 4) and another line passesthrough points P (2, 5) and Q (5, 8). Which line has a greater slope? Explainwhy?
27Answer Key:1. -.22. Undefined3. 14. 05. .66. undefined7. -.428. 09. .3810. The line that passes through points M and N has a slope of 1.5, which is a greaterslope than the line that passes through points P and Q which has a slope of 1. Thefirst line with point M and N has a greater number as a slope compared to the linewith points P and Q.
28<strong>Day</strong> Four <strong>Lesson</strong> <strong>Plan</strong><strong>Lesson</strong> Topic: Writing an equation for a line<strong>Grade</strong> <strong>Level</strong>: 9Materials: Computers, Green Globs Software, Homework handout, Pencil, Paper.<strong>Lesson</strong> Overview: Students will work with Green Globs software to develop anunderstanding of writing equations.<strong>Lesson</strong> Objectives:• Given the slope-intercept formula, the students will be able to rewrite linearequations.• Using the Green Globs software the students will be able to write linear equations.• Given the slope and a point on the line, students will be able to write an equationof a line.New York State Standards:• A.R.1 – Use physical objects, diagrams, charts, tables, graphs, symbols,equations, or objects created using technology as representations of mathematicalconcepts.• A.A.34 – Write the equation of a line, given its slope and the coordinates of apoint on the line.• A.G.4 – Identify and graph linear functions.NCTM Standards:• Represent and analyze mathematical situations and structures using algebraicsymbols.• Understand patterns, relations, and functions.• Create and use representations to organize, record, and communicatemathematical ideas.Anticipatory Set: The teacher will ask the students to find the slope and y-intercept of alinear equation.1. x – y = -22. y = 6 – x3. 1 = 2x -yPossible Response:1. Slope = -1, y-intercept = -22. Slope = -1, y-intercept = 63. Slope = 2, y-intercept = -1Main Activity:
29Lecture/Activities1. The teacher will have a direct instruction on the overhead on the slopeinterceptform of an equation: y = mx + b.2. The direct instruction will have an example of rewriting an equationinto the slope-intercept form, on the overhead. The example will be:1 = 2x – y which can be written as y = 2x – 1.3. The teacher will then review with the students by discussion, wherethe slope and y-intercept can be found in an equation. For example inthe equation y = 2x – 1, the slope is 2 and the y-intercept is -1.4. The teacher will also show the students that if you are given a pointand the slope you can write a linear equation. For example if you aregiven the point (1, 2) and slope = 2 then the equation is y = 2x + 2.This example will be done on the overhead.5. The teacher will introduce the Green Globs program to the class. Theteacher will show the students how to type equations into the program,by doing an example.6. The students will work in the <strong>Linear</strong> and Quadratics Program. Withinthis program the students will work with lines.7. Green Globs will give the students a line on a graph. The students areto write the equation of the line. If they are right they can advance tothe next level. If they are wrong, the program will graph the line youtyped and the student’s can change your response so it is correct.8. With this activity the students are learning by discovering. They areexploring linear equations through the Green Globs program.Closure: At the end of the class the students can play the Green Globs game. In thisgame the students try to hit all the green dots on the graph paper by writing equations andgraphing them. If the line crosses through a green dot, the dot gets hit and you receivepoints. The more dots you hit with a line the more points you get. The top five studentswho get the most points will receive a cool mechanical pencil.Assessment: The students will first rewrite equations into the slope-intercept form in thehomework assignment. Then students will also have to write down the equation of a linefor each problem which will consist of a point on the line and the slope. (HomeworkWorksheet)Homework
30Name: _________________________Date: ________Part I Directions: Write the equations into slope-intercept form1. -4x + 2y = 162. 6x – 2y = 103. y + 2 = 1/2xPart II Directions: Given a point on the line and the slope of the line write down theequation of the line.1. (0, 2) Slope: 22. (1, 2) Slope: 13. (-4, 5) Slope: ½4. (3, 2) Slope: 55. (0, 10) Slope: -106. (0, 0) Slope: 17. (-7, -8) Slope: -38. (9, 10) Slope: 119. (-15, -18) Slope: -2/310. (-5, -3) Slope: 1/5Answer Key:
31Part I1. y = 2x + 82. y = 3x – 53. y = 1/2x – 2Part II1. y = 2x + 22. y = x + 23. y = 1/2x + 54. y = 5x + 25. y = -10x + 106. y = x7. y = -3 – 88. y = 11x + 109. y = -2/3x – 1810. y = 1/5x – 3<strong>Day</strong> Five <strong>Lesson</strong> <strong>Plan</strong>
32<strong>Lesson</strong> Topic: Introduction to system of equationsMaterials: TI-83 plus Calculator, Overhead with TI adaptor, Paper, Pencil<strong>Grade</strong> <strong>Level</strong>: 9<strong>Lesson</strong> Overview: Students work with their TI-83 calculators to develop anunderstanding of solving a system of equations.<strong>Lesson</strong> Objectives:• Given a technical briefing of the TI-83 calculator, students will be able to entersystem of equations into the calculator.• Given instruction on the matrix program of the TI-83 calculator, students will beable to solve systems of equation.• Students will be able to explore equations on the calculator by graphing the linearequations.New York State Standards:• A.PS.4 – Use multiple representations to represent and explain problemsituations.• A.CM.2 – Use mathematical representations to communicate with appropriateaccuracy, including numerical tables, formulas, function, equations, charts,graphs, Venn diagrams, and other diagrams.• A.R.3 – Use representation as a tool for exploring and understandingmathematical ideas.• A.G.9 – Solve system of linear equations graphically.NCTM Standards• Represent and analyze mathematical situations and structures using algebraicsymbols.• Apply and adapt a variety of appropriate strategies to solve problems.• Communicate their mathematical thinking coherently and clearly to peers,teachers, and others.• Create and use representations to organize, record, and communicatemathematical ideas.Anticipatory Set: The teacher will present the problem:Solve the linear system: x + 4y = 4x- y = -6The class will have a discussion with the teacher on what it means to solve a system ofequation.Possible ideas: When the two linear lines cross. The two linear equations havethe same x and y value.Developmental Activity:
33Lecture/Activities:1. The teacher will go through on the overhead how to use the matrixprogram in the TI-83 plus calculator. (Instructional Worksheet)2. The students will follow with the teacher on how to solve a systemequation in the matrix program as the teacher demonstrates with thecalculator on the overhead. Each student will have a copy of theInstructional worksheet for a reference.3. The teacher will also go through graphing the two linear equations onthe calculator as a way to check their answers by finding theintersection.4. The students will be given a worksheet of different system ofequations, where they will need to work independently to solve theequations. (Worksheet)5. When the students are finished with their worksheet they will get intogroups of 3 and compare answers.6. In their groups they will answer a few thinking questions that are onthe handout.7. When all the groups are finished discussing their answers and groupquestions, the class will come together and the teacher will have aclass discussion on the problems they have been working on.Closure: The students will write into their journals about the lesson. They will writedown something they learned and something they are still confused about in regards tothe lesson.Assessment: The students will be given a homework assignment of many systems ofequations. (Homework)Instructional Worksheet(System of <strong>Equations</strong>)
34Solve the linear system: x + 4y = 4x- y = -6First make sure that the two equations are lined up by their variables. (Which they are)1. Press [2 nd ] then press [MATRIX]2. Move over from NAMES to EDIT using the arrow keys3. Now press [ENTER]4. Make sure that size of the matrix is the size that you want. (In this case it is 2 x 3,because there are two columns and 3 rows). If the system is larger or smallerchange the numbers next to where it says MATRIX[A].5. Now move your curser into the matrix using the arrow keys and input thenumbers of your system into the matrix.
356. Press [2 nd ], then press [Quit] once you have the matrix you want on the screen,this will take you back to the home screen.7. Now Press [2 nd ], then press [CATALOG]8. Now Press [r] and look for rref( and press [ENTER], rref( should appear on yourhome screen9. Press [2 nd ], then press [MATRIX]10. Make sure that that the number of the matrix that you imputed into your calculatoris highlighted, in this case 1: [A] 2x 3, and press [ENTER]
3611. Now press “ )” to close your equation and then press [ENTER]Your answer is located in the last column, in this problem the answer is (-4, 2)Class Work(Solving System of <strong>Equations</strong>)
37Name: _________________Date: ____________Directions: Using the matrix program in your calculator, solve the systems ofequations. Then in your groups discuss your answers and answer the questions at thebottom of this worksheet. You have to make sure that your variables match up beforeputting the system into your calculator.1. y = -x +3y = x + 12. x – y = 15x – 4y = 03. y = 2x – 15x = -2yGroup Work Questions1. What does the answer to the system of equations tell you?2. Can you find the answers to the system of equations algebraically? If so How?3. Can you find the answer to the system of equations using your graph in yourcalculator? If so How?Answer Key to Class Work:1. (1, 2)
382. (-4, -5)3. (6, -3)Group Work Questions1. This is the two lines cross. This is where the two linear equations have the same xand y values.2. Yes, Solve for Y and substitute that equation into the other equation for Y. Nowsolve for x. This is your answer for x. Then put the x-value into an equation andsolve for y. This is your y-value.3. Yes, solve each equation for Y, and then graph both equations into yourcalculator. Go into CALC and find there intersection.HomeworkName: _______________________Date: __________________Directions: Solve the system of equations
391. x = 4y = x + 12. a + b = 44a + b = 13. 2w – z = 24w + z = 204. 2x + 4y = 143x -5y = -15. You have 100 trading cards and your friend has 20, every day you give yourfriend one card. Use the equations c = 100 – d and c = 20 + d to model this situation.Use the matrix or graph to find out when both of you have the same number of cards.Answer Key:1. (4, 5)
402. (-1, 5)3. (11/3, 16/3) or (3.67, 5.33)3. (3, 2)5. In 40 days they will have the same number of cards. They will both have 60cards.