Landcorp - Crown Ownership Monitoring Unit
Landcorp - Crown Ownership Monitoring Unit
Landcorp - Crown Ownership Monitoring Unit
- No tags were found...

You also want an ePaper? Increase the reach of your titles
YUMPU automatically turns print PDFs into web optimized ePapers that Google loves.
<strong>Landcorp</strong>ANNUAL REPORT 2010LANDCORP FARMING LIMITEDINFORMED FARMING
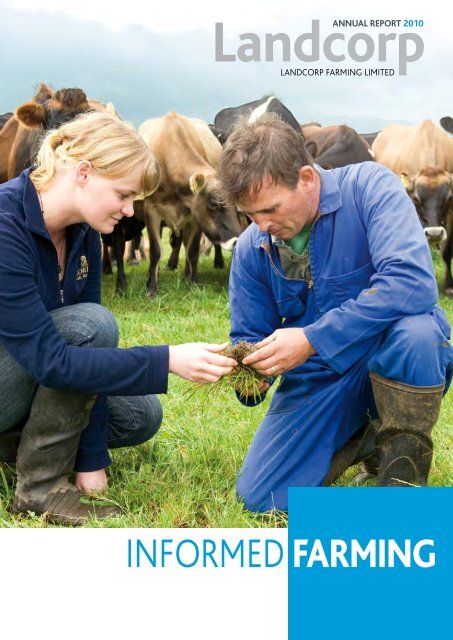
LANDCORP FARMING LIMITED (<strong>Landcorp</strong>) isa State-Owned Enterprise. It is New Zealand’slargest farmer, running 1.5 million stock units on105 properties with a total land area of 374,898hectares owned and leased.It has four subsidiaries.LANDCORP DEVELOPMENTS LTD, which isdeveloping former forestry land in the centralNorth Island for pastoral farming and LANDCORPPASTORAL LTD which is leasing that land forfarming purposes;LANDCORP ESTATES LTD, which develops andsells land (normally with joint venture partners)which is suitable for higher value use thanfarming; andLANDCORP HOLDINGS LTD, which holds<strong>Landcorp</strong> property protected from sale under anagreement with the <strong>Crown</strong>.<strong>Landcorp</strong>’s vision is:“To be the world’s best agribusiness.”<strong>Landcorp</strong>’s mission is:“To provide the shareholding Ministers withmaximum sustainable financial returns."<strong>Landcorp</strong>’s values are to:• Act honestly and with integrity.• Be environmentally responsible.• Be a fair employer.• Champion success and excellence.CONTENTS2 2009/10 Highlights andAchievements4 Directors’ Report8 Chief Executive’s Report15 <strong>Landcorp</strong> Achievers 2009/1017 Balanced Scorecard23 INFORMED FARMING24 - Livestock Management27 - Milking30 - Breeding32 - Pest Control35 - Land Use38 Board of Directors39 Executive Group40 Corporate Governance Report42 Financial Results Commentary45 Financial Statementsand Disclosure Information96 Audit Report97 Companies Act Disclosures100 DirectoryFRONT COVER: Farm Technician Jessica Shaw (left) and Dairy Farm Manager Glen Hooperassess grass growth on the Totara dairy unit, on <strong>Landcorp</strong> Farming’s Cape Foulwind complex.ISSN 1176-9394
LANDCORP FARMING STRIVES TO BETHE WORLD’S BEST AGRIBUSINESS.WE CONSTANTLY SEEK TO BE MORE PRODUCTIVE, MOREPROFITABLE AND MORE SUSTAINABLE – AND TO ACHIEVETHIS, WE MUST BE MORE INFORMED IN OUR FARMINGAND OUR USE OF RESOURCES.Farm Manager Ken Burt and Dr Geoff Nicoll, Head of Genetics, with theRomney ewe flock on Goudies Station, a 1,900 hectare property on flatand rolling country adjacent to the Kaingaroa Forest, central North Island.1
INFORMED FARMING2009/10HIGHLIGHTS33,091 DAIRYCOWS ON41 DAIRY UNITSTHROUGHOUTNEW ZEALANDA FURTHER 150AREAS WEREIDENTIFIED FORPROTECTION,614 HECTARESWERE FENCEDAND PROTECTED2,735 WAIHORAROMNEY EWESTHIS YEARINDICATEDA POTENTIALLAMBING RATE OF210 PER CENTBLAIRS DAIRY DEVELOPMENT COMPLETEDENVIRONMENTAL PROTECTIONDATA COLLECTION AND SCIENCELANDCORP HAS NOW COMPLETED the450-hectare Blairs development on the Wekacomplex, near Greymouth. The fifth dairyunit on Weka, Blairs has a state-of-the-artdairy shed and will be milking around 850cows in the current season. Weka is on trackto become a self-sufficient complex with a5,000-cow herd by spring 2011.LANDCORP CONTINUES TO PLACE HIGHIMPORTANCE on environmental protectionand sustainable land use. Conservationvalues are factored in to farm management,with areas of particular natural significanceset aside from production wherever this ispracticable.GENETIC PROGRESS IN LIVESTOCK IS COREBUSINESS FOR LANDCORP. We use complexbreeding values (BVs) for the selection ofanimals that will strengthen economicallydesiredtraits in future generations of sheep,cattle and deer. Work on the development andapplication of BVs is ongoing, on the farm andin the laboratory.2
KEY FINANCIAL DATADollars in millions unless otherwise stated 2009/10 2008/09 2007/08 2006/07 2005/06Total revenues 169.9 174.1 163.8 145.1* 122.7Net operating profit 10.0 6.9 11.0 14.9* 5.2Total shareholder return (112.5) (76.0) 275.7 32.2* 320.0Total shareholder return / (8.1%) (5.9%) 21.1% 2.8%* 32.4%Average shareholders' funds #Dividend declared 18.0 10.0 13.0 12.0 3.0Total assets 1,521.9 1,668.7 1,728.8 1,444.5* 1,379.6Shareholders' funds # / Total assets 87.9% 86.9% 87.5% 82.0%* 82.9%KEY OPERATING DATA2009/10 2008/09 2007/08 2006/07 2005/06Total hectares farmed (owned and leased) 374,898 374,948 372,259 370,739 369,861Total stock units at 30 June 1,507,400 1,533,069 1,555,426 1,623,714 1,580,843Permanent employees at 30 June 584 599 575 550 518* After adjustment for the transition to NZ IFRS from 1 July 2007 onwards.# Includes redeemable preference shares.3
INFORMED FARMINGDIRECTORS' REPORTHon. Jim SuttonCHAIRMANWarren LarsenDEPUTY CHAIRMAN<strong>Landcorp</strong> Farming works forNew Zealand, as a State-OwnedEnterprise and as a large-scaleagribusiness that leads the way forother farmers. We are committedto delivering value in both rolesthroughout the economic cycle.$10 MILLIONNET OPERATING PROFIT$18 MILLIONDIVIDENDS FOR 2009/10$112.5 MILLIONFALL IN SHAREHOLDER VALUE4
The 450-hectare Blairs development opened in June 2010as the fifth farm in <strong>Landcorp</strong>’s Weka dairy complex,near Greymouth on the West Coast.The past year has not been easy but <strong>Landcorp</strong> can reportcreditable financial results for the period and progress ona range of other indicators. Looking ahead, we are in astrong position to continue working for New Zealand andto pursue our goal of being the world’s best agribusiness.Financial Results<strong>Landcorp</strong> made a net operating profit beforetax of $10.0 million for the year ended 30June 2010, compared with $6.9 million for2008/09. The result is a creditable reflection ofthe company’s long-term strategy and of tightexpenditure control, all in the face of volatileproduct pricing, high exchange rates and thegeneral cost pressures on farming. In additionto this result, <strong>Landcorp</strong> made a pre-tax profitof $8.7 million on farm sales.The value of <strong>Landcorp</strong>-owned farms decreased$120.5 million between July 2009 and June2010, this becoming the main contributorto a $112.5 million loss in the company’sshareholder value for the year (2008/09: $76.0million loss). The loss is, of course, unrealisedand must be seen in context of substantialshareholder value gains over the long term.Financial results are discussed further onpages 42, 43.Dividends<strong>Landcorp</strong> will pay the shareholders dividendsof $18.0 million for 2009/10 (2008/09:$10.0 million). Of the total, $9.0 millionwill be special dividend funded from farmsale proceeds. Under our Protected LandAgreement with the <strong>Crown</strong> (September2007), $17.4 million of the dividend total willbe diverted back to <strong>Landcorp</strong> in the form ofredeemable preference shares. The balance($0.6 million) will be paid in cash. The 2010/11year will be the final one in the four-yeardividend diversion scheme through which thecompany receives the balance outstandingon its sale to the <strong>Crown</strong> of nine propertiesset aside for public policy purposes under the2007 agreement.Strategy<strong>Landcorp</strong> will continue with the strategicdirection established in 2001: Diversificationacross dairy, deer, sheep and beef farming,clustered management of properties andongoing improvements in productivity. We willcontinue all these with strong emphasis onenvironmental protection and sustainability.Increasingly, <strong>Landcorp</strong> makes use of newtechnologies and information to be moreproductive, profitable and sustainable. Thisannual report is entitled “Informed Farming” tohighlight the importance of data gathering andanalysis, and of well-informed decision makingin every aspect of <strong>Landcorp</strong> business. Keydecisions are being made regularly, on-farmand in Wellington, about animal management,breeding, pasture growth and land use. Thereare also big decisions on product marketing,property investment and more. Overall, theinformed farming approach is critical to howwell <strong>Landcorp</strong> works for New Zealand.Our strategy includes constant readiness tolook at farm acquisition prospects when thesearise. Decisions must, of course, be informedby analysis of relevant data and standardcommercial disciplines. This was certainly ourapproach in June and July 2010 when <strong>Landcorp</strong>bid for the purchase of 16 farms previouslyowned by the Crafar family. The bid price,while not accepted by receivers, reflected ourcommercial valuation of the properties. Asa large-scale agribusiness, we took a wellinformedand responsible view of the Crafarfarm offering – and will do the same as otherinvestment opportunities arise for <strong>Landcorp</strong>.SustainabilityAs noted, we place high importance onsustainability, in environmental, social andeconomic terms. The Balanced Scorecard(pages 16–22) reports on indicators ofprogress in each area. Our sustainabilityobjectives include minimising <strong>Landcorp</strong>'s5
INFORMED FARMINGDIRECTORS' REPORT CONTINUED“Our “informed farming”approach, based ontechnology and wellinformeddecision making, iscritical to everything we do.We are confident of futuresuccess – success that willultimately benefit all NewZealand through our rolesas a leading agribusinessand profitable State-OwnedEnterprise.”carbon emission’s footprint and during2009/10, we estimated this in respect oflivestock operations. Work is ongoing inpreparation for obligations on agriculture tobecome part of New Zealand’s EmissionsTrading Scheme (ETS) from January 2015.<strong>Landcorp</strong> continues to be an active participantin the Pastoral Greenhouse Gas ResearchCentre which does research and developmentwork on the reduction of emissions fromfarming. We are involved in other projects alsoincluding lifecycle analysis of emissions in thesheep, beef, dairy and deer industries.<strong>Landcorp</strong> is concerned also with issues ofwater usage and quality, as clearly evidentfrom Balanced Scorecard indicators andthe progress being made with on-farmenvironmental protection. Increasing focus onwater conservation has seen a shift on someSouth Island dairy farms from flood irrigationmethods to centre pivot spraying which usesless water to achieve comparable pasturegrowth. The company is looking at new optionsfor pond storage or access to undergroundsupplies where these could be the mostefficient options for water usage on particularproperties.PeopleDirectors acknowledge the hard work andcommitment of Chief Executive Chris Kellyand all <strong>Landcorp</strong> people during 2009/10. Itwas, overall, a year of improved performancefor the company despite all the challenges weface – a tribute to the skill, knowledge anddetermination of our people. It is very pleasingto see high levels of job satisfaction evident inregular, six-monthly surveys within <strong>Landcorp</strong>.We are also delighted to see individualsrecognised for their excellence throughindustry awards during the year (see page 15).During 2009/10, directors Lex Henry and MavisMullins retired from the Board, Mr Henry aftersix years and Mrs Mullins after seven years.Both made significant contributions duringtheir time as directors. We have welcomedtheir successors, Bill Baylis and Traci Houpapa.The FutureThe future is always uncertain but growthhas returned to the global economy, withsigns of improved demand for New Zealandagricultural products. <strong>Landcorp</strong> is workingto secure greater value from internationalmarkets, and to raise on-farm productivityand sustainability. Our “informed farming”approach, based on technology and wellinformeddecision making, is critical toeverything we do. We are confident of futuresuccess – success that will ultimately benefitall New Zealand through our roles as a leadingagribusiness and profitable State-OwnedEnterprise.Hon. Jim Sutton CNZMChairmanWarren Larsen CNZMDeputy Chairman30 August 20106
We are poised to go furtherand faster on genetic progresswith the advent of genomicbreeding values that refineINFORMEDram and ewe selections. ReferBREEDING,pages 30–31.Waihora Romney on Goudies Station, central North Island.7
INFORMED FARMINGCHIEF EXECUTIVE'S REPORTLANDCORP FARMING HAS MADESOLID PROGRESS THROUGHANOTHER YEAR OF MIXED FORTUNESFOR NEW ZEALAND AGRICULTURE.Chris KellyCHIEF EXECUTIVE8
LANDCORP FARMING LIMITED AND SUBSIDIARIESFINANCIAL PERFORMANCEDollars in millions unless otherwise stated 2009/10 2008/09Dairying has improvedwith milk prices upfrom their sharp fall in2008/09, while sheepmeat,venison, beef and woolhave once again beensubject to depressed orvolatile market conditions.Drought or unseasonalcold hit production insome regions through thepast season.For all producers, the persistently-high valueof the New Zealand Dollar and domestic costpressures continue to pull down returns. In themeat industry, the need is ever more pressingfor a major transformation that enablesfarmers to secure greater value from producingmore closely to consumer market demand.<strong>Landcorp</strong> has, nonetheless, continued to securethe benefits of long-term diversification inits production, of tight control on operatingexpenses and of initiatives for increasedproductivity, for better linkage to markets,and for sustainability and environmentalprotection.Financial Performance<strong>Landcorp</strong> made a net operating profit for theyear ended 30 June 2010 of $10.0 million, upfrom $6.9 million in 2008/09. The increasewas due largely to an industry-wide recoveryin dairying, and to reduction in <strong>Landcorp</strong>’sexpenses as farm budgets were tightened andinterest costs were cut.In addition to the net operating profit,<strong>Landcorp</strong> achieved pre-tax gains of $8.7million on farm sales (2008/09: $3.8million). On this basis, <strong>Landcorp</strong> will paythe shareholders total dividends for 2009/10of $18.0 million, with $9 million of thisbeing special dividend funded from farmsale proceeds.Total shareholder return for 2009/10 was aloss of $112.5 million (2008/09: $76.0 millionTotal operating income 169.9 174.1Net operating profit 10.0 6.9Total shareholders’ return (112.5) (76.0)Net profit on equity investment 4.5% 3.2%(share capital and retained earnings)Total shareholders’ return on average shareholders’ funds (8.1%) (5.9%)(including redeemable preference shares)loss) due largely to unrealised reductions inthe value of <strong>Landcorp</strong>-owned farms. Thesereductions amounted to $120.5 million(2008/09: $97.9 million reduction) after dairyand drystock (sheep and beef) farms fell invalue by 14 and 10 per cent respectively.Revenues<strong>Landcorp</strong> revenues from dairy, livestock andforestry operations during 2009/10 were$163.0 million, up 1.6 per cent from theprevious year ($160.3 million). The increasereflected a 29.5 per cent jump in milk revenueto $70.2 million (2008/09: $54.2 million),more than offsetting income reductions fromsheep and deer farming.Milk revenue was restored almost to its2007/08 level as prices recovered and as<strong>Landcorp</strong> continued to expand production.Dairy companies supplied by <strong>Landcorp</strong> haveindicated payout prices between $6.10 and$6.40 per kg of milksolids for the past year(2008/09: $4.45-$5.20). <strong>Landcorp</strong>’s milksolidsproduction reached 11,504 tonnes, up 2.6 percent on 2008/09 despite summer drought onNorthland dairy properties. At 30 June 2010the company had 33,091 dairy cows on 41dairy units throughout New Zealand.Sheepmeat revenue declined to $37.6 million(2008/09: $43.7 million), due mainly to alower level of lamb prices through the year.Indicator schedule prices were down around12 per cent in June 2010 compared withJune 2009. <strong>Landcorp</strong> also reduced sheepmeatproduction to 9,639 tonnes for the year(2008/09: 10,130 tonnes) as commercial flockscontinued to recover from drought in previousyears. Lambing rates were overall slightly downin 2009/10 although the South Island rate wasa record 139 per cent. Wool revenue for theyear was virtually unchanged at $5.9 million(2008/09: $6.0 million).Deer revenue was down sharply to $14.5million (2008/09: $24.1 million) in responseto lower venison prices through the year.Indicator schedule prices were down around21 per cent in June 2010 compared withJune 2009. <strong>Landcorp</strong>’s venison productionalso declined to 2,060 tonnes, continuing acontraction in the previous years.Beef revenue increased to $31.3 million(2008/09: $30.7 million) on production of10,268 tonnes (2008/09: 11,162 tonnes).Beef schedule prices improved through thesecond half of the year. Forestry revenue morethan doubled to $2.7 million (2008/09: $1.1million) due to increased forest sales and anallocation of carbon emission credits.<strong>Landcorp</strong>’s total income for 2009/10 (includingdairy, livestock and forestry revenues) wasdown to $169.9 million (2008/09: $174.1million). The decline reflected largely a lowerlevel of subdivided land sales, and reduction inthe value of silage, hay and balage producedon <strong>Landcorp</strong> properties during the year.Expenses<strong>Landcorp</strong>’s operating expenses for 2009/10were down 3.9 per cent to $148.5 million(2008/09: $154.5 million), largely due to areduction in farm working expenses by8.8 per cent to $62.9 million. This reflects astrong focus on cost management by farmmanagers, resulting in operating expensesbeing $2.4 million below budget. Thecompany’s improved net operating profit for2009/10 was a reflection of this reduction, andof a 10.8 per cent fall in interest expenses to$11.4 million (2008/09: $12.8 million). Interestexpenses came down as <strong>Landcorp</strong> reduced itsterm borrowings.9
INFORMED FARMINGCHIEF EXECUTIVE'S REPORT CONTINUEDMORE INFORMATIONWe are embracing thebenefits of electronicidentification for moreregular and more reliabledata gathering and hence,better animal and herdmanagement.Refer INFORMED LIVESTOCKMANAGEMENT, pages 24–26.Operating ConditionsClimate and pasture growth varied widelyacross the regions during 2009/10. Summerdrought settled on Northland early and<strong>Landcorp</strong> moved quickly to disperse dairycows from this region to suitable propertiesfurther south. In the central North Island,production was impacted by unseasonal coldin spring, including snowfall in October, andthen by a cold, dry autumn. Meanwhile, eastcoast regions of both North and South Islandshad conditions more favorable than for someyears through much of the growing season.Generally, the South Island had an excellentseason as evident in record lambing andcalving rates on <strong>Landcorp</strong> properties.The New Zealand Dollar rose against mostmajor currencies during the year, with thetrade-weighted index in June 2010 up byaround 10 per cent on its level of 12 monthspreviously. At one stage, the index was up byaround 12 per cent with the Kiwi then valuedabove US72 cents.Farm Sales<strong>Landcorp</strong> completed the sale of threeproperties and two other farm blocks during2009/10, producing a pre-tax profit of $8.7million. The three complete properties –Sweetwater, Te Karae and Te Raite – weretransferred to the <strong>Crown</strong> on 30 June 2010for later inclusion in Treaty of Waitangisettlements with five Far North Iwi. To enablethis sale, the <strong>Crown</strong> waived the land salesmoratorium that was imposed on <strong>Landcorp</strong>under the Protected Lands Agreement ofSeptember 2007. <strong>Landcorp</strong> has leased backTe Karae and Te Raite for ongoing farmmanagement, and it has become a sharemilkeron Sweetwater. Iwi are expected to acquirethe three when relevant legislation is passed,probably in 2012.The two farm block sales were part of the largeAratiatia and Rotomahana properties, bothnear Taupo. These two sales were exempt fromthe moratorium under the original terms ofthe 2007 agreement.Balance Sheet<strong>Landcorp</strong> made significant progress ondebt reduction during 2009/10, therebystrengthening its balance sheet and reducinginterest expenses. At 30 June 2010, totaldebt was down to $149.4 million (June 2009:$181.8 million) and the debt to-debt-plusequityratio was 11.0 per cent (June 2009:11.1 per cent). Debt reduction puts <strong>Landcorp</strong>in a stronger position to make strategicacquisitions of property as opportunities arise.Total assets were $1.52 billion at 30 June2010, down from $1.67 billion at the previousbalance date due mainly to a decline in thevalue of <strong>Landcorp</strong>’s land and buildings. Thecompany reduced capital expenditure overallduring the year but continued to invest inprojects with strategic importance to futuregrowth in revenue and profitability.Subsidiaries<strong>Landcorp</strong> Estates LimitedThe property development subsidiary earned agross profit of $982,000 for 2009/10 but afterexpenses, interest and tax, it showed a net lossof $220,000. The result, better than budget,was reasonable given New Zealand’s economicrecession and low level of demand for sections.Almost all gross profit was from section saleson the Lakeside Terraces development, Taupo.On all other projects, sales were minimalor <strong>Landcorp</strong> Estates decided not to activatesubdivision consents previously granted.Subdivision consent has been sought for a newproject at Eyrewell in Canterbury while a new10
LANDCORP FARMING LIMITED AND SUBSIDIARIESCAPITAL STRUCTUREDollars in millions unless otherwise stated 2009/10 2008/09Total assets 1,521.9 1,668.7Total debt 149.4 181.8Shareholders’ funds 1 1,337.6 1,450.1Shareholders’ funds 1 as % of total assets 87.9% 86.9%1Includes redeemable preference sharessubdivision at Te Anau is under consideration.The outlook includes a subdued 2010/11, butthe company has protected sale values to theextent possible and is well positioned for risingdemand when this occurs.<strong>Landcorp</strong> Developments Limited /<strong>Landcorp</strong> Pastoral LimitedThese two subsidiaries were establishedto support the Wairakei forest-to-pasturedevelopment which was stopped in December2007 after Parliament passed climatechange and emissions trading legislation.The implications for further conversion inland use away from forestry created muchcommercial uncertainty for all parties involved.Six dairy farms and one dry stock propertywere developed by December 2007 and theseare currently being farmed. The remainderof this central North Island venture remainsunder review, and the activities of <strong>Landcorp</strong>Developments and <strong>Landcorp</strong> Pastoral weretransferred to the parent, <strong>Landcorp</strong> Farming,in July 2010.<strong>Landcorp</strong> Holdings Limited<strong>Landcorp</strong> Holdings was established during2007/08 to hold properties under <strong>Landcorp</strong>’sProtected Land Agreement with the <strong>Crown</strong>.The agreement also placed a moratoriumon commercial sales of most other farmlandowned by <strong>Landcorp</strong> until September 2011(with the sale of Sweetwater, Te Karae andTe Raite Stations covered by a recent waiver).During 2009/10, another property subjectto the moratorium (Rangiputa) was alsoidentified for potential inclusion in a Treaty ofWaitangi settlement.StrategyOverall, <strong>Landcorp</strong> retains a strong strategicfocus on productivity growth through bestpractice farming, and through the astute useof technologies and information for moreefficient and sustainable production. In dairy,beef and deer operations, we are embracingthe benefits of electronic identificationfor more regular and more reliable datagathering and hence, better animal and herdmanagement. The approach is taken furtherin dairying with our roll-out of MilkHub –an excellent example of how purpose-builttechnology and valuable information flowsdrive productivity growth.<strong>Landcorp</strong> sheep breeding programmes areanother example of how collection andanalysis of data make a vital contribution toproductivity gain through genetic progress.In 2010, we are poised to go further andfaster with the advent of genomic breedingvalues that refine ram and ewe selections. Ofcourse, our strategic approach to productivityalso encompasses pasture management andfarm development. <strong>Landcorp</strong> is, for example,leading the effort to control manuka beetleand limit its costly damage to West Coastpastures. More generally, we are extendingfarm development practices to includewell-informed decisions on environmentalsustainability as well as productivity. OnMararoa Station, Southland, and elsewherethese go hand-in-hand.<strong>Landcorp</strong> strategy is to maintain diversifiedfarming operations across sheep, beef, dairyingand deer. This approach has served us well incontext of high volatility in product prices andregional climate variation. During 2009/10,the recovery in dairying has offset a cyclicaldown-swing in sheepmeat and venison,with beef also down for much of the year.We will continue strengthening dairying anddeer operations as part of the long-termdiversification into these areas, alongsidesheep and beef.In dairying, <strong>Landcorp</strong> has now completed the450-hectare Blairs development on the Wekacomplex, near Greymouth. The fifth dairy uniton Weka, Blairs has a state-of-the-art dairyshed and will be milking around 850 cows inthe current season. Weka is on track to becomea self-sufficient complex with a 5,000-cowherd by spring 2011.In deer, <strong>Landcorp</strong> will develop existingoperations with plans to bring a further 800hectares across to this species in 2010/11 andto finish more animals on properties also usedfor breeding with gains expected in production.We account for around 12 per cent ofnational deer production, and are committedto farming through periods of lower marketpricing on venison and velvet.Overall, <strong>Landcorp</strong> is a strong supporter oftransformation in New Zealand’s red meatindustry to unlock greater value for farmersand processors through systematic linkage ofproduction to consumer tastes and marketrequirements. The company is now a partnerwith Silver Fern Farms, PGG Wrightson and theGovernment in a bold seven-year programmefor such transformation through an integratedvalue chain approach to international markets.It will focus on improving genetics, on-farmperformance and meat processing, and alsoon market analysis, information flows andtechnology development.Market linkage is a key area of <strong>Landcorp</strong>strategy. We will continue to work withindividual meat companies to develop nicheopportunities in international markets and toalign production more closely with marketrequirements. In this context, we applaudmeat processors' introduction of yield qualitycontracts with premium prices for supply of11
INFORMED FARMINGCHIEF EXECUTIVE'S REPORT CONTINUEDWe are rolling out MilkHub– an excellent exampleof how purpose-builttechnology and valuableinformation flows driveproductivity growth. ReferINFORMEDMILKING,pages 27–29.12
lambs above specified meat yields in the leg,loin and shoulder regions. During 2009/10,through the Alliance Group, premiums formeat yield earned up to $5.25 per qualifyinglamb. Of lambs supplied to this processor by14 South Island <strong>Landcorp</strong> farms, the numberfrom each property that qualified for thehighest premium ranged between 63 per centand 87 per cent.Information Systems<strong>Landcorp</strong> made solid progress during 2009/10on new information systems that are criticalfor strategy implementation. We are puttingnew forecasting and analytical tools in thehands of decision makers on-farm and inthe Wellington office. Dairying operationsnow have a constantly-updated “dashboard”of performance indicators, based on datafrom multiple sources. Managers have theproduction, weather and financial informationrequired to make rapid, well-informeddecisions for increased productivity. Thesetools provide consolidated production andfinancial information at both dairy complexand national levels.Next developments include an integrated feedbudgeting system with one-time data entrythat will make regular forecasting a moreviable option for farm managers. This andother tools use newly-acquired farm geospatialdata, high-speed broadband connectivityand other infrastructure that is not generallyavailable in rural areas. The company is leadingNew Zealand agriculture on the take-up ofinformation technologies for better decisionmaking and productivity growth.Training and Employee PerformanceWe are also moving ahead with initiativesfor employee training, and for linkingindividual and business performance. During2009/10, <strong>Landcorp</strong> adopted a competencybasedframework for recruitment, ongoingdevelopment and management of peoplewho have the knowledge, experience andmotivation required for the company to besuccessful. Targets and measures in <strong>Landcorp</strong>’sBalanced Scorecard are now reflected in theannual performance objectives set for eachbusiness unit, farm and manager.Greater focus is being put on farm staffinduction and for new farm managers,this includes a four-day induction coursein Wellington and ongoing support froma mentoring colleague. The company hasestablished a manager succession plan,updated annually and used to identifyindividuals most suitable for promotion in thecoming five years. Across <strong>Landcorp</strong>, employeescontinue tertiary training and they studied fora total of 406 agricultural qualifications during2009/10. Participation in external courses and/or internal training programmes is critical tobuilding our capability.At 30 June 2010, the company had 584permanent employees (June 2009: 599).Staff turnover was down to 23.7 per centduring the year (2008/09: 28.4 per cent),with levels of retention improving onboth dairy and drystock farms, and in theWellington office. We undertake an online“job climate” survey every six months, with themost recent survey indicating that 85 per centof staff feel happy with their jobs, and wellsupported by their manager and the company.Virtually all feel safe on the job and 88 percent say they have the right people around forthem to perform well.Environmental Protection<strong>Landcorp</strong> continues to place high importanceon environmental protection and sustainableland use. Conservation values are factored into farm management, with areas of particularnatural significance set aside from productionMORE INFORMATIONWe are leading theeffort to controlmanuka beetle andlimit its costly damageto West Coast pastures.Refer INFORMED PEST CONTROL,pages 32–34.13
INFORMED FARMINGCHIEF EXECUTIVE'S REPORT CONTINUEDMORE INFORMATIONWe are extending farmdevelopment practicesto include well-informeddecisions on environmentalsustainability as well asproductivity. On MararoaStation, Southland, andelsewhere these go handin-hand.Refer INFORMED LAND USE,pages 35–37.wherever this is practicable. During 2009/10,a further 150 areas were identified for suchprotection, and 614 hectares were fenced andprotected under 30 registered covenants. Theseactions resulted in 63 areas of bush, five ponds,42 wetlands and 40 riparian margins beingretired.<strong>Landcorp</strong> is very interested in the potential forwind farming on various properties throughoutNew Zealand. We have a joint ventureagreement with an electricity generationcompany for the installation of turbines onone property. Notice has been given andaccepted for this development to proceed,with construction due to begin late 2010. Thewind farm is due to be supplying power inFebruary 2011. Meanwhile, wind monitoringcontinues on four other sites and a monitoringmast is soon to be erected on a fifth site.People ContributionI thank the Chairman and directors for theirsupport and encouragement during 2009/10and, in particular, acknowledge the workdone by Lex Henry and Mavis Mullins whohave recently retired from the Board. I alsorecord my sincere appreciation to <strong>Landcorp</strong>staff for their hard work and commitmentduring another difficult year. The company’sperformance was only possible because ofdedication to their jobs and willingness to“go the extra mile” in protecting and managing<strong>Landcorp</strong> assets.During 2009/10, three long-serving farmmanagers retired: Max Bary from Tangimoana,after 28 years; Trevor Grimwood fromRotomahana, after 29 years; and EricSanderson from Opouahi, after 21 years. Iextend to them our best wishes for the future.We continue to recognise the social andeconomic needs of communities in which<strong>Landcorp</strong> operates. Sponsorships and grantswere given to various farm-related activitiesand support groups in these communities.The company also contributed to educationalprogrammes that have an association with ourpeople.OutlookWe expect milk prices to recover in 2010/11as the world moves further out of recession,although the outlook for meat and woolprices remains very uncertain. For NewZealand farmers, high exchange rates are stilla major concern: The gains from a correctionin this situation would be substantial for allproducers. Meanwhile New Zealand is comingthrough a mild but wet winter with a generallypositive outlook for production across all farmtypes in the new season.<strong>Landcorp</strong> will continue to focus onstrengthening its operations with newinformation systems, with people training anddevelopment, and with many other initiativesthat drive productivity and sustainability. Thebalance sheet is strong, enabling us to invest inprojects of strategic significance and to acquirefurther properties if the right opportunitiesarise. Meat industry transformation will be amajor focus from now on. This is somethingthat simply must happen for the longer termprosperity of New Zealand farming. In thisregard, we will push ahead with the company’sown initiatives for closer linkage of productionwith market requirements.<strong>Landcorp</strong> has come through the past year welland we face the future with confidence aboutwhat can be achieved.Chris KellyChief Executive14
LANDCORP ACHIEVERS 2009/2010LANDCORP PEOPLE HAVE BEEN RECOGNISED FOREXCELLENCE IN THEIR WORK.DEER INDUSTRY NEWSENVIRONMENTAL DEER FARMINGWEST COAST CONSERVATIONTIM AND TRISH SMITHOF MARAROA STATION,SOUTHLAND, HAVE EARNEDMAJOR RECOGNITION THISYEAR FOR EXCELLENCE IN DEERFARMING AND ENVIRONMENTALSUSTAINABILITY.The Smiths and Mararoa (seepages 35-37) won the ElworthyEnvironmental Award, under the principal sponsorship of Deer Industry New Zealand.The Smiths won four other awards for farming innovation, sustainable land and wateruse, and protection of water quality.The Elworthy Award recognises best practices for sustainable and profitable deerfarming, and promotes the adoption of these on all deer farms in New Zealand.In making the award to the Smiths and Mararoa, the judges highlighted the balanceachieved on the property between environmental protection and the business offarming. They were impressed by many aspects of Mararoa including the monitoringof water quality, the importance given to stock feed, the strength of labour and safetymanagement, and the effort given to community relations.Tim and Trish Smith were also winners of the separate New Zealand Landcare TrustAward for Excellence and Commitment to Sustainable Deer Farming. The judgeshighlighted the commitment on Mararoa to protection of valuable streams, vegetationand biodiversity, and the Pelton wheel pump as an innovative solution for stock waterreticulation. The Smiths were recognised further with the Duncan and Company Awardfor Excellence, Innovation and Vision in a Demanding Environment.The Ballance Southland Farm Environmental Awards (BFEA) also put a spotlight onMararoa. The Massey University Discovery Award went to the Smiths, in recognition ofthe Pelton wheel innovation. They also won the BFEA Water Quality Award. Reflecting onall this recognition, Tim Smith says: “I developed a vision early on after talking to variouspeople about land management on Mararoa, and seeing what damage can be done towaterways and land through poor management. Then, we’ve done lots of planning tobring together the people and resources needed for Mararoa to be where it is today.”The Department of Conservation has recognised <strong>Landcorp</strong> for a valuable contributionto West Coast conservation through the company’s commitment to covenantingwetlands and native forest areas on the company’s properties in this region. At the awardpresentation, September 2009, were (from left to right) Mike Copeland (QEII West Coastrepresentative), Chris Kelly, Graeme Mulligan, Gerry Soanes, Bruce Hunter, and Julie andPaul Hateley.DAIRY INDUSTRY WINNERSPAUL MAHONEY OF POUARUA J ON THEHAURAKI PLAINS WON SOUTH AUCKLANDDAIRY FARM MANAGER OF THE YEAR IN THE2010 DAIRY INDUSTRY AWARDS.Paul and wife Stacey (below) also won meritawards for Human Resources and FinancialManagement in the South Auckland region. Theywon the same two merit awards last year.Paul and Stacey joined <strong>Landcorp</strong> on the Pouaruacomplex in July 2007 and they were managingthe G unit there when this year’s awards weremade. Since then, they have moved onto thebigger J unit with responsibility for its 1,250dairy cows and five staff.Paul is now in his 17th year of dairying and wasmanager on a private farm at Mercer, SouthAuckland, before joining <strong>Landcorp</strong>. He intendsa long-term career in the company. “Once Ihave learned the ropes more, I would be keento move up to a Farm Business Manager role,”he says.Dion Soutar of the Endeavour Farm (<strong>Landcorp</strong>Pastoral) was placed third in the Central PlateauDairy Farm Manager of the Year competition,while winning the Westpac Financial Planningand Management Award in this region. BradyMitchell, who is Production Manager onResolution (<strong>Landcorp</strong> Pastoral), won DairyTrainee of the Year in the Central Plateau.Meanwhile in the Far North, Julian Reti-Kaukauof Sweetwater was placed third in that region’sDairy Trainee award.Well done to Paul and Stacey, and to Dion,Brady, Julian and to all other Dairy IndustryAward entrants who did <strong>Landcorp</strong> proud in2009/10!15
BALANCED SCORECARD 2010<strong>Landcorp</strong> Landmark ewesgrazing on autumn pasture onMararoa Station, Southland.16
The Balanced Scorecard2009/10The Balanced Scorecard reports keyperformance indicators that are centralto <strong>Landcorp</strong> Farming’s strategic businessplanning processes, and that reflect thecompany’s commitment to sustainabilityand to Corporate Social Responsibility(CSR). In addition to key financialindicators, the Scorecard reports on<strong>Landcorp</strong>’s performance in maintainingand improving the productiveness of itsfarms, and in managing and reducing theirenvironmental impacts. It also reportsperformance in relation to employeesand customers.<strong>Landcorp</strong>’s strategic planning andreporting (internal and external) takes fullaccount of requirements under all relevantNew Zealand statutes, most notably theState-Owned Enterprises (SOE) Act 1986,and the Government’s CSR guidelines forSOEs, as well as the company’s Mission,Vision and Values, its current Statement ofCorporate Intent and the Global ReportingInitiative (GRI) guidelines of relevanceto large-scale agricultural businesses.These requirements, philosophies andguidelines are embedded in <strong>Landcorp</strong>’scomprehensive FarmPride programmefor quality assurance in all farmoperations, its Work Safe programme forhealth and safety practices, and trainingactivities that encompass all employees.<strong>Landcorp</strong>’s extensive commitment toresearch and development (R&D), and toco-operation with other organisations fortechnology application, creates the basisfor ongoing improvement in performancein each area of the Scorecard. Highlightsof <strong>Landcorp</strong> investment in R&D and newtechnologies are also reported on thefollowing pages.17
BALANCED SCORECARD 2010OBJECTIVE MEASURE 2009/10 2009/10 2006-2010 COMMENTARYTARGET ACTUAL AVERAGEFinancialMaintain growth ingross revenueGross revenuepercentage growthper annum based on2000/01 prices-3.5% 1.8% 4.7%The negative target reflected anexpected reduction in production as aresult of three years of poor growingconditions. As a result of drought innorthern regions during 2009/10,livestock sales were higher thanexpected.Maintainsatisfactoryreturn on fundsinvested (RoFI)Total shareholderreturn as a percentage≥ weighted averagecost of capital(WACC)WACC WACC WACC−0.3% −13.8% + 1.7%The negative return for 2009/10 wasdue to a 11% devaluation of land andbuildings, following market trends.ImproveproductivityThe value of farmoutputs as apercentage of totalinputs includingoperating expensesand the cost ofinvested capital3.2% 0.2% 2.8% Productivity is the relationship betweenthe value of farm outputs and thevalue of inputs used to generate thoseoutputs, including capital. The reductionwas a follow-on effect from droughtsin 2007/08 and 2008/09. The droughtsled to reduced breeding stock numbersand reduced reproductive performancein a significant proportion of farms.This resulted in reduced production in the2009/10 year. The droughts also loweredthe five year average.OBJECTIVE MEASURE 2009/10 2009/10 2006-2010 COMMENTARYTARGET ACTUAL AVERAGEOperationalMaintain effectivefarmed areaTotal hectares infarm production177,060 177,610 168,953The total includes all land in pasture orcrop, and excludes areas of conservationretirement, riparian strips, forest plantationsand service areas with buildings.Improve pastureproduction andutilisation on asustainable basisStock units pereffectivehectare at 30 June8.8 8.5 9.2Stock units per hectare were slightly belowtarget reflecting the impact on breedingstock of weather events. This situation willchange as <strong>Landcorp</strong> rebuilds its breedingstock numbers.Sustainablyincrease totalstock unitsTotal closing stockunits (30 June)1,563,984 1,507,400 1,560,090 Stock unit numbers were lower thantarget due to the destocking of sheep andbeef properties to mitigate the impact ofdrought.Increase productionvolumesMilksolids production(tonnes)12,091 11,504 10,503Milksolids production was slightly belowtarget due to drought impacts and otherseasonal conditions in the far North ofNew Zealand.Sheep meatproduction (tonnes)10,196 9,639 10,086Sheep meat production was belowtarget due to the 2008/09 droughtwhich led to a lower lambing percentageand fewer lambs for sale in 2009/10.18
OBJECTIVE MEASURE 2009/10 2009/10 2006-2010 COMMENTARYTARGET ACTUAL AVERAGEOperational (continued)Increase productionvolumes (continued)Beef production(tonnes)9,245 10,268 11,275Beef production was lifted above targetby the achievement of higher carcassweights of sale cattle and adjustments tocapital stock numbers which were drivenby continued dry conditions.Venison production(tonnes)2,170 2,060 2,642Venison production fell below target andthe five-year average due to the earlier saleof deer farms in Taupo.Wool production(tonnes)2,836 2,723 3,011Wool production was below target as aresult of successive droughts reducingopening sheep numbers and thereforelowering number of sheep shorn.Further, farms have also moved to12 month shearing which has reducedproduction flows.Velvet production(tonnes)7.6 11.5 13.0Velvet production was lifted above targetdue to a higher number of stags on handduring harvest.Timber harvested(tonnes)100,000 80,766 82,415Harvesting operations were delayed dueto poor weather and deferral of someoperations to 2010/11.Reduce labourutilisation overtimeOpening (1 July)stock units perpermanent employee2,739 2,590 2,413The utilisation rate decreased in 2009/10 asa result of lower opening livestock numberswhich had been impacted by the 2008/09drought.IncreasereproductiveefficiencyLambing percentage136.4% 134.7% 134.9%The lambing rate was below target andthe five-year average due mainly to poorspring conditions on North Island breedingproperties during 2009.Calving percentage90.2% 86.7% 88.1%The calving rate was below target andthe five-year average due to poor springconditions in 2009 on North Island breedingproperties.Fawning percentage88.1% 84.6% 86.4%The 2009/10 fawning rate was belowtarget and the five-year average due topoor spring conditions in 2009 on NorthIsland breeding properties.Ongoing attention to rectify lowerreproduction rates in deer is being deliveredthrough national workshop initiatives.Promote bestpractice in allfarm operationsFarmPride auditratings – annualaverage for all farms8.0 7.5 7.5<strong>Landcorp</strong>’s farms are audited bienniallyunder the FarmPride quality assuranceprogramme, with a score of 8 out of 10being regarded as satisfactory compliance.In 2009/10 a more analyticalmethodology was introduced to scoreindividual farms on the basis of risk.This more transparent approach resultedin a score lower than target until newpriorities are set in action plans.19
BALANCED SCORECARD 2010OBJECTIVE MEASURE 2009/10 2009/10 2006-2010 COMMENTARYTARGET ACTUAL AVERAGEEnvironmentalFarm withenvironmentallysound practicesFarms with nutrientbudgets prepared andimplemented100% 100% –Nutrient budgeting involves closeassessment of nutrient use and flows oneach farm, of fertiliser efficiency and ofpossible adverse environmental impacts.Budgeting facilitates investigation ofoptions for reducing the impacts, if any, onadjoining land or waterways. In 2009/10, allfarms continued their nutrient budgeting.<strong>Landcorp</strong> is implementingcomprehensive formalSustainable LandManagement Programmeson all its properties.Even though a majorityof <strong>Landcorp</strong> farms havesome form of sustainablepractice through theFarmPride TM qualityprogramme, <strong>Landcorp</strong>wants to ensure allfarms have a formalsustainability programme.In 2009/10, 14 farmshad formal SustainableLand ManagementProgrammes.The Scorecard’sEnvironmental measuresreflect sustainablepractices encompassed bythese programmes.Protect areasof specialenvironmentalvalueContractors withSpreadmarkaccreditation forfertiliser applicationFarmPride auditratings – annualaverage of all farmsfor assuranceon environmentalpracticesAdditional covenantson protectedareas registered inthe yearFarms with fencingaround riparian zones,wetlandsand waterways100% 100% –The Spreadmark code of practice givesassurance that fertiliser is applied to thehighest standards, at an even rate anddistribution pattern. Accreditation requiresindependent audit. <strong>Landcorp</strong>’s policy is touse only Spreadmark contractors.8.0 7.5 7.5 The FarmPride programme puts emphasison sound environmental practices inrelation to the storage and use of farmchemicals and fertilisers. These practicesinvolve event recording, staff training anduse of certified contractors. FarmPridealso includes the systematic monitoring ofeffluent management on dairy farms.12 30 2750% 60% –The 30 additional covenants brought thetotal at 30 June 2010 to 190 registered withthe Department of Conservation or theQE II Trust Board. These cover 5,409 ha ofland and 22.1 km of riparian strips.<strong>Landcorp</strong> has a programme to progressivelyfence off more areas for protection fromexcess run-off and for water qualityenhancement. Progress in 2009/10 wasabove target.20
OBJECTIVE MEASURE 2009/10 2009/10 2006-2010 COMMENTARYTARGET ACTUAL AVERAGEEmployeesMaintain safe andhealthy workplacesExternalAccreditation of<strong>Landcorp</strong>’s WorkSafe programmeTertiary Tertiary TertiaryAccreditation Accreditation Accreditation<strong>Landcorp</strong>’s Health and Safety programme isexternally audited biennially under the ACC’sWorkplace Safety Management Practices(WSMP) programme. <strong>Landcorp</strong> retained itsTertiary status in the most recent audit, inNovember 2008. This means <strong>Landcorp</strong> is stilloperating at the highest level for health andsafety.Internal audit of<strong>Landcorp</strong>’s Work Safeprogramme – annualaverage compliancerating of all farms6.9 7.0 7.0Each <strong>Landcorp</strong> workplace is subject to abiennial internal audit under the Work Safeprogramme involving external auditors. Anaudit score of 6.5 would satisfy ACC WSMPTertiary requirements.Total workdays lostdue to workplaceaccidents
BALANCED SCORECARD 2010OBJECTIVE MEASURE 2009/10 2009/10 2006-2010 COMMENTARYTARGET ACTUAL AVERAGECustomersProduce animalsand farm productsthat are “fit forpurpose” whensupplied toprocessors andend marketsAverage prime lambcarcass weight (kg)Average prime cattlecarcass weight (kg)16.8 17.1 16.7261.6 264.7 265.6Fewer lambs were finished nationallyin 2009/10 due to lower lambing rates.In order to maximise returns, a greateremphasis was placed on producingheavier lambs.Carcass weights in 2009/10 were abovetarget but slightly down from the five-yearaverage. The difference between actual andfive year average was the result of youngerand hence lighter stock being sold.Average prime deercarcass weight (kg)51.3 53.6 53.7Carcass weights in 2009/10 were higher thantarget due to different classes of deer beingsold compared with plan.Quality Assuranceon animals andfarm productsFarmPride auditratings – annualaverage for all farmsfor assuranceon quality tocustomers8.0 7.5 7.5<strong>Landcorp</strong>’s farms are audited bienniallyunder the FarmPride quality assuranceprogramme, with a score of 8 out of 10being regarded as satisfactory compliance.In 2009/10 a more analytical methodologywas introduced to score individual farmson the basis of risk. This more transparentapproach resulted in a score lower thantarget until new priorities are set inaction plans.Promote the<strong>Landcorp</strong> brandInvestment in ruralsector sponsorships(dollars)150,000 87,920 134,301<strong>Landcorp</strong> continues to support variousprogrammes of benefit to the ruralsector including, in 2009/10, a leadershipdevelopment programme run by NZRural Women, the Queen Elizabeth IINational Trust and Massey University, andscholarships at the Telford and Taratahirural polytechnics.22
INFORMED FARMING<strong>Landcorp</strong> Farming makesincreasing use of technologyand information to promoteproductivity, profitability andsustainability.Developments in 2010 and beyond include:• stronger focus on the individual animal• measurement of performance atevery milking• more data collection andanalysis for breeding selection• research and development forpasture pest control• farming to produce foodand to protect the environment23
INFORMED FARMINGINFORMED LIVESTOCKMANAGEMENTFocus on theindividualanimalElectronic identification of individuallivestock opens new horizons in sheep,deer, dairy and beef cattle farming.<strong>Landcorp</strong> foresees huge benefits in the use ofEID to monitor each animal, and to strengthenherd and feed management for ongoing gainin productivity. Our EID roll-out for sheep,cattle and deer gives <strong>Landcorp</strong> a great newinformation tool – and it also prepares us forindustry-wide livestock traceability.This year, <strong>Landcorp</strong> has EID tagged a largenumber of the calves in its commercial beefherds. All animals in the elite Angus andSimmental breeding programmes are similarlytagged, as are most dairy cows including the10 dairy herds now supported by the newMilkHub system (see pages 27-29). So far EIDhas been rolled out to deer on five <strong>Landcorp</strong>properties.In every case, the animal has a uniqueidentification number encoded in the smallelectronic circuit of its EID tag and this numbercan be “read” with a radio frequency device.Numbers picked up in this quick and accurateway can be stored digitally and matched withan array of other data on the animal. Suddenly,<strong>Landcorp</strong> farm managers have an expandingcomputer record on individual animals – andthe ability to analyse factors contributing totheir growth and health. Gone are the days ofdecision making based only on herd averagesor the experienced eye of the farmer!With EID and the correct software, farmmanagers can easily build a profile of eachanimal – date of birth, parentage, healthtreatments, feeding history, milk production,weight gains (or losses) and more. Suchdata and its analysis can be used to informfeed allocation, herd composition, breedingselection and the other critical decisionsbeing made through the farming year.<strong>Landcorp</strong> recognises that the technology isgreat but only if managers and farm staffhave matching knowledge and skills. Trainingsessions in data collection through EID andin use of relevant software on the farm officecomputer are, therefore, integral to theroll-out.Yearling dairy heifers weighed and identified bytheir EID tags (white) on the Blairs property, Wekaon the West Coast. Tags were applied to theseanimals around seven days after birth, makingregular two-monthly weighing of them much easier.Senior shepherd Bill Hobbs records the identifierwith a radio frequency reader as the animal’s weightis automatically logged on a portable computer.<strong>Landcorp</strong> began EID tagging the right ear of calvesin 2008 (the left ear has a yellow Animal HealthBoard tag).24
Each hind on Raft Creek Farm, nearHokitika, can be identified by its EIDtag. The property carries around 700pregnant hinds, half of these in an elitered deer breeding herd. Raft Creek, amixture of alluvial and pakihi soils in theKokatahi Valley, was the first commercialdeer farm on the West Coast.As EID-tagged cows leave the dairy at Bell Hill onthe Weka complex, those which under perform orhave other issues can be electronically drafted fromthe herd. As each animal moves down the race, itsidentifier is picked up by radio frequency readers. Ifcritical indicators have been detected about that cowduring milking, the drafting gate can be programmedto automatically open. It can be operated remotelyalso by a shed hand. On completion of milking, thosecows drafted out can be given the attention needed formaintenance of the herd’s performance.25
INFORMED FARMINGINFORMED LIVESTOCK MANAGEMENTCONTINUED“It’s a valuable tool forincreasing the level ofprecision in all decisions andultimately, for getting betterresults in terms of both deergenetics and commercialproduction.”Raft CreekFarm managers like Steve Wright, on RaftCreek are embracing the technology tofine tune their management of herds andfeed. Raft Creek has one of <strong>Landcorp</strong>’s threeelite red deer breeding herds, and individualidentification of these animals along with theproperty’s commercial herd has become acore component of Steve’s operation. He hasbeen EID tagging fawns at age 2-3 monthssince 2007. Raft Creek now has a digitalrecord on every hind, including data on itsbirth, vaccinations, the paddocks it has grazed,fertility and movements in weight. Recordscan be easily updated when an animal’s EIDtag is read at every weighing or treatment inthe yards.Indeed, Steve weighs more often nowbecause EID makes it so much easier. Thedeer’s identification and weight are recordedelectronically as it steps onto the scales, andthe two numbers are automatically matchedwith other details on the database. “It hasbecome much easier to see whether eachanimal is going forward or back, and thealarm bells go off more quickly when healthissues show up,” he says. Having such dataat his fingertips helps Steve better utilise the485-hectare property’s mix of developedpasture and peat bog, and its combination ofhigh rainfall and high sunshine. He can maketruly informed decisions on which animals tofeed more, to treat for health issues and topromote within the breeding programmes.“It’s a valuable tool for increasing the level ofprecision in all decisions and ultimately, forgetting better results in terms of both deergenetics and commercial production.”A hind’s weight is automatically recorded in mid May 2010, the animal having gained4 kilograms since February (representing an average daily gain of 0.05 kg between weighings).The hind’s number on Raft Creek, 111, has been read off its EID tag.Farm Manager Steve Wright reads the EID tagon a young hind while it is safely immobilisedin a crush on Raft Creek.The radio frequency reader picks up the hind’sunique identifier and logs this on a portablecomputer for later downloading into thefarm’s animal database.TRACEABILITY<strong>Landcorp</strong> has a clear focus on EID for traceability purposes as well as productivity. Ourroll-out plugs directly into the forthcoming National Animal Identification and Tracingsystem (NAIT), due for implementation across all New Zealand cattle farming in late 2011,and deer farming in 2012. Under NAIT, eartags that can be radio frequency read on-farm,in saleyards and at processing sites will become mandatory. Each animal, its movementsand other details will be captured on a national traceability database for biosecurity, foodsafety and market access purposes. As the EID roll-out continues, <strong>Landcorp</strong> will increasinglyaggregate and share data between its farms, using the most appropriate software andbroadband communication. We are making sure we will be ready for NAIT.26
Sensors on milk lines from each bail in the dairytake a recording every time a cow is milked. Asmilk flows through the sensor, a high frequencyelectrical signal is used to develop a “milk-outsignature” for each cow. The system analysesvariations to indicate signs of mastitis, cow yieldand other performance issues.INFORMED MILKINGMeasurementat everymilkingSome cows produce more milk than others. Boosting thenumber of high performers in the dairy is good for herdproductivity and ultimately financial returns.<strong>Landcorp</strong> uses MilkHub to see exactly howeach cow is performing – and the informationguides decisions on herd composition, healthtreatments, feeding and more.MilkHub is a dairy management systemwith in-shed devices that “sense” theattributes of milk from each cow, and withsophisticated data gathering and analysiscapabilities. MilkHub, combined withelectronic identification of individual animals,puts a powerful information tool in thehands of <strong>Landcorp</strong> managers, on-farm andin Wellington office. It also enables them toautomate some basic functions in the dairy.This world-leading technology has beendeveloped in New Zealand since 2001, withcollaboration from <strong>Landcorp</strong> over the pastfour years. MilkHub now operates in 10 ofour dairies and the roll-out continues. Weare beginning to see big benefits in terms ofhigher milk production and reduced somaticcell counts, and of savings in drug and feedcosts and in reduced need for traditionalherd testing. Now, key attributes of theproduction from each cow are visible at everymilking and without the milk being touched!First and foremost, MilkHub gives an accuratemeasure of milk yield at every milking,along with indications of any mastitis inthe cow and any malfunction in the milkingequipment. Each animal’s performance canbe monitored from day to day and in relationto the herd average – and decisions thenmade on detailed information. “If you have1,000 cows you can split them any wayyou want to give higher performers moreor less feed, to feed up low performers or todraft them out of the herd altogether,” saysPeter Aitken, Farm Business Manager on theWeka complex. MilkHub has been working inWeka’s Bell Hill dairy since August 2009 andit has been built into the new dairy on theneighbouring Blairs unit, opened in June 2010.27
INFORMED FARMINGINFORMED MILKING CONTINUEDElectronic identification is integral to MilkHub. Aseach cow steps into a milking bail, its EID eartag isread and the unique identification number on thattag sent to a MilkHub base unit in the nearby dairyoffice. The number is matched with data beinggathered from milk flow and compared with thatcow’s previously-recorded “milk-out signature”.The MilkHub System has wireless connections toeach component in the dairy – milk flow sensors,EID readers, digital display screens, on/off switchesand key pads for manual data inputting. It also hasa broadband connection to <strong>Landcorp</strong>’s centralisedinformation system.In the dairy shed on Bell Hill, Dairy Farm Assistant Steve Noble puts cow information into the MilkHub system(top). Managers Phil McKenzie and Peter Crouchley discuss data available to them in MilkHub reports after amilking. The report shown here gives trend lines for one cow in the herd on Bell Hill. The red line is the mastitistrend, while blue is the yield trend and green, the weight trend.ReturnsEach MilkHub installation is a significantinvestment but <strong>Landcorp</strong> expects substantialfinancial payback. Our analysis shows a 33 percent internal rate of return over 10 years ontypical investment at a site that milks 1,000cows through the season. Such high return isbased on increasing the herd’s yield (throughculling poor performers and better targeting offeed), reducing somatic cell count, and overallsavings on feed and drug costs. MilkHub hasthe analytical capabilities to quantify suchgains, for the purposes of investment planningas well as ongoing farm management.MilkHub’s strengths include connectivity withour centralised information system. Off-farmstaff can access data gathered at each milkingand generate statistical reports, all via theinternet. This gives MilkHub another layer ofvalue to <strong>Landcorp</strong> with the performance ofcows and herds on various properties able tobe analysed and compared. Management ofour dairying operations can be strengthenedat all levels. <strong>Landcorp</strong> recognises that thevalue of technology can only be secured whenpeople have the knowledge and skills to useit properly. Training is an integral part of ourMilkHub roll-out, which is set to encompassanother five farms during 2010/11.Development<strong>Landcorp</strong> has helped Radian Technologydevelop MilkHub through its trial use inselected dairies, and through practical adviceon how to make the system more user-friendlyand more analytical. Managing Director DrRoss Nilson says some component parts of thetechnology can be found overseas, but Radianhas developed highly integrated hardware andsoftware to form a system with unrivalledfunctionality. It provides data at any time,during milking or when the farmer wants tolook closely at productivity and profitability.“It’s great to work with <strong>Landcorp</strong> as a farmingenterprise that focuses on how it can be moreprofitable as well as on the operational detailsof milk production and herd management,”says Dr Ross Nilson. <strong>Landcorp</strong> will help Radianto develop MilkHub so that it can gatherand analyse more information with an evenbroader range of uses.28
MilkHub’s strengths include connectivitywith our centralised information system.Off-farm staff can access data gatheredat each milking and generate statisticalreports, all via the internet.Once milked, cows leave the dairythrough a drafting race. EID readersidentify each animal and the MilkHubsystem can be programmed toautomatically draft out cows thatwarrant attention because of theirmilk attributes or for other herdmanagement reasons.29
INFORMED FARMINGINFORMED BREEDINGMore datafor breedingselectionGenetic progress in livestock is core business for <strong>Landcorp</strong>.We use complex breeding values (BVs) for the selection ofanimals that will strengthen economically-desired traitsin future generations of sheep, cattle and deer. Work onthe development and application of BVs is ongoing, onthe farm and in the laboratory.We have consistentlyhigh “ rates of accuracy inrecording and matching …testament to the level ofeffort put into these tasks,often out in the paddock inall weathers.”The <strong>Landcorp</strong> Waihora Romney BreedingScheme is an excellent example of steadyprogress in the maternal traits of NewZealand’s most favoured sheep breed. Today’sWaihora flock is the product of over 40 years’rigorous on-farm selection to raise fertility andprogeny weights, and for the past 17 years,to also build resistance to facial eczema. Theresults speak for themselves. Breeder andFarm Manager Ken Burt says scanning of theprogramme’s 2,735 Romney ewes this yearindicated a potential lambing rate of 210 percent, with a substantial portion of the flockcarrying triplets. He says susceptibility to facialeczema has been significantly reduced.In addition to <strong>Landcorp</strong> farms, WaihoraRomney rams are sold to other farmersthroughout New Zealand while many of thesurplus ewe hoggets go to other <strong>Landcorp</strong>properties in the Central North Island. “Evenanimals from the bottom end of our breedingscheme are as good as or better than any incommercial flocks throughout the country,”says Ken. The best lambs born each year areused for breeding in the next season in thisintensively-managed programme, which isnow based on <strong>Landcorp</strong>’s Goudies Station tothe east of Taupo. (The scheme was movedfrom its historic home on the former WaihoraStation, western Taupo, in 2008).Data collectionKen Burt and his team record a wealth ofdata on every animal through the year. BVsare estimated on a wide range of maternalperformance traits – number of lambs weaned(in the case of ewes), and weight at weaningand several times thereafter, and ultrasoundscanning of young rams for carcass muscledimensions, along with resistance to facialeczema. The values are combined into aselection index which is used to decide whichanimals will be retained in the breeding flockbefore each mating. Data collection on eachlamb starts with it being electronically eartagged and blood sampled at docking. Tagsenable animals to be automatically identifiedfor the remainder of their time on Goudies.Blood samples enable DNA analysis andthe matching of parents and progeny. “Theprogramme’s whole integrity and our successas breeders depends on the accuracy in ourdata and in our matching of animals, and onour thorough analysis of indicators,” says Ken.“We have consistently high rates of accuracyin recording and matching … testament to thelevel of effort put into these tasks, often out inthe paddock in all weathers.”On-farm experience has also highlighted theimportance of nutrition for pregnant ewes andlambs – and Ken is a strong advocate of goodbody weight being maintained throughout ananimal’s life. For Romney ewes, he says, thegoal is to keep their weight constant betweenweaning and mating, and then have it increasethrough to the period of lambing. “Fromexperience, we know this pays off in improvedweaning weights in the next generation,”he says. “I have no concerns about tripletsurvivability when the ewe is being fed well.We’ve seen the three lambs come in withweaning weights of 30kg under this scenario.”Obviously that is a good place to be startingthe next cycle of on-farm breeding selection.Genomic valueThe future will bring a new level of precisionto the selection process, with the adventof genomic breeding values (gBV). NewZealand biotechnologists are at the forefrontof international research into the sheepgenome – the encoded sequence of hereditaryinformation that is the most fundamentaldeterminant of an animal’s physical traits.Alongside this basic science, John McEwanand his team at AgResearch’s InvermayResearch Station, Mosgiel, have also developeda method for identifying and comparingthose parts of the sheep genome in Romney,Coopworth and Perendale breeds mostassociated with economically-desired traits.It is a complex process of identifying variationsin the DNA or, more specifically, variations inthe sequence of “nucleotides” that make upeach piece of DNA. These variations are thenmapped onto the already-observed strengthsand weaknesses of animals in terms of growthrate, leanness in the meat, resistance to facial30
AgResearch scientist John McEwanplaces chips imprinted withsheep DNA into the i-Scan unit atInvermay. Each chip has DNA from12 animals and the unit “reads” thesequence of nucleotides in eachpiece of DNA, looking for significantvariations. John is the PrincipalScientist in AgResearch’s GenomicsSection and he was namedNew Zealand’s Biotechnologist ofthe Year in 2010. Senior ResearchAssistant Dianne Hyndman keepsmeticulous records of the process.eczema and other economically-preferredtraits. The research has been funded by Beefand Lamb New Zealand as part of a jointventure with genetics company Ovita.A new test for six traits is due to becomecommercially available to <strong>Landcorp</strong> and otherbreeders, and over time this will extend toaround 15 traits as more findings are made.By taking DNA from a lamb’s blood sample,we will be able to predict that animal’s likely“molecular breeding value”, or mBV, forgrowth rate and so on with a high level ofprecision and at a younger age. The new “DNASNP test”, based on analysis of nucleotidesequences, will enable each lamb to be given amBV which can then be combined with moretraditional BVs to create a single gBV.John McEwan says the test is enabled by newtechnology for imprinting up to 2 million SNPtests onto a postage stamp size piece of glassfrom which the information can be read bythe equivalent of a high quality digital cameraattached to a microscope, and then analysedusing sophisticated computer programmes.The research has been based on blood samplesfrom 8,700 New Zealand sheep, many of thesefrom <strong>Landcorp</strong> breeding flocks. “<strong>Landcorp</strong>’sbreeding programmes make a very valuablecontribution, because they are well structuredand involve detailed record keeping on a largenumber of animals,” says John.<strong>Landcorp</strong> is keenly awaiting the new DNA testfor use in its sheep breeding programmes –Lamb Supreme and Texel terminal sire schemesas well as Romney and Landmark maternalprogrammes. Head of Genetics Geoff Nicollsays application of the new gene sciencewill, in time, bring a leap forward in breedingselection. “It will bring a major shift from thestandard methods of genetic improvement,to more complex methods combining realgenomic and recorded trait information thatenables selection with much greater precision,”says Geoff. “This improved accuracy ofselection will result in faster rates of geneticgain – particularly in traits that are poorlyinherited or expensive to measure”.At Invermay, John McEwan sees <strong>Landcorp</strong> at theforefront of advances that will bring economicbenefits to all pastoral farming over the comingdecade. “We can reasonably expect that thewidespread take-up of genomic breeding valuescoupled with better use of existing technologywill double the rate of genetic progress in theNew Zealand industry,” he says.Ewes in the Waihora RomneyBreeding Scheme on GoudiesStation, central North Island.31
INFORMED FARMINGINFORMED PEST CONTROLR&D forpasture pestcontrolManuka beetle is competing with livestock for thepasture on West Coast dairy farms. <strong>Landcorp</strong> is leadingthe fight back with research on the costly pest, and withdevelopment of biological and other controls.Our initiative includes sharing new informationand ideas with other farmers who are equallykeen to knock back a problem comparablewith grass grub, that scourge of New Zealandagriculture in decades past.Manuka beetle is a particular issue on the WestCoast where its natural habitat is the nativetree species of the same name. Dairy farmdevelopments by <strong>Landcorp</strong> and others havecertainly boosted productivity in the region –but they have also created favourable groundconditions for the insect which eats grass rootsand kills patches of pasture.AgResearch entomologists began work onmanuka beetle five years ago and <strong>Landcorp</strong> haspicked up the baton with an R&D programmeon our Cape Foulwind dairy complex, nearWestport. Farm Technician Jessica Shaw hasbeen studying the manuka beetle’s lifecycleand habits intensively since late 2008. Withongoing AgResearch supervision and supportfrom other farmers, she is exploring a rangeof biological controls and farm managementpractices to stop the pest from denting theperformance of developed dairy land on CapeFoulwind and throughout the region.Flipping, where the ground has beensystematically turned over to break up theironstone pan leaves a lightly compactedsandy loam which is attractive to manukabeetle. On parts of the Foulwind complex,developed through flipping in 2002 and 2003,infestations appear as patches of pulled anddead grass that require re-sowing. The landis far more productive than pre-developmentbut manuka beetle damage is taking the edgeoff. Farm Business Manager Paul Hateleyestimates that up to 20 per cent of potentialdairy pasture on the complex during the2008/09 season was lost due to the pest.That equates to a 10 per cent reduction in thenumber of cows.Research<strong>Landcorp</strong>’s R&D is focused on a detailed studyby Jessica Shaw of the beetle’s breeding andfeeding habits. She found that, in fact, thereare two distinct species. Females of the morecommon species (Pyronota festiva) can flyrelatively long distances and actively seek newareas of pasture to colonise. The second, lesscommon species (Pyronota setosa) fly onlyshort distances before burrowing into theground to lay eggs with the larvae producingmore localised damage. Most manuka beetleeggs are laid in January and February, and thelarvae cause the damage feeding in autumnand winter. Infestations can be heavy andJessica has found up to 300 larvae per squaremetre in some locations. Her study hasincluded trapping sample adult beetles on thewing in spring and summer,(continued on page 34)Jessica Shaw and Paul Hateley examine manukabeetle infestation in a paddock on the Totara dairyunit, Cape Foulwind. This paddock has already beenre-sown twice since its establishment after flipping in2002. Larvae generally begin feeding in mid April withpasture damage occurring in the months that follow.32
Our initiative includes sharing newinformation and ideas with other farmerswho are equally keen to knock back aproblem comparable with grass grub, thatscourge of New Zealand agriculture indecades past.Each captured beetle is identified byspecies and sex. The festiva species isthe more common, with a brown stripedown the back. A second species,setosa, has a distinctive gold stripe onits back and is less common.Far left: Jessica Shaw clears oneof many traps three times weeklybetween October and Februaryto monitor beetle numbers andspecies, and the grass and soiltypes they are most attractedto. The winged adult beetleshit the upright perspex sheetand fall into the pan of waterbelow. Jessica extracts eachfor identification under themicroscope. The biology graduatefrom the University of Canterburyjoined <strong>Landcorp</strong> in November2008 to undertake the researchon the Cape Foulwind complex.33
INFORMED FARMINGINFORMED PEST CONTROL CONTINUED“In the end, we know thatthere will not be one silverbullet against manuka beetle.No one control method willwork in all situations, andfarmers will probably dobetter by using two or threemethods in combinationto support their particularpasture types and farminggoals.”with each trapped beetle recorded andexamined to identify species and sex. “There’sa lot of digging and larvae counting … a lot oftrapping adult beetles and examining themunder a microscope,” says Jessica. “We’relooking for the best times to disrupt theirlifecycle … probably in April when the largestnumber of larvae are feeding close to thesoil surface.”As part of the project, <strong>Landcorp</strong> works withAgResearch and a Sustainable Farming Groupof local farmers who have agreed to gatherand share information on the beetle and onpractical responses to the problem. The groupincludes three other private farmers, with afurther three who are regular participants.All are seeking efficient means of manukabeetle control that are preferable to sprayingpastures with organophosphates. The work hasproduced some very promising ideas.ControlsPossible controls include a naturally-occurringfungus that is toxic to the larvae. AgResearchcultivated samples and drilled these into thesoil in selected trial plots. Over four weeks,Jessica studied the impact – and pleasingly, thefungus appeared to infect the larvae and stoptheir growth. Further trials are underway.Other R&D streams put a focus on grass andsoil fertility, <strong>Landcorp</strong> and its partners arelooking for the grasses that are most resistantto manuka beetle while also thriving inWest Coast conditions and having adequatefeed value. AgResearch has undertakenlaboratory trials on various grasses and theSustainable Farming Group has taken thisline of investigation into the field. On CapeFoulwind’s Totara dairy unit, cows will nowbe systematically grazed on different grasses,at different stocking rates. Jessica says a mixof fescue and clover seem hardier and lessattractive to manuka beetle larvae, whichapparently prefer ryegrass. Higher soil fertility,more organic matter and more vigorous grassgrowth could also be part of the answer. Thegroup has trialled different fertiliser regimeson nine paddocks. “The higher the fertility ofthe soil, the thicker the sward of grass andthe harder it is for the beetle to get the upperhand,” says Paul Hateley. “On the other hand,that would be partly a matter of growing somegrass just for the beetle to eat!” One of thecurrent trials involves the spreading of effluenton pasture and monitoring has shown thatpastures treated with effluent appear to havelower numbers of larvae feeding.Stocking rates make a difference as well.The group is exploring the impact of moredense feeding patterns that turn the cowsthemselves into a control mechanism – theycrush the larvae under hoof. Still other workhas focused on the application of slow releaseinsecticides of the kind commonly usedagainst grass grub in other regions of NewZealand. “The results have been encouragingwith visible differences found between treatedand untreated plots,” says Jessica. “In the end,we know that there will not be one silverbullet against manuka beetle. No one controlmethod will work in all situations, and farmerswill probably do better by using two or threemethods in combination to support theirparticular pasture types and farming goals.”Totara Dairy Farm Manager Glen Hooperlooks for signs of beetle infestation in apaddock used for grazing his cross bred herd.Infestation tends to be worse on drier sandy soils below the ridge lines on undulating pasture.Once established in an area, the female setosa beetles lay their eggs close to where they emerged as an adult.This results in an increasing number of brown dead grass patches.34
Information sharing. Mararoa Farm Manager Tim Smith (right) discusses the afternoon’s work with StockManager Dan Hall. Mararoa Station’s tussock and grass hill country is used for deer breeding. Much of theproperty is spread out beyond, with the foot hills of Mount Prospect Station in the background.INFORMED LAND USEFarming toproduce andprotectPastoral farming and environmental protection cancoexist on the same landscape. Indeed with careful farmplanning and well-informed management, they cansupport each other to thrive. <strong>Landcorp</strong> is proving thepoint on Mararoa Station, in Southland’s Te Anau Basin.Mararoa is an extensive but intensive sheep,beef and deer operation with 5,440 hectaresof pasture, feed crops, tussock and scrublands, plantation forestry, riparian strips, andretired conservation areas. Land and watermanagement reflect a keen appreciationof the property’s natural attributes as wellas farming imperatives. Farm Manager TimSmith takes both into account in all decisionmaking. “We want to farm with a strongunderstanding of all the variables that areaffecting livestock, feed production, waterquality, ground conditions, slope stability andso on … and not to focus on one thing at theexpense of everything else,” says Tim.Nature has never made farming easy onMararoa. The terrain is a mix of hill country,steep-sided valleys and river flats with threewater catchments, each feeding the MararoaRiver on one boundary of the property. Itsattitude varies from 340-600 metres. Winteris a long 120 days, summer can be hot anddry, and severe storms can sweep in at anytime of year.These challenges aside, <strong>Landcorp</strong>’sdevelopment over the past 10 years hasturned Mararoa into a very successfuloperation. In 2009, for instance, the lambingrate rose to 148 per cent and calving to 94per cent. Under Tim Smith’s management,deer breeding and finishing has becomeanother of the station’s strengths. The deerunit is 1,900 hectares and winters 4,300hinds and 2,500 weaners. A further 400hectares will be converted for deer in thenear future. Expanding the finishing areawill enable more deer to be finished onthe property without the losses inherentin being transported to other <strong>Landcorp</strong>properties. Farming outcomes on Mararoadefinitely reflect management that takesaccount of all variables, including those thatcannot be controlled.35
INFORMED FARMINGINFORMED LAND USE CONTINUED“It’s largely a matterof getting more preciseinformation about whatis actually happeningon the farm and why …and being sustainablein both productive andenvironmental terms.”Mararoa’s stock water supply is supplemented bya pump that is powered by ground water seepingfrom one of the property’s hills. The spinningPelton wheel drives the pump which pushes200,000 litres a day 180 metres above the pumpsite to two storage tanks, from where it is gravityfed through 120km of pipes to 200 stock troughs.And it is all done using only gravity! Tim had thesystem designed when alternative electricitypoweredpumps emerged as uneconomic.Extensive areas have been protected for their environmental value.The property has 334 hectares under QE II covenant, many being fencedwaterways and tussock lands.Protected areasExtensive areas have been protected for theirenvironmental value. The property has 334hectares under QE II covenant, most of thesebeing fenced waterways and tussock lands.They include 14km of the Thomas Burn, astream which flows from the foot hills ofMount Prospect into the Mararoa River. Somecovenants allow for limited grazing among thetussock – something that Tim favours stronglyas a way in which farming can be integratedmore closely with conservation practice. Suchgrazing occurs along parts of the ThomasBurn and regular downstream water qualitymeasurements have shown no detriment.Some hillsides in this catchment andelsewhere are fenced and planted in douglasfir – and as the trees grow these areas, too,will be opened for grazing. During 2009/10, 30hectares went into such forestry (60 hectaresin the previous year).Protection of natural waterways andsurrounding areas is supported by a highlyinnovative system for pumping livestockwater. As nature would have it, water seepsconstantly from gravels on some of Mararoa’shighest ground and this led Tim Smith to lookfor an economic means of reticulation tohis animals. External engineering consultantJohn Scandrett, with assistance from LincolnUniversity, developed a system that catchesthe seepage and pumps much of it across theproperty via a network of pipes and troughs.In fact, the natural water flow off one hillsideis used to drive the pump – the design usesso-called Pelton wheel technology – with noneed for electrical power. The system supplies200,000 litres of stock water a day, andthis enables the exclusion of livestock frommany of Mararoa’s streams, natural wetlandsand ponds.Productive usesFeed supply and animal condition areobviously critical variables for Tim Smith.In managing them, he is introducing afavourability ranking of each paddockand tussock area on the property, relatingattributes such as feed cover, soil fertility andshelter to different options for productiveuse. Paddocks that have good shelter beltsare generally set aside for multiple lambingewes. Tree lanes break the weather, aid grassgrowth and also improve survival rates amongnewborns. Likewise, Tim uses some areas oftussock or scrub for fawning, which is thetime when hinds need most distance frompeople. He has a comprehensive re-grassingprogramme that sees some paddocks rotatedinto swede and kale crops.Some tussock has been over-sown with grassand clover seed to increase grazing valuewithout disruption to the area’s naturalvegetation. Tim has moved away from pastpractices of developing tussock into pasture,especially along valley floors. On parts ofMararoa, conversion has certainly increasedfeed supply but also led to increased floodingand soil erosion that leaves streams heavilysilted. By retiring riparian strips, Tim has notonly improved water quality but also reducedlivestock losses.Tighter integration between conservationand production fits nicely with Tim’s drive forhigher survivability among lambs, calves andfawns, and for higher birth weights. “We’vegot to get away from the old focus on pushingup stocking rates and think more in termsof production per hectare and kilograms ofproduct out the farm gate,” he says. That shiftputs more emphasis on raising productionthrough more attention to year-round feedingof females, and the care of them and newoffspring, “It’s largely a matter of gettingmore precise information about what isactually happening on the farm and why …and being sustainable in both productive andenvironmental terms,” says Tim.Note: Tim Smith and wife Trish werecategory award winners in the 2010 BallanceSouthland Farm Environmental Awardsand winners of the 2010 national ElworthyEnvironmental Award sponsored by DeerIndustry New Zealand. See page 15.Hinds in a home paddock36
Tim and Senior Shepherd Kate Gallandmeasure the yield of dry matter in aswede crop five months after sowing.The results will go into careful feedbudgeting for Mararoa’s long winter.Measurement requires bulbs andfoliage from a one metre square patchof the crop to be weighed. As a generalrule, 11 per cent of the total weight isdry matter.37
LANDCORP FARMING LIMITED AND SUBSIDIARIESBOARD OF DIRECTORS 2010Basil MorrisonTraci HoupapaMarise JamesHon. Jim SuttonJane MitchellWarren LarsenFalcon CloustonBill Baylis38
Hon. Jim SuttonChairmanCNZM.Mr Sutton joined the <strong>Landcorp</strong> Board on1 August 2006 as Chairman. Originallyfarming on his own account on a sheep, beefand mixed crop property in South Canterbury,he became Member of Parliament for Waitaki(1984-90). He subsequently representedTimaru (1993-96); Aoraki (1996-2005); andwas on the Labour List (2005-06). He hasbeen Minister for Trade Negotiations,Agriculture, Forestry, Biosecurity and RuralAffairs. Since then he has served as a rovingTrade Ambassador for New Zealand andis currently the Patron of the Russia NewZealand Society.Warren LarsenDeputy ChairmanCNZM, BBS, CA, CMA, MAgSc(Hons), FNZIM,AF Inst D, DSc(Hon).Mr Larsen was appointed to the <strong>Landcorp</strong>Board in May 2006 as Deputy-Chairman.He is a Principal in Larsen Consulting Ltd,Chairman of Centreport Ltd, and a directorof Air New Zealand, Jenkin Timber Ltd andthe Foundation for Research, Science andTechnology. He was formerly Chief ExecutiveOfficer of, respectively, Bay Milk Products andthe New Zealand Dairy Board and was closelyinvolved with the creation of Fonterra. Heis an alumni of the INSEAD Business Schooland has had significant international businessand marketing experience, particularly in thepastoral export industries.A W (Bill) BaylisM.Comm (Hons), FCA, FNZIM, AF Inst.D.Mr Baylis was appointed to the <strong>Landcorp</strong>Board in November 2009. He is currentlyChairman of Blackhead Quarries Ltd, RealJourneys Ltd and South Canterbury FinanceLtd; and a director of Port of Tauranga andseveral other companies. He has held anumber of appointments in the agriculturalsector and is currently Chairman of theAccreditation Board of the Institute ofDirectors in New Zealand. He has practisedas a Chartered Accountant, as a principal inKPMG and its predecessor firms from 1969,and from 1992 on his own account.Falcon CloustonBAgSc, AF Inst D.Mr Clouston is a Wellington-based InvestmentBanker and Business Consultant, appointedto the <strong>Landcorp</strong> Board in May 2006. He hasundertaken extensive consultancy to ruralbusinesses. Mr Clouston has previously beena member of the Government Task Force onPrivate Provision for Retirement and of theSecurities Commission. His other currentdirectorships include Palliser Estates Winesof Martinborough Ltd, Perpetual FundsManagement Ltd, and Kirkcaldie and StainsLtd. He is a member of the NZ MarketsDisciplinary Tribunal and the NZICA AppealsCouncil; and a trustee of the NZ Red CrossFoundation.Traci HoupapaJP, MBA.Ms Houpapa joined the <strong>Landcorp</strong> Board in May2010. She co-owns THS and Associates Ltd,a Hamilton-based consulting firm providingprofessional advice in strategic and businessplanning and organisational development topublic and private sector clients throughoutNew Zealand. Her other directorships includeStrada Corporation Ltd, Pemberton ConstructionLtd, and the Waikato Bay of Plenty NetballFranchise. She is Chairman of the Federationof Maori Authorities, a trustee for a numberof Maori authorities and community groupsand a <strong>Crown</strong> appointee on the Waikato RiverGuardians Establishment Committee.Marise JamesCA, Nuffield Scholar.Mrs James is a Chartered Accountant appointedto the <strong>Landcorp</strong> Board in April 2003. She is apartner in a New Plymouth-based accountingfirm and has directorships in Farmers MutualGroup Ltd, Farmers Mutual Finance Ltd, StaplesRodway (Taranaki) Ltd and the NZ Institute ofHighway Technology. She is a trustee for theTSB Community Trust. Mrs James has a broadbackground in the dairy industry first as ashare-milker and then as a farm owner; andshe was a board member of Dexcel Ltd and theFonterra Cooperative Group Ltd.Jane MitchellBAgSc, M Prof Studs, Nuffield Scholar.Ms Mitchell was appointed to the <strong>Landcorp</strong>Board in May 2009. She has extensiveexperience in primary industries. Over thelast 25 years she has owned and leasedfarms in Marlborough and Central Otagofarming sheep, beef, deer, and small seeds.She also has interests in the aquaculture andfishing industries. Ms Mitchell is a qualifiedsoil conservator and has a strong interest inresource management and environmental issues.She has been chairman or member of numerousfarming industry bodies. In 2010 she graduatedwith a Masters of Professional Management(Agribusiness) and retired from membership ofthe Otago Polytechnic Council.Basil MorrisonCNZM JP.Mr Morrison joined the <strong>Landcorp</strong> Board in May2008 and has had significant roles in bothcentral and local Government. He has beenPresident of Local Government New Zealand, isa past Chairman of the Commonwealth LocalGovernment Forum and was an elected memberof the Ohinemuri County, Hauraki DistrictCouncil (as Mayor) and Environment Waikato.Currently he is a director of Civic Assurance,Chairman of the NZ Local GovernmentSuperannuation Board of Trustees, a memberof the Waitangi Tribunal, the NZ ConservationAuthority and the NZ Geographic Board andtwo committees associated with lotteriesfunding of significant projects and communities’facilities. Mr Morrison farmed on his ownaccount for 22 years and is a director andshareholder of Waiuta Farms Ltd.EXECUTIVE GROUP 2010Chris KellyMV Sc, MACVSc, AFInstD.Chief ExecutiveJohn Kennedy-GoodBA, LLB (Hons), LLM (London),Barrister & Solicitor.Company SecretaryCollier IsaacsB Ag Sci, Dip BS (Ag Bus),NZIPIM.National Manager – Services& StrategyRichard PerryB.Com (Hons), CA., C.T.P.Chief Financial OfficerGerry SoanesDip Ag, Dip VFM, ANZIV,SPINZ, MNZSFM, Reg Valuer.National Manager – PropertyGraeme MulliganB. Ag Com, VFM, SPINZ,NZIPIM, Reg Valuer.National Business ManagerAllan StillB AgCom, SPINZ, NZIPIM,Reg Valuer.National Business ManagerLex Henry retired from the Board in October 2009 and Mavis Mullins in April 2010.39
LANDCORP FARMING LIMITED AND SUBSIDIARIESCORPORATE GOVERNANCE<strong>Landcorp</strong> Farming Limited<strong>Landcorp</strong> is a limited liability company with shareholdingowned by the <strong>Crown</strong>. It is also a State-Owned Enterprise(SOE) under the State-Owned Enterprises Act 1986 (the Act).The company is committed tooperating an efficient, effectiveand profitable business which,in terms of the Act, has theobjectives of being –• As profitable and efficient ascomparable businesses notowned by the <strong>Crown</strong>;• A good employer; and• An organisation whichexhibits a sense of socialresponsibility havingregard to the interestsof the communities inwhich it operates andby endeavouring toaccommodate or encouragethese interests when able todo so.We pay close attention to theseobligations and continue to meetor exceed related expectationsyear after year.The ShareholdersAs an SOE, <strong>Landcorp</strong>’s twoshareholders are the Ministerfor SOEs and the Ministerof Finance. There are regularcommunications with theshareholders and the <strong>Landcorp</strong>group is required to provideshareholding Ministers withits annual business plan and aquarterly report on performanceagainst that plan. A Statementof Corporate Intent, Half-YearlyReport with unaudited halfyearlyaccounts and an AnnualReport with audited year-endaccounts are tabled in Parliamenteach year.Under a “no surprises” policy,shareholding Ministers andtheir officials are kept informedon an on-going basis aboutany significant developmentsaffecting the company.The BoardThe company’s constitutionprovides for the parent Boardto comprise up to nine nonexecutivedirectors, includingthe chairman. Directors areappointed by shareholdingMinisters for fixed terms notexceeding three years. Ministersmay renew appointments forfurther terms. Directors arerequired to be independentof any relationship withmanagement and free of anybusiness or other relationshipthat either could, or could beperceived to, materially interferewith the exercise of theirunfettered and independentjudgment.During the year ended 30 June2010, directors Lex Henry andMavis Mullins retired and werereplaced by Bill Baylis and TraciHoupapa.All directors have undergonecomprehensive inductiontraining and undertake regularfamiliarisation tours to differentareas of the company’sactivities. On-going educationincludes regular briefing paperson issues of current interest;and opportunities to attendProfessional DevelopmentUpdate sessions organised by the<strong>Crown</strong> <strong>Ownership</strong> <strong>Monitoring</strong><strong>Unit</strong> and courses organised bythe Institute of Directors in NewZealand (Inc).Board’s Role andResponsibilitiesThe Board is responsible forprotecting and enhancingthe value of the business inthe interests of the Companyand group, and the <strong>Crown</strong>as shareholder. This includesmeeting the requirements ofthe SOE Act, the CompaniesAct 1993 and the FinancialReporting Act 1993. There is astrong emphasis on developingand reviewing strategy for thebusiness and overseeing riskmanagement processes andoutcomes.Each year, the Board conductsan evaluation, which examinesits performance and theperformance of the chairmanand each director.The Board supports the values,principles and practices setout in the “Code of Practicefor Directors” issued by theInstitute of Directors in NewZealand (Inc.). These include theexpectations that directors will –• act honestly and withintegrity;• comply with the law;• avoid conflicts of interest;• use company assetsresponsibly and in the bestinterests of the Company;• be responsible andaccountable for their actions;and• act in accordance with theirfiduciary duties.Policies and procedures areregularly reviewed to ensureintegrity standards within theorganisation are maintained andwhere appropriate enhanced. Inaddition, the Board continuesto be guided by the “CorporateGovernance Principles andGuidelines” developed bythe New Zealand SecuritiesCommission, to the extent thatthese are appropriate for a State-Owned Enterprise. These includeadherence to ethical standards,use of committees, financialreporting and disclosures, riskmanagement, relationships withshareholders and the interests ofstakeholders.The respective roles of theBoard and management are welldocumented and understood byboth. There are excellent workingrelationships and a sharedcommitment to the culture andsuccess of the business.Board authority conferred onmanagement is delegatedthrough the Chief Executive, withsub-delegations immediatelybelow Chief Executive levelapproved by the Board.40
Subsidiary Boards,Committees andManagement<strong>Landcorp</strong> has four subsidiarycompany boards. One ofthese, <strong>Landcorp</strong> Pastoral Ltd,comprises all parent companyBoard Directors. The other three,<strong>Landcorp</strong> Estates Ltd, <strong>Landcorp</strong>Developments Ltd and <strong>Landcorp</strong>Holdings Ltd, have as directors,the parent company Chairmanand Deputy Chairman and twodirectors from management.In addition, the main Board hastwo standing committees withclear charters. The Audit andDue Diligence Committee dealswith financial matters includingaudit, risk review and mitigation,insurance, and major legalcontracts. The RemunerationCommittee recommends theallocation of individual directorfees and Chief Executiveremuneration; and overseesstaff remuneration policies.Committee recommendationsare approved by the Board.<strong>Landcorp</strong> is subject to externalaudit by the Office of theController and Auditor General(OCAG) under the Public AuditAct 2001. The OCAG hasapproved Trevor Deed, using thestaff and resources of Deloitte,as its agent to perform the audit.This external audit includesadditional requirements tothe usual financial statementfocused audit, such as reviews ofperformance, waste and probity,procurement policies, reviewof all severance payments andreporting against SCI targets.Internal audit services, coveringfinancial and operational policiesand procedures and areas ofgeneral risk, have been deliveredby an independent accountingfirm, Ernst & Young. The role ofinternal audit and its deliveryare presently under review.Topics for internal audit focusare determined by the Audit andDue Diligence Committee andsenior management.Both external and internalauditors attend the Board’s Auditand Due Diligence Committee,and have direct access to theChairman as required. The Auditand Due Diligence Committeehas regular directors-onlysessions with the auditors,where management is notpresent. The external auditorreports independently, on anannual basis, to the shareholdingMinisters.Within the organisation, thereare procedural documentsapproved by the Board coveringoperational policies andguidelines, financial policies,delegations and employmentmatters. There is a managementcommittee comprising executivestaff and an external advisor,which meets monthly tooversee the Company’s treasuryfunctions and review areasof major financial risk, withinpolicies determined by the Board.Continuous DisclosureFrom 1 January 2010, <strong>Landcorp</strong>,along with other larger SOEs, hasadopted “Continuous DisclosureRules.” Based on similar rulesused by the New Zealand StockExchange, the aim is to ensure“material information” affectingan SOE is made available to thepublic at an early stage.“Material information” is definedas including matters thathave a material effect on thecurrent commercial value of theCompany, dividend declarationsand transactions which represent5% or more of <strong>Landcorp</strong>’scurrent commercial value.Exceptions to the disclosure rulesinclude matters where there isan obligation of confidentiality,trade secrets, incompleteproposals or negotiations,matters of supposition andinformation generated forinternal management purposes.In addition to othernormal company disclosurerequirements, <strong>Landcorp</strong> isalso subject to the OfficialInformation Act 1982, theOmbudsmen Act 1975 andwhistle blowing legislation (theProtected Disclosures Act 2000).Information released under theContinuous Disclosure Rules,key disclosure documents and adescription of the business, arepublished on <strong>Landcorp</strong>’s website.The following table sets out themeetings attended by Directorsduring the year.Board and Committee MeetingsYear to 30 June 2010<strong>Landcorp</strong> Audit and Due <strong>Landcorp</strong> <strong>Landcorp</strong> <strong>Landcorp</strong> <strong>Landcorp</strong>Farming Diligence Remuneration Estates Pastoral Developments HoldingsDirector Appointed Retired Ltd Committee Committee Ltd Ltd Ltd Ltd(12 meetings) (4 meetings) (2 meetings) (4 meetings) (5 meetings) (5 meetings) (4 meetings)Hon. J R Sutton 1.8.06 Chair 12 4 2 Chair 4 Chair 5 Chair 5 Chair 4A W Baylis 1.11.09 6 1 3F R S Clouston 1.5.06 10 3 5L B Henry 11.11.03 31.10.09 1 1 1T Houpapa 1.5.10 2 1M L James 6.4.03 12 Chair 4 5W A Larsen 1.5.06 11 Chair 2 4 5 5 4J M Mitchell 1.5.09 12 2 5B J Morrison 1.5.08 10 1 4M R Mullins 4.4.03 30.4.10 6 1 3C M Kelly 29.10.01 4 5 4B A R Card 25.8.04 31.1.10 3J C Kennedy-Good 24.3.06 4A J Still 24.4.07 441
LANDCORP FARMING LIMITED AND SUBSIDIARIESFINANCIAL RESULTS COMMENTARY<strong>Landcorp</strong> Farming considers net operating profit and total shareholder return to be the measures most relevantto assessments of its financial performance. Net operating profit records <strong>Landcorp</strong>’s profit from farming andother operations after the deduction of interest costs. Total shareholder return is the net change in shareholdervalue during any particular financial period, taking into account both operating profit in that period and changein the value of <strong>Landcorp</strong>’s total assets from the beginning of the period to the end. It is a measure of change inwealth created for <strong>Landcorp</strong>’s shareholders. Results for the latest years are as follows:SHAREHOLDER RETURNSActualSCI TargetsDollars in millions unless otherwise stated 2009/10 2009/10 2010/11Operating profit 10.0 2.5 3.0Total shareholder (8.1%) 5.4% 5.8%return/averageshareholders’ fundsDividend yield 1 1.3% * 0.8%Dividend payout 1 179.8% * 189.5%Return on equity 2 (8.1%) * 5.8%Return on equity adjusted for 8.2% * 6.5%IFRS fair value movementsand asset revaluations 3NET OPERATING PROFITDollars in millions1614121086420REVENUE SOURCESDollars in millions8070605040302005 2006 2007 2008 2009 2010The year brought an unrealised decline in the value of <strong>Landcorp</strong>’sfarm assets, principally due to a general reduction in the prices ofNew Zealand's agricultural commodities and ongoing uncertainty ininternational financial markets (see Notes 28 and 36, pages 80 and89). Total shareholder return in 2009/10 reflected this decline in value,offset partially by one-off profits from sales of farmland ($8.7 million)that arose from an ongoing strategic rationalisation of <strong>Landcorp</strong>’sfarm portfolio. These profits were in addition to the net operatingprofit discussed above. Despite the reduction in shareholder return in2009/10, <strong>Landcorp</strong>’s average annual shareholder return for the fivemost recent years is a positive 8.7 per cent and has been 14.8 percent since incorporation.Net Operating ProfitNet operating profit increased to $10.0 million in 2009/10. Results forthe year reflect the following key drivers:Diversified revenue base<strong>Landcorp</strong> has a diversified revenue base, with an intention thatdeer and dairy operations account for around 50 per cent of totalrevenue. The company also intends to maintain the dollar value ofits income from sheep and beef operations at the same level orhigher from each year to the next. The benefits of this strategy wereapparent in 2009/10 as the level of annual payout to New Zealanddairy producers increased. <strong>Landcorp</strong> was able to offset a reductionin livestock income with higher income from dairying. The RevenueSources graph, below left, shows revenue diversification since 2001.Increase in milk incomeMilk production increased 2.6 per cent in 2009/10, with income rising$16.0 million because of this and the increased level of payout toproducers by dairy companies.Cost reduction<strong>Landcorp</strong> achieved a 3.4 per cent reduction in total expenses, includingan 8.3 per cent fall in farm working expenses. This was primarilydue to the tight control of farm budgets, supported by an easing infertiliser prices after their sharp rises of the previous two years.Interest<strong>Landcorp</strong> reduced interest expenses by $1.4 million as debtlevels declined during 2009/10. That decline was partly a result offarmland sales.201002001 2002 2003 2004 2005 2006 2007 2008 2009 2010 2011TargetMilk Cattle SheepDeerOtherDrought impactsDuring 2009/10, the upper North Island experienced significantdrought, and this led to foregone revenues and higher expensesfor <strong>Landcorp</strong> in the year. The net impact was a reduction in thecompany's net operating profit for 2009/10 by as much as $4.8million. For further explanation see Note 20, page 71.42
TOTAL SHAREHOLDERS’ RETURN ON AVERAGESHAREHOLDERS’ FUNDSDividends<strong>Landcorp</strong> will pay dividends of $18.0 million for 2009/10, Of thistotal, $17.4 million will be diverted back to <strong>Landcorp</strong> in the form ofredeemable preference shares under an arrangement entered intoat the time of the company's Protected Land Agreement with the<strong>Crown</strong> in September 2007.Balance Sheet<strong>Landcorp</strong> had total assets of $1.52 billion at 30 June 2010, downfrom $1.67 billion in June 2009. The change reflected a decrease inthe value of the company’s land and buildings, due principally tothe fall in prices in the New Zealand market and the uncertainty inInternational financial markets. The reduction in values was around11 per cent across all farms. Total assets at 30 June 2010 alsoincluded the effects of revaluing livestock as required under NZ IFRS.Total borrowings of $149.4 million at 30 June 2010 were down 22per cent (30 June 2009: $181.8 million) as <strong>Landcorp</strong> maintaineda conservative funding policy. We continued to set debt levels forcompliance with banking covenants, rather than to maintain anyparticular debt/equity ratio. This approach recognises that asset valuechanges over the past five years bear little or no relation to changesin the debt servicing ability of <strong>Landcorp</strong>. At 30 June 2010, debt todebt-plus-equity was 11.0 per cent and this was consistent withother large-scale farming enterprises.Impact of NZ IFRSThis is <strong>Landcorp</strong>'s third full year of reporting under New ZealandEquivalents to International Financial Reporting Standards (NZ IFRS).As indicated previously, the adoption of NZ IFRS has a significantimpact on <strong>Landcorp</strong>’s profit reporting, due mainly to the requirementthat changes in the market value of livestock be included in netprofit after tax (NPAT). The company would not realise increasesor reductions in such values during the ordinary course of businesswithout selling all of its livestock. It would not be possible to do thisunless <strong>Landcorp</strong> was to exit the business of pastoral farming.In addition, NZ IFRS requires <strong>Landcorp</strong> to account for taxationexpense on changes in the market valuation of livestock even thoughno actual tax expense is likely to arise with IRD. The combinedeffects of NZ IFRS mean that <strong>Landcorp</strong>’s reported NPAT becomes ameaningless measure of performance. The result is unrelated to thefundamentals of the company's primary production business.<strong>Landcorp</strong> takes the view that NZ IFRS is not an appropriate basisfor internal financial management or for management reporting.The company’s publicly-presented financial statements include apresentation of <strong>Landcorp</strong>’s results excluding the impact of NZ IFRS(see Note 5 page 62).35%30%25%20%15%10%5%0%–5%–10%–15%PROFITABILITY2006 2007 20082009 20105 year averageActualSCI TargetsDollars in millions unless otherwise stated 2009/10 2009/10 2010/11Return on capital employed 4 13.2% * 10.6%Operating margin 25.1% * 28.5%Economic value added (12.9%) (0.3%) 0.8%Dividends – Group 18.0 18.0 10.0CUMULATIVE DIVIDENDSDollars in millions4504003503002502001501005001989 1991 1993 1995 1997 1999 2001 2003 2005 2007 2009 2011DeclaredLEVERAGE / SOLVENCYActualSCI TargetsDollars in millions unless otherwise stated 2009/10 2009/10 2010/11Gearing ratio 11.0% 9.1% 11.7%Interest cover 5 3.75 2.98 3.48Solvency 1.64 1.13 2.21CAPITALNet capital expenditure 26.0 (5.0) 9.0* These targets are new for 2010/11.1 Dividend payout in October relates to prior year profit, in this case we have aligneddividends to profit.2 Total comprehensive income/ Average equity.3 Net operating profit plus profit from land sales/ Average equity less revaluation reserves.4 Excludes asset revaluation reserves and includes profit on land sales.5 Includes profit on land sales.43
LANDCORP FARMING LIMITED AND SUBSIDIARIESCows return to pasture after lateafternoon milking on Bell Hill,the Weka complex, West Coast.44
FINANCIAL STATEMENTSAND DISCLOSURE INFORMATION45
LANDCORP FARMING LIMITED AND SUBSIDIARIESContentsStatement of Comprehensive Income 47Statement of Movements in Equity 48Statement of Cash Flows 50Statement of Financial Position 52Notes to the Financial Statements: 541 Reporting Entity 542 Statement of Compliance 543 Summary of SignificantAccounting Policies 544 Significant Accounting Judgements,Estimates and Assumptions 605 Operational Management 626 Livestock Revenue 657 Milk Revenue 668 Wool Revenue 669 Forestry Revenue 6610 Other Produce Revenue 6711 Equity Accounted Investments 6712 Other Gains and Losses 6813 Other Income 6814 Farm Working Expenses 6915 Personnel 6916 Depreciation and Amortisation 6917 Maintenance 7018 Other Operating Expenses 7019 Net Finance Costs 7020 Effect of Drought 7121 Accounts Receivable 7122 Inventory 7223 Property Held for Sale 7224 Livestock 7325 Forests 7526 Other Financial Assetsand Liabilities 7627 Intangible Assets 7928 Property, Plant & Equipment 8029 Accounts Payable 8330 Redeemable Preference Shares 8331 Capital Management 8432 Dividends 8533 Non-cash Transactions 8534 Income Tax 8535 Reconciliation of Profit andOperating Cash Flow 8936 Risk Management 8937 Related Parties 9438 Contingent Assets and Liabilities 9439 Commitments 9540 Subsidiary Companies 95Audit Report 96Disclosures in Terms of theCompanies Act 1993 97Interest Register 97Directors’ Interests 97Use of Company Information 98Share Dealings 99Directors’ Remuneration andOther Benefits 99Employees’ Remuneration andOther Benefits 99Indemnity and Insurance 99Directory 10046
Statement of Comprehensive IncomeFOR THE YEAR ENDED 30 JUNE 2010Group Group Parent ParentNote 2010 2009 2010 2009$000 $000 $000 $000RevenueLivestock 6 83,469 98,464 81,604 97,369Milk 7 70,193 54,164 53,187 40,742Wool 8 5,914 6,020 5,896 6,005Forestry 9 2,735 1,096 2,723 1,153Other produce 10 640 593 640 593162,951 160,337 144,050 145,862Income from equity accounted joint ventures 11 23 382 – –Other gains and losses 12 4,963 5,142 5,076 3,026Other income 13 1,916 8,214 4,922 12,026169,853 174,075 154,048 160,914ExpensesFarm working expenses 14 62,885 68,970 55,054 59,402Personnel 15 42,054 41,501 38,515 37,549Depreciation and amortisation 16 12,557 12,235 10,713 10,275Maintenance 17 10,869 11,239 9,846 9,941Other operating expenses 18 20,109 20,532 19,564 16,647148,474 154,477 133,692 133,814Net Profit before Interest, Property Sales and Revaluations 21,379 19,598 20,356 27,100Interest income 88 89 3,174 6,625Interest expense (11,454) (12,830) (11,454) (12,842)Net Finance Costs 19 (11,366) (12,741) (8,280) (6,217)Net Operating Profit 10,013 6,857 12,076 20,883Profit on sale of land 8,721 3,819 9,643 5,902Loss on impairment of subsidiaries 40 – – (17,854) –Revaluation Gains and LossesGain/(loss) due to price changes on forests 25 55 (2,241) 64 (2,082)Gain/(loss) due to price changes on livestock 24 (4,641) 7,576 (5,807) 14,860Gain/(loss) due to price changes on financial instruments 26 (5,325) (8,049) (5,325) (8,049)Gain/(loss) on revaluation of property, plant and equipment (11,196) (10,199) (11,196) (10,199)Net Profit (Loss) before Tax 20 (2,373) (2,237) (18,399) 21,315Tax expense 34 (3,468) 12,567 (397) 9,776Net Profit (Loss) after Tax (5,841) 10,330 (18,796) 31,091Other Comprehensive IncomeGain/(loss) on revaluation of land and improvements (120,510) (97,908) (121,431) (99,991)Revaluation losses transferred to and recognisedin profit and loss 11,196 10,199 11,196 10,199Gain/(loss) on revaluation of available-for-salefinancial assets (86) (7,112) (106) (4,886)Prior year revaluations transferred to profit or loss ondisposal of available-for-sale financial assets (20) (14) (72) (14)Income tax on income and expense recognised in equity 34 2,783 8,496 2,869 7,828Total Comprehensive Income (112,478) (76,009) (126,340) (55,773)The accompanying notes form part of these financial statements.The directors note that the Net Profit (Loss) after Tax as reported under NZ IFRS includes significant revaluation gains and losses on livestock,land and buildings and financial instruments used for interest rate hedging. These gains and losses are valued at a particular point in time anddo not represent cash flows that are received in the ordinary course of business. Accordingly, <strong>Landcorp</strong>’s dividend is based on Net OperatingProfit. See Note 5 for further information.47
LANDCORP FARMING LIMITED AND SUBSIDIARIESStatement of Movements in EquityFOR THE YEAR ENDED 30 JUNE 2010Group Group Parent ParentNote 2010 2009 2010 2009$000 $000 $000 $000Ordinary SharesBalance beginning of year 125,000 125,000 125,000 125,000Balance end of year 125,000 125,000 125,000 125,000Retained EarningsBalance beginning of year 106,167 108,364 243,064 231,784Net profit after tax (5,841) 10,330 (18,796) 31,091Transfers to revenue reserves 9,966 473 11,132 (6,811)Dividends 32 (10,000) (13,000) (10,000) (13,000)Balance end of year 100,292 106,167 225,400 243,064Revenue ReservesBiological assets revaluation reserveBalance beginning of year 86,065 78,489 86,361 71,501Transfer from retained earnings (4,641) 7,576 (5,807) 14,860Balance end of year 81,424 86,065 80,554 86,361Financial assets revaluation reserveBalance beginning of year (7,307) 742 (7,307) 742Transfer from retained earnings (5,325) (8,049) (5,325) (8,049)Balance end of year (12,632) (7,307) (12,632) (7,307)Fair Value ReserveBalance beginning of year 1,444 6,432 3,762 7,192Recognised in profit and loss on disposal 12 (20) (14) (72) (14)Revaluation of available-for-sale financial assets 26 (86) (7,112) (106) (4,886)Net tax effect on revaluation 34 71 2,138 157 1,470Balance end of year 1,409 1,444 3,741 3,76248
Group Group Parent ParentNote 2010 2009 2010 2009$000 $000 $000 $000Asset Revaluation ReservesFreehold land and improvementsBalance beginning of year 834,674 915,660 727,117 817,532Transfers to other equity on sale (25,493) (1,227) (25,493) (8,573)Net value change during year 28 (119,831) (96,316) (119,831) (98,399)Revaluation losses/(gains) recognised in profit and loss 11,196 10,199 11,196 10,199Tax effect of reserve movements 2,712 6,358 2,712 6,358Balance end of year 703,258 834,674 595,701 727,117Property held for saleBalance beginning of year 16,985 35,768 12,624 31,407Transfers to other equity on sale – (17,191) – (17,191)Value change during year (679) (1,592) (1,600) (1,592)Balance end of year 16,306 16,985 11,024 12,624Other EquityBalance beginning of year 196,621 178,203 185,262 159,498Transfers from assets revaluation reserves 25,493 18,418 25,493 25,764Balance end of year 222,114 196,621 210,755 185,262Total EquityBalance beginning of year 1,359,649 1,448,658 1,375,883 1,444,656Net profit after tax (5,841) 10,330 (18,796) 31,091Other comprehensive income:Loss on revaluation of land and improvements (120,510) (97,908) (121,431) (99,991)Revaluation losses transferred to andrecognised in profit and loss 11,196 10,199 11,196 10,199Gain/(loss) on revaluation of available-for-salefinancial assets (86) (7,112) (106) (4,886)Prior year revaluations transferred to profit or losson disposal of available-for-sale financial assets (20) (14) (72) (14)Income tax on income and expenserecognised in equity 2,783 8,496 2,869 7,828Dividends paid (10,000) (13,000) (10,000) (13,000)Balance end of year 1,237,171 1,359,649 1,239,543 1,375,883The accompanying notes form part of these financial statements.49
LANDCORP FARMING LIMITED AND SUBSIDIARIESStatement of Cash FlowsFOR THE YEAR ENDED 30 JUNE 2010Group Group Parent ParentNote 2010 2009 2010 2009$000 $000 $000 $000Operating ActivitiesCash was received from:Receipts from customersLivestock 86,250 96,325 84,333 95,425Milk 67,405 56,790 48,885 43,696Other receipts from customers 8,868 16,823 11,145 14,908Interest received 62 95 3,312 6,947Dividends received from equity accounted joint ventures 300 1,250 – –Other dividends received 62 28 1,461 5,127Net GST received (paid) 378 (2,650) 961 (4,133)163,325 168,661 150,097 161,970Cash was applied to:Payments to suppliers 98,324 109,997 87,619 93,421Payments to employees 36,164 36,648 33,055 33,534Interest paid 10,746 12,780 11,253 12,735Income tax paid (received) 6 – 135 (1,374)145,240 159,425 132,062 138,316Net Cash Flows from Operating Activities 35 18,085 9,236 18,035 23,654Investing ActivitiesCash was received from:Sale of land and improvements 54,987 33,015 58,947 45,718Sale of other property, plant and equipment 950 891 197 1,092Sale of other investments 4 3,567 1,738 4,26155,941 37,473 60,882 51,071Cash was applied to:Purchase and development of land 18,861 40,821 17,406 35,803Purchase of other property, plant and equipment 9,608 11,828 8,104 10,487Purchase of breeding stock 2,816 2,195 2,647 1,550Purchase of shares and advances 9,653 574 4,062 568Net subsidiary investment – – 13,600 35,29840,938 55,418 45,819 83,706Net Cash Flows from Investing Activities 15,003 (17,945) 15,063 (32,635)50
Group Group Parent ParentNote 2010 2009 2010 2009$000 $000 $000 $000Financing ActivitiesCash was received from:Issue of redeemable preference shares – 13,208 – 13,208– 13,208 – 13,208Cash was applied to:Net borrowing repayments 32,400 5,300 32,400 5,300Dividends paid 33 – – – –32,400 5,300 32,400 5,300Net Cash Flows from Financing Activities (32,400) 7,908 (32,400) 7,908Net Change in Cash and Cash Equivalents 33 688 (801) 698 (1,073)Cash and Cash Equivalents at beginning of year 30 831 711 1,784Cash and Cash Equivalents at End of Year 718 30 1,409 711Cash and cash equivalents comprises cash balancesheld with registered New Zealand banks –Cash at bank 718 30 1,409 711The accompanying notes form part of these financial statements.51
LANDCORP FARMING LIMITED AND SUBSIDIARIESStatement of Financial PositionAS AT 30 JUNE 2010Group Group Parent ParentNote 2010 2009 2010 2009$000 $000 $000 $000AssetsCash and Cash Equivalents 718 30 1,409 711Accounts Receivable 21 28,168 20,840 24,634 16,573Inventories 22 10,918 12,500 9,764 10,698Property Held for Sale 23 37,634 38,922 12,200 13,800Biological AssetsLivestock 24 211,751 218,050 196,366 203,913Forests 25 10,746 8,648 10,030 8,092Total Biological Assets 222,497 226,698 206,396 212,005Equity Accounted Investments 11 2,766 3,043 – –Deferred Tax Asset 34 17,127 17,812 11,728 9,515Other Financial Assets 26 43,547 41,781 250,067 253,124Intangible Assets 27 2,279 2,227 2,279 2,227Property, Plant and Equipment 28Land and improvements 997,231 1,144,088 976,091 1,123,581Protected land 117,478 117,374 – –Plant 23,068 24,221 16,558 17,534Motor vehicles 15,496 15,950 13,391 13,443Furniture and equipment 2,271 2,480 2,027 2,194Computer equipment 751 782 707 691Total Property, Plant and Equipment 1,156,295 1,304,895 1,008,774 1,157,443Total Assets 1,521,949 1,668,748 1,527,251 1,676,09652
Group Group Parent ParentNote 2010 2009 2010 2009$000 $000 $000 $000LiabilitiesAccounts Payable and Accruals 29 16,464 22,957 19,872 14,496Employee Entitlements 7,829 6,628 7,351 6,203Other Financial Liabilities 26 160,077 189,106 160,077 189,106Redeemable Preference Shares 30 100,408 90,408 100,408 90,408Total Liabilities 284,778 309,099 287,708 300,213Shareholders’ FundsShare capital 125,000 125,000 125,000 125,000Retained earnings 100,292 106,167 225,400 243,064Revenue reserves 68,792 78,758 67,922 79,054Fair value reserve 1,409 1,444 3,741 3,762Asset revaluation reserves 719,564 851,659 606,725 739,741Other equity 222,114 196,621 210,755 185,262Total Shareholders’ Funds 31 1,237,171 1,359,649 1,239,543 1,375,883Total Equity and Liabilities 1,521,949 1,668,748 1,527,251 1,676,096The accompanying notes form part of these financial statements.<strong>Landcorp</strong>’s Board of Directors authorised the financial statements for issue on 30 August 2010.Signed on behalf of the BoardJim SuttonChairman30 August 2010Marise JamesChairman of Audit and Due Diligence Committee53
LANDCORP FARMING LIMITED AND SUBSIDIARIESNotes to the Financial StatementsNote 1 – Reporting Entity<strong>Landcorp</strong> Farming Ltd (“<strong>Landcorp</strong>”) is a profit-oriented company, incorporated in New Zealand. <strong>Landcorp</strong> is established under theState-Owned Enterprises Act 1986 and registered under the Companies Act 1993. <strong>Landcorp</strong> Farming Ltd is primarily involved in pastoralfarming and provision of farm management services within New Zealand. Subsidiary companies are involved in pastoral farming, landdevelopment and project management.The ultimate parent of <strong>Landcorp</strong> is the <strong>Crown</strong>, which owns 100% of <strong>Landcorp</strong>’s shares, held beneficially by the Minister of Finance (50%)and the Minister for State-Owned Enterprises (50%).The address of <strong>Landcorp</strong>’s registered office and principal place of business is shown in the directory of the Annual Report.Consolidated financial statements are presented for the “Group”, comprising <strong>Landcorp</strong> Farming Ltd, subsidiaries and jointly-controlled entities.Financial statements are presented for the “Parent”, <strong>Landcorp</strong> Farming Ltd.Note 2 – Statement of ComplianceThe financial statements have been prepared in accordance with Generally Accepted Accounting Practice in New Zealand under the CompaniesAct 1993 and the Financial Reporting Act 1993. They comply with the New Zealand Equivalents to International Financial Reporting Standards(NZ IFRS), and other applicable Financial Reporting Standards, as appropriate for profit-oriented entities. These financial statements comply withInternational Financial Reporting Standards (IFRS).Note 3 – Summary of Significant Accounting PoliciesBasis of preparationThe financial statements have been prepared using a historic cost basis, modified by the revaluation to fair value of certain assets and liabilitiesas disclosed below.The reporting currency used in the preparation of these financial statements is New Zealand dollars (NZ$) rounded to the nearest thousand.These consolidated financial statements have been prepared on the basis of NZ IFRSs on issue that are effective at 30 June 2010. <strong>Landcorp</strong> haschosen to adopt NZ IFRS-8 Operating Segments and early adopt the revised NZ IAS-24 Related Party Disclosures, to improve the disclosures inthe notes to the financial statements.The standards below have been issued by the Accounting Standards Review Board (ASRB) but have not been adopted by <strong>Landcorp</strong> as theyare not effective for the financial year ending 30 June 2010. Except for NZ IFRS-9 Financial Instruments: Classification and Measurement,initial application of the following Standards and Interpretations is not expected to have any material impact on the financial results of theParent and Group.The adoption of NZ IFRS-9 will result in the reclassification of <strong>Landcorp</strong>’s financial instruments. <strong>Landcorp</strong>’s share portfolio will change from thecurrent available-for-sale classification to either fair-value-through-profit-or-loss, or fair-value-through-other-comprehensive-income. Dependingon the election made, revaluations of these shares and associated gains and losses on disposal will be classified as either part of net profit or othercomprehensive income. NZ IFRS-9 is the first stage of a three stage revision of NZ IAS-39 Financial Instruments: Recognition and Measurement.Other effects on <strong>Landcorp</strong>’s financial statements are unknown until the later stages of the revision are known.All other standards not yet effective either do not apply to <strong>Landcorp</strong>’s operations or will have no effect on <strong>Landcorp</strong>’s reported financial results.Effective for annual reportingExpected to be initially appliedStandard periods beginning on or after in the financial year endingNZ IFRS-5 ‘Non current Assets Held for Sale andDiscontinued Operations’ – revised standard 1 January 2010 30 June 2011NZ IFRS-9 ‘Financial Instruments:Classification and Measurement’ 1 January 2013 30 June 2014NZ IAS-17 ‘Leases’ – amendments 1 January 2010 30 June 2011The accounting policies set out below have been applied consistently throughout the Group to all periods presented in these consolidatedfinancial statements.54
Note 3 – Summary of Significant Accounting Policies (continued)Basis of consolidationSubsidiaries are companies controlled by <strong>Landcorp</strong> and are included in the consolidated financial statements using the purchase method ofconsolidation. In the Parent, subsidiaries are valued at cost and are subject to an impairment test at each reporting date.All significant intercompany balances and transactions are eliminated on consolidation. Unrealised gains arising from transactions with jointlycontrolled entities are eliminated to the extent of <strong>Landcorp</strong>’s interest in the entity.Interests in joint venturesJoint ventures comprise jointly-controlled entities and jointly-controlled operations. Jointly controlled entities are companies that <strong>Landcorp</strong> sharesjoint-control over and are included in the financial statements using the equity method. When the Group’s share of losses exceeds the Group’sinvestment a liability is only recognised to the degree that the Group has incurred a constructive or legal obligation.<strong>Landcorp</strong>’s assets and liabilities used in jointly controlled operations, including sharemilking, are accounted for in the same manner as assets andliabilities used in <strong>Landcorp</strong>’s other farming operations. <strong>Landcorp</strong> does not account for any assets owned by the joint venture partners. <strong>Landcorp</strong>recognises its share of revenue (and any expense) under the same revenue recognition policies used in other farming operations.Accounting for goods and services tax (GST)All items in the Statement of Financial Position are stated exclusive of GST, with the exception of receivables and payables, which includeGST. All items in the Statement of Comprehensive Income and Statement of Cash Flows are stated exclusive of GST.Revenue recognitionRevenue is the inflow of economic benefits to <strong>Landcorp</strong> in the course of <strong>Landcorp</strong>’s ordinary activities, other than increases due tocontributions from shareholders. Inflows of economic benefits arising from other activities are included in the Statement of ComprehensiveIncome, separate from revenue.The ordinary activities of the Group comprise pastoral farming, land development activities, and provision of farm managementservices. The Parent’s ordinary activities comprise pastoral farming and provision of farm management services.Changes in the general price level of biological assets and share investments are considered incidental to the activity of pastoral farming, as isany profit resulting from the sale of land and standing forests. These are not classified as revenue and are recorded separately in the Statementof Comprehensive Income.Significant revenue policies are:(a) Revenue is measured at the fair value of consideration received or receivable.(b) Profit on asset sales is recognised at the point of formal unconditional contract for sale and when the significant risks and rewards ofownership have been transferred.(c) Livestock sales, and sales of other agricultural produce, are recognised upon receipt by the customer when the risks and rewards ofownership have been transferred.(d) Revenue from services is recognised as services are provided.(e) Agricultural produce, including milk and wool, is recognised at the point of harvest at its fair value less estimated point-of-sale costs.(f) Dividend revenue from investments is recognised when the shareholder’s right to receive payment has been established.Interest RevenueInterest revenue is accrued on a time basis, by reference to the principal outstanding and at the applicable effective interest rate.Operating leasesOperating lease rentals are recognised evenly over the expected period of benefit to the Group, which is over the term of the lease.Borrowing costsBorrowing costs that are directly attributable to the acquisition of an asset that takes a substantial time to construct are capitalised as partof the cost of that asset. Other borrowing costs are recognised in the Statement of Comprehensive Income when they are incurred.55
LANDCORP FARMING LIMITED AND SUBSIDIARIESNOTES TO THE FINANCIAL STATEMENTS CONTINUEDNote 3 – Summary of Significant Accounting Policies (continued)Accounting for taxationIncome tax expense/income comprises current and deferred tax. Income tax is recognised in the Statement of Comprehensive Income, exceptwhere it relates to an item recognised directly in equity, where the income tax is recognised directly in equity.Current tax is the expected tax payable on the taxable income of the year, using tax rates enacted or substantively enacted at the balance sheetdate, and any adjustments to tax payable in respect of previous years.Deferred tax is provided using the balance sheet liability method, providing for temporary differences between the carrying values of assetsand liabilities for financial reporting purposes and the tax base of those assets and liabilities. The amount of deferred tax provided is based onthe difference between the tax base and the carrying amount of assets and liabilities, using tax rates enacted or substantively enacted at thebalance sheet date.A deferred tax asset is recognised only to the extent that it is probable that future taxable benefits will be available against which the assetcan be utilised. Deferred tax assets and liabilities are offset when there is a legal right to offset tax liabilities with tax assets and when theGroup intends to settle on a net basis.ReceivablesReceivables are initially measured at fair value and are subsequently measured at amortised cost using the effective interest method, lessimpairment losses. An allowance for irrecoverable amounts is recognised in the Statement of Comprehensive Income when there is objectiveevidence that a receivable is impaired.InventoryAll inventory items are stated at lower of cost or net realisable value at balance date. The cost of agricultural produce transferred into inventoryis measured at its fair value less estimated point-of-sale costs at date of harvest. The net realisable value represents the estimated selling price ofinventories less all estimated costs of completion and costs necessary to make the sale.Property held for saleProperty held for sale comprises property that has been identified for sale and development land. Properties that have been identified for sale areclassified as property held for sale when a sales plan has been implemented and an unconditional sales contract is expected to be signed within ayear. Development land is held for sale to development joint venture entities.Property held for sale is measured at the lower of the carrying value of the property when it was classified as property held for sale and fair valueless cost to sell.Biological assets(a) LivestockLivestock are recorded at fair value less estimated point-of-sale costs.Changes in the value of livestock are recognised in the Statement of Comprehensive Income. Changes in value due to livestock price movementsare beyond <strong>Landcorp</strong>’s control and do not form part of <strong>Landcorp</strong>’s livestock management policies, so are recognised in the Statement ofComprehensive Income as gain/loss due to price changes on livestock. Value changes that form part of <strong>Landcorp</strong>’s livestock management policies,including animal growth and changes in livestock numbers, are recognised in the Statement of Comprehensive Income within revenue.(b) ForestsForests are recorded at fair value less estimated point-of-sale costs, based on estimated cashflows and using a market discount rate.Changes in the value of forests are recognised in the Statement of Comprehensive Income. Changes in value due to movements in forestry pricesare beyond <strong>Landcorp</strong>’s control and do not form part of <strong>Landcorp</strong>’s forest management practices. These changes in value due to price movementsare recognised as gain/loss due to price changes on forests. Value changes that form part of <strong>Landcorp</strong>’s forest management policies, includingforest growth, are recognised in the Statement of Comprehensive Income within profit before property sales and revaluations.Standing forests are only sold as part of a land sale and do not form part of <strong>Landcorp</strong>’s forest management practices. Profits arising from thesale of standing forests are recognised in the Statement of Comprehensive Income as profit on sale of forests, after net profit before propertysales and revaluations.56
Note 3 – Summary of Significant Accounting Policies (continued)Other financial assets(a) Investments in subsidiariesInvestments in subsidiaries are recorded at cost and reviewed for impairment at each reporting date.(b) Loans to subsidiariesLoans to subsidiaries are recorded at amortised cost, using the effective interest method, and reviewed for impairment at each reporting date.(c) Other loans and receivablesOther loans and receivables are recorded at amortised cost, using the effective interest method, and reviewed for impairment at eachreporting date.(d) Held-for-trading instrumentsThe Group has elected not to apply hedge accounting. This means that for the purposes of NZ IFRS reporting all derivative financial instrumentsmust be classified as held-for-trading. Derivative financial instruments are used by <strong>Landcorp</strong> to hedge interest rate, foreign currency andcommodity risks. <strong>Landcorp</strong>’s financial management policies explicitly prohibit trading in financial instruments.Held-for-trading instruments are recognised in the Statement of Financial Position at fair value on trade date, with changes in fair value reportedas revaluation gains and losses in the Statement of Comprehensive Income. The cash-flows arising from interest-rate derivatives are reported as acomponent of net finance costs in the Statement of Comprehensive Income.(e) Available-for-sale investmentsUnder NZ IFRS, <strong>Landcorp</strong>’s portfolio of shares and other investments in various cooperative and processing companies is classified asavailable-for-sale. The Group is required to hold these investments to facilitate farming operations. As such, the Group is normally unableto sell these investments without disrupting the Group’s business operations.Available-for-sale investments are valued at fair value.Other changes in value are reported directly in equity. On sale the revaluation component is recognised in the Statement ofComprehensive Income.(f) Impairment of Financial AssetsWhere objective evidence of impairment exists, the investment is written down to the present value of expected cash flows, with the reduction invalue being reported in the Statement of Comprehensive Income. Subsequently, if the impairment diminishes, for non-equity financial instruments,the appreciation in value is reported in the Statement of Comprehensive Income, to the extent that it reverses previous impairment losses.Intangible assets(a) Research and developmentResearch costs are expensed as incurred. An internally generated intangible asset arising from development costs is recognised when it is probablethat the asset will be completed and will generate future economic benefits.(b) Carbon creditsAllocations of New Zealand <strong>Unit</strong>s (NZU) and/or other carbon credits are initially recognised at fair value where <strong>Landcorp</strong> is reasonably certainthat they will be received and there is a market determined price. Other changes in the quantity of carbon credits are recognised as an operatinggain or loss based on fair value at time of transaction.Carbon credits are valued at fair value in the Statement of Financial Position as an intangible asset, with changes in value being recorded asrevaluation gain/loss on carbon in the Statement of Comprehensive Income.57
LANDCORP FARMING LIMITED AND SUBSIDIARIESNOTES TO THE FINANCIAL STATEMENTS CONTINUEDNote 3 – Summary of Significant Accounting Policies (continued)(c) Other intangible assetsOther intangible assets that are acquired by the Group are recorded at cost, less accumulated amortisation and impairment losses.(d) AmortisationIntangible assets are amortised on a straight line basis over the expected useful life of the asset. The estimated useful lives for intangibleassets are:Computer software5 years(e) ImpairmentIf the estimated recoverable amount of the asset is less than its carrying amount, the asset is written down to its estimated recoverable amountand an impairment loss is recognised in the Statement of Comprehensive Income. Recoverable amount is the greater of fair value less costs to selland value in use.Property, plant and equipment(a) Recognition and measurementThe initial cost of property, plant and equipment is the initial purchase price plus directly attributable costs of bringing the item to workingcondition for its intended use.(b) Subsequent measurementFreehold land and improvements (including buildings) are valued annually on 30 June at fair value by independent registered valuers. Anyaccumulated depreciation on an asset at the date of revaluation is eliminated against the gross carrying amount of the asset and the net amountrestated to the revalued amount of the asset. Changes in valuation are taken to the freehold land and improvements revaluation reserve usingthe net revaluation method. Where an asset’s downwards revaluation exceeds previous positive revaluations, the net negative amount of therevaluation is reported within net profit in the Statement of Comprehensive Income.Protected land (including buildings on protected land) is valued at fair value at the time it is classified as protected land. Under theprotected land agreement, this value is considered to be the ongoing fair value of the land to <strong>Landcorp</strong>. Buildings are stated at this valueless accumulated depreciation.All other items of property plant and equipment are measured at cost less accumulated depreciation and impairment losses.(c) DepreciationDepreciation is calculated on a straight line basis on all items of property, plant and equipment, except for land, to allocate the cost or revaluedamount of an asset less any residual value, over its useful life. The estimated useful lives of property, plant and equipment are as follows:Buildings on freehold landBuildings on leased landPlantMotor vehiclesFurniture and equipmentComputer equipment30 – 60 years30 – 60 years3 – 10 years4 – 10 years7 years3 years(d) ImpairmentIf the estimated recoverable amount of the asset is less than its carrying amount, the asset is written down to its estimated recoverable amount.For property, plant and equipment that are revalued annually, this difference is accounted for in the same manner as a downwards revaluation.For property, plant and equipment recorded at depreciated historical cost an impairment loss is recognised in the Statement of ComprehensiveIncome. Recoverable amount is the greater of fair value less costs to sell and value in use.58
Note 3 – Summary of Significant Accounting Policies (continued)(e) DisposalWhen an item of property, plant and equipment is disposed, the difference between the net disposal proceeds received and the carrying amountof the item is recognised in the Statement of Comprehensive Income. Any gain or loss on disposal of land is recognised as profit or loss on sale ofland. Gains and losses on disposal of other items of property, plant and equipment are recognised as gain or loss on disposal of property, plant andequipment. For items that have been revalued, the revaluation reserve attributable to that item is transferred from the asset revaluation reserve toother equity.Employee entitlementsEmployee benefits include salaries, wages, annual leave, accrued sick leave and long service leave. A provision for employee entitlements isrecognised for benefits attributable to employees. The provision is the estimated net present value of benefits expected to be paid.Financial liabilities(a) Initial recognitionFinancial liabilities, including financial guarantees and accounts payable, are recognised at fair value on initial recognition.(b) Subsequent recognitionAfter initial recognition, bank loans, other loans and accounts payable are recognised at amortised cost using the effective interest method.Financial guarantees are recognised at the higher of the initial recognition fair value less, where appropriate, accumulated amortisation and thebest estimate of expenditure required under the financial guarantee contract.Statement of cash flowsCash includes cash at bank, including bank overdrafts, and cash on hand.Operating activities include all transactions and other events from <strong>Landcorp</strong>’s principal revenue activities including interest costs and other cashflows not investing or financing activities.Investing activities are those activities relating to the acquisition and disposal of current and non-current investments, purchases of livestock andany other non-current assets.Financing activities are those activities relating to changes in the equity and debt capital structure of the Group and those activities relating tothe cost of servicing the Group’s equity capital.Cash flows are presented net where the receipts and payments are for items with short maturity and quick turnover, such as drawdowns andrepayments of bank funding.Provision for dividendsDividends are recognised in the period that they are authorised and declared.59
LANDCORP FARMING LIMITED AND SUBSIDIARIESNOTES TO THE FINANCIAL STATEMENTS CONTINUEDNote 4 – Significant Accounting Judgements, Estimates and AssumptionsThe preparation of the financial statements requires management to make judgements, estimates and assumptions that affect the reportedamounts in the financial statements. Management continually evaluates its judgements and estimates in relation to assets, liabilities, contingentliabilities, revenue and expenses. Management bases its judgements and estimates on historical experiences and on other various factors it believesto be reasonable under the circumstances. The result of the judgement and estimates form the basis of the carrying values of assets and liabilitiesthat are not readily apparent from other sources. Actual results may differ from these estimates under different assumptions and conditions.Management has identified the following critical accounting policies for which significant judgements, estimates and assumptions are made.Actual results may differ from these estimates under different assumptions and conditions and may materially affect financial results or thefinancial position reported in future periods.Further details of the nature of these assumptions and conditions may be found in the relevant notes to the financial statements.(i) Significant accounting judgementsClassification of revenue<strong>Landcorp</strong> considers its revenue to comprise the regular income generated by the ordinary activities of the Group.<strong>Landcorp</strong> receives various incidental and irregular income due to items that are not related to <strong>Landcorp</strong>’s ordinary activities, and classifies theseas other gains and losses or revaluations. These include revaluation gains and losses on livestock mainly held for breeding and production, andfinancial instruments held for hedging purposes.This differentiation is considered to better present the results of <strong>Landcorp</strong>’s farming practices and core activities.Revenue recognitionLivestock sales are recognised when the livestock is received in good order by customers. For the majority of <strong>Landcorp</strong>’s livestock sales the risksand rewards of ownership are retained by <strong>Landcorp</strong> until the livestock are received by the customer.Profit on land salesFarm sales are recognised on settlement and possession as <strong>Landcorp</strong> remains exposed to climatic and operational risks associated with the farmuntil settlement date.Classification as property held for sale<strong>Landcorp</strong> classifies assets and liabilities as held for sale when its carrying amount will be recovered through sale, rather than use. The assets andliabilities must be available for sale in their current state, which means that property that requires subdivision or other consent processes in orderto sell is not classified as property held for sale.Development landDevelopment land is classified as property held for sale and valued at the lower of the carrying amount at the time it was classified as held forsale and fair value less costs to sell. Under joint venture development arrangements, <strong>Landcorp</strong> enters into a binding sales contract with the jointventure company. The joint venture company then develops and markets the land. Unsold developed land will be returned to <strong>Landcorp</strong>, and therelated proportion of the sales contract cancelled. Consequently, <strong>Landcorp</strong> considers that the risks and rewards of ownership of the land only fullypass to the joint venture company when the developed land is on-sold. Transfers of land to joint venture companies are recognised when legaltitle (required for subdivision purposes) is transferred to joint venture companies, with a receivable recorded for the value of land. Profit on sale isrecognised when the developed land is on-sold by joint venture companies.Reimbursement of protected land lossesUnder the Protected Land Agreement, any accumulated profit or loss on a protected property will be settled between the <strong>Landcorp</strong> and <strong>Crown</strong>when that property is transferred to the <strong>Crown</strong>. To date, the properties have accumulated losses, which will be reimbursed by the <strong>Crown</strong> ontransfer. Previously, <strong>Landcorp</strong> had not recognised this reimbursement asset due to the unknown time horizon until settlement and as such theasset could not be reliably measured. One of the protected properties has recently been included in an agreement in principle between the <strong>Crown</strong>and Iwi to settle a Treaty of Waitangi grievance. While <strong>Landcorp</strong> has not yet received the formal notice of transfer required under the ProtectedLand Agreement, the likelihood of transfer in the foreseeable future means that the reimbursement of losses on that property can be reliablymeasured and recognised in the financial statements.60
Note 4 – Significant Accounting Judgements, Estimates and Assumptions (continued)Classification of investments and derivatives<strong>Landcorp</strong> is required to classify its shareholding portfolio as available-for-sale and value it at fair value. The share portfolio largely comprises sharesand investments in agricultural cooperative and processing companies, which <strong>Landcorp</strong> is required to hold to facilitate farming operations. As such,<strong>Landcorp</strong> is normally unable to sell these investments without disrupting <strong>Landcorp</strong>’s farming operations. Detail on the valuation of <strong>Landcorp</strong>’sshareholding portfolio is shown in Note 26.<strong>Landcorp</strong> does not apply hedge accounting as the benefits of applying hedge accounting are not perceived to exceed the compliance costsinvolved. This means that all derivative financial instruments must be classified as held-for-trading. Derivative financial instruments are used by<strong>Landcorp</strong> to hedge interest rate, exchange rate and commodity price risks. <strong>Landcorp</strong>’s policies explicitly prohibit trading in financial instruments.Detail on the valuation of <strong>Landcorp</strong>’s derivative portfolio is shown in Note 26.TaxationCurrent taxation expense is based on the potential taxation expense that would be filed with the taxation authority given management’s intentat balance date. Under taxation legislation, <strong>Landcorp</strong> has discretion in the valuation methodology used for livestock, and in the timing of claimingexpenses relating to fertiliser, amongst others. The actual taxation expense may differ from that shown in the financial statements if managementsubsequently changes any of these elections.Deferred tax balances result from taxable differences between balance sheet values and taxation values for assets and liabilities. Management’sintention to use or sell, will determine whether a difference is taxable, this is based on management intention at balance date.Deferred tax balances relating to revalued land and livestock are required to be based on the tax effect if all land and livestock were to be sold atbalance date. Management has no intention of selling either affected land or the entire livestock herd and this deferred tax liability is unlikely tobe incurred in <strong>Landcorp</strong>’s ordinary course of business.(ii) Significant accounting estimates and assumptionsValuation of investments and derivatives<strong>Landcorp</strong>’s share portfolio comprises investments in cooperative companies. These companies commonly have restrictions on share ownership andlimited transferability of shares. Many of these shares may only be sold back to the cooperative company at the cooperative’s deemed share price.The fair value of shares in cooperative companies is based on the lower of the current cost to purchase additional shares or required sale values.The fair value of listed shares and other investments are based on reported market values at balance date.Derivative financial instruments are valued based on estimated market values at balance date, given prevailing market interest rates and the termsof the derivative instruments.Freehold land and buildingsThe valuation of freehold land and buildings is based on observed market prices for properties of similar location, land use and size. No discountor premium has been made for the scale of <strong>Landcorp</strong>’s land holdings. Factors affecting the valuation of <strong>Landcorp</strong>’s freehold land and buildings aredetailed in Note 28.The valuation of land and buildings takes into account the observed price effects of various legal obligations placed on <strong>Landcorp</strong>’s land ownership.In the North Island deductions of 0–6% have been made for obligations arising from section 27B of the State Owned Enterprises Act. The SouthIsland properties include a deduction of up to 5% to reflect the effect of the Right of First Refusal granted to Ngai Tahu under the Ngai TahuClaims Settlement Act.Following the Agreement Concerning <strong>Landcorp</strong> Land Protected from Sale, <strong>Landcorp</strong> considers that the threat of occupation of properties has beensignificantly reduced. No deduction from observed market prices has been made for this threat.61
LANDCORP FARMING LIMITED AND SUBSIDIARIESNOTES TO THE FINANCIAL STATEMENTS CONTINUEDNote 4 – Significant Accounting Judgements, Estimates and Assumptions (continued)ForestsForests are valued based on estimated pre-tax cashflows, using a market discount rate of 12% and current log prices. Forested blocks less thantwo hectares are not valued as these are considered too small to be economic to harvest. The impact of biological transformation on forests under10 years old is assumed to have minimal effect on their market value, and these are recorded at cost. Factors affecting the valuation of <strong>Landcorp</strong>’sforests are detailed in Note 25.Livestock<strong>Landcorp</strong> values its breeding and production livestock using Inland Revenue Department’s National Average Market Values (NAMV). The geographicspread and quality of livestock used in the NAMV are considered to approximate <strong>Landcorp</strong>’s breeding and production livestock. Factors affectingthe valuation of <strong>Landcorp</strong>’s livestock are detailed in Note 24.Slaughter livestock that are at marketable weight are valued based on published schedule prices at 30 June. Slaughter livestock that is not yet atmarketable weight is valued based on estimated sales value in the store market.Livestock income due to growth and change in numbers is calculated based on internally assessed accrued values. These values are set andreviewed annually by the Board based on year end livestock values.Effect of droughtAs described in Note 20, the effect of the drought is disclosed as a material agricultural event. Determining the effect of the drought requires anestimation of the cost of the drought, which is based on several assumptions as described in Note 20. Events such as drought have numerousindirect effects, which cannot be easily quantified. The estimated cost is necessarily based on those factors that can be directly identified asoriginating from drought conditions, and, as such, provides a conservative estimate of the cost.Estimation of useful lives of property, plant and equipmentThe useful lives of property, plant and equipment is based on historical experience. Replacement policies, for motor vehicles, and the risk oftechnological developments leading to obsolescence, for computer equipment, is also considered.Note 5 – Operational Management<strong>Landcorp</strong>’s operational functions are delivered via the Group company structure and comprise:Pastoral farming – Pastoral farming on owned and leased land. Revenues from this function predominantly arise from the sale of livestockfor slaughter purposes and milk production.Land development – development and disposal of land with a higher alternative use than farming. Revenues from this function arise fromthe sale of developed sections, either directly or through joint-venture development companies.Protected land management – Holding of protected land under the Agreement Concerning <strong>Landcorp</strong> Land Protected From Sale. Protectedland is managed by the owned land function, with rental paid to the protected land function equal to the profits generated on theprotected land. A management fee is charged based on the value of the pastoral farming function’s assets used on protected land, plusoperational and management costs.All other functions – includes land development management and holding company activities.Transactions between functions are undertaken at arm’s length prices, in a manner similar to transactions with third parties. Inter-functiontransactions result in revenues and expenses for the affected functions, which are eliminated on consolidation.62
Note 5 – Operational Management (continued)Management monitors the operating results of functions separately for the purposes of making decisions about resources to be allocated and ofassessing performance. Performance of the different functions is evaluated based on operating profit or loss which in certain respects, as explainedbelow, is measured differently from operating profit or loss in the consolidated financial statements.All activities are undertaken in New Zealand.ProtectedPastoral Land Land All Other Inter-Function Other ConsolidatedFarming Development Management Functions Eliminations Adjustments Group2010 2010 2010 2010 2010 2010 2010Comment $000 $000 $000 $000 $000 $000 $000RevenueLivestock 83,469 – – – – – 83,469Milk 70,193 – – – – – 70,193Other revenue 9,277 – 12 – – – 9,289162,939 – 12 – – – 162,951Income from equityaccounted joint ventures – 23 – – – – 23Other income A 4,813 894 4,252 6,966 (8,427) (1,619) 6,879167,752 917 4,264 6,966 (8,427) (1,619) 169,853ExpensesFarm working expenses 62,885 – – – – – 62,885Personnel B 41,313 111 – 589 – 41 42,054Depreciation and amortisation 12,224 – 125 208 – – 12,557Other expenses 32,030 230 799 5,096 (7,136) (41) 30,978Total expenses 148,452 341 924 5,893 (7,136) – 148,474Net Profit Before Interest, PropertySales and Revaluations 19,300 576 3,340 1,073 (1,291) (1,619) 21,379Interest revenue 88 – – 3,088 (3,088) – 88Interest expense (4,557) (919) (955) (8,111) 3,088 – (11,454)Net Finance Costs (4,469) (919) (955) (5,023) – – (11,366)Net Operating Profit C 14,831 (343) 2,385 (3,950) (1,291) (1,619) 10,013AssetsLivestock 211,751 – – – – – 211,751Property, plant and equipment 1,036,442 – 117,478 2,375 1,156,295Other assets A,D 107,668 22,850 (251) 224,688 (224,951) 23,899 153,903Total assets 1,355,861 22,850 117,227 227,063 (224,951) 23,899 1,521,94963
LANDCORP FARMING LIMITED AND SUBSIDIARIESNOTES TO THE FINANCIAL STATEMENTS CONTINUEDNote 5 – Operational Management (continued)ProtectedPastoral Land Land All Other Inter-Function Other ConsolidatedFarming Development Management Functions Eliminations Adjustments Group2009 2009 2009 2009 2009 2009 2009Comment $000 $000 $000 $000 $000 $000 $000RevenueLivestock 98,464 – – – – – 98,464Milk 54,164 – – – – – 54,164Other revenue 7,766 – (57) – – – 7,709160,394 – (57) – – – 160,337Income from equityaccounted joint ventures – 382 – – – – 382Other income A 6,784 2,001 1,213 7,555 (6,821) 2,624 13,356167,178 2,383 1,156 7,555 (6,821) 2,624 174,075ExpensesFarm working expenses 68,970 – – – – – 68,970Personnel B 40,867 110 – 513 – 11 41,501Depreciation and amortisation 11,882 – 107 246 – – 12,235Other expenses 30,881 232 920 953 (1,215) – 31,771Total expenses 152,600 342 1,027 1,712 (1,215) 11 154,477Net Profit Before Interest, PropertySales and Revaluations 14,578 2,041 129 5,843 (5,606) 2,613 19,598Interest revenue 52 34 – 6,579 (6,576) – 89Interest expense (7,387) (829) (3,064) (8,126) 6,576 – (12,830)Net Finance Costs (7,335) (795) (3,064) (1,547) – – (12,741)Net Operating Profit C 7,243 1,246 (2,935) 4,296 (5,606) 2,613 6,857AssetsLivestock 218,050 – – – – – 218,050Property, plant and equipment 1,185,676 – 117,374 1,845 – – 1,304,895Other assets A,D 86,057 28,173 (2,520) 235,666 (226,883) 25,310 145,803Total assets 1,489,783 28,173 114,854 237,511 (226,883) 25,310 1,668,748Other adjustments predominantly arise from the adoption of NZ IFRS. Many of these adjustments relate to the recognition in profit of items thatwill not have a cash impact on the business, and cannot be realised in the ordinary course of livestock farming. Specific adjustments made in theabove tables relate to:ABAgricultural produce on handUnder NZ IFRS all harvested feed must be recognised at its fair value at time of harvest. <strong>Landcorp</strong> considers this part of the normal farmingoperation and monitors physical feed conditions across all properties. <strong>Landcorp</strong> does not measure the dollar value impact of periodic variancesin the amount of internally harvested feed for management purposes.Employee benefitsNZ IFRS requires <strong>Landcorp</strong> to value accumulating employee compensated absences, such as sick leave entitlements, to the extent thatbalances currently earned are likely to be taken in the future. <strong>Landcorp</strong> does not measure this liability for management reporting purposes asthis liability is not expected to arise in normal operations.64
Note 5 – Operational Management (continued)CDNet operating profit<strong>Landcorp</strong> considers Net Operating Profit to be the best measure of management effectiveness. This profit measure includes the factorsthat are part of <strong>Landcorp</strong>’s core operations and management policies. Changes in the general price level of livestock, forests and farmlandare considered incidental to the activities of <strong>Landcorp</strong> and are not part of <strong>Landcorp</strong>’s management policies, so are classified outside of NetOperating Profit. The effect of these price changes also form the major part of the tax expense reported under NZ IFRS. As it is unlikely thatany tax expense related to these price changes will be incurred with the Inland Revenue Department, tax expense is also classified outside ofNet Operating Profit.Deferred tax asset/liabilityNZ IFRS requires deferred tax to be calculated on the difference between accounting and tax values for most balance sheet items.The majority of the deferred tax liability results from <strong>Landcorp</strong> having to recognise a tax charge for all revaluations on livestock, investmentsand some land revaluations. These tax liabilities are unlikely to be fully incurred in the ordinary course of business and are not included inmanagement reporting.Note 6 – Livestock RevenueA description of <strong>Landcorp</strong>’s activities relating to livestock is included in Note 24.<strong>Landcorp</strong>’s livestock revenue by species was:Group Group Parent Parent2010 2009 2010 2009$000 $000 $000 $000Sheep 37,634 43,711 37,676 43,554Beef 31,297 30,674 29,390 29,736Deer 14,539 24,079 14,539 24,079Other (1) – (1) –Total Livestock Revenue 83,469 98,464 81,604 97,369Group Group Parent Parent2010 2009 2010 2009Note $000 $000 $000 $000Livestock sales 87,801 94,035 86,214 92,988Birth of animals 24 26,934 21,929 25,745 20,716Growth of animals 24 45,098 49,768 42,599 47,995Livestock losses 24 (8,850) (9,570) (8,446) (8,778)Book value of livestock sold 24 (67,514) (57,698) (64,508) (55,552)Total Livestock Revenue 83,469 98,464 81,604 97,369Livestock revenue includes the recognition of net profit or loss arising from changes in livestock numbers due to the birth, growth, death and salesof livestock. This value change arising from the change in livestock numbers and growth is calculated by assigning an internally assessed annualvalue for each livestock class.Livestock revenues in 2009/10 were severely impacted by decreased sales prices from 2008/09, largely due to unfavourable exchange rates overthe year. Deer revenue (down $9.5 million or 40%) was impacted by a combination of lower average sales prices (down 13%), lower numbers(down 12%) and higher sales costs. The average sales prices for sheep and beef were both down 7%, with sheep revenue (down $6.1 million or14%) also impacted by lower sales due to a lower lambing percentage. Overall beef revenues were largely similar to 2008/09 (up $0.6 million or2%) as the lower sales prices were offset by higher sales numbers (up 3%) and lower costs.65
LANDCORP FARMING LIMITED AND SUBSIDIARIESNOTES TO THE FINANCIAL STATEMENTS CONTINUEDNote 7 – Milk RevenueRefer to the Balanced Scorecard on pages 17 to 22 for milk production information and Note 24 for a description of dairy livestock.Milk income during the year was:Group Group Parent Parent2010 2009 2010 2009$000 $000 $000 $000Milk RevenueTotal value of milk produced 71,538 55,946 54,532 42,524Sharemilker share of milk production (1,345) (1,782) (1,345) (1,782)Total Milk Revenue 70,193 54,164 53,187 40,742During 2009/10 two of <strong>Landcorp</strong>’s dairy farms were operated by sharemilkers (2009 two farms). All sharemilker farms are milked on a 50/50sharemilking agreement. Under the agreements, <strong>Landcorp</strong> provides land, buildings and dairy shares, and the sharemilker provides livestock andincurs the farm operating expenses. Revenue is shared equally between <strong>Landcorp</strong> and the sharemilker.The composition of milk revenue changed during 2009/10 as one of <strong>Landcorp</strong>’s major customers, Fonterra, changed from a total price basis toa split-payment basis. Under the new payment structure <strong>Landcorp</strong> received a payment for the value of commodity milk supplied and a separatepayment reflecting the investment in the value-add activities of Fonterra (Group $1.4 million, Parent $0.9 million).Milk revenue increased by $16.0 million (30%). This is almost entirely due to the increase in the payout for milk solids. Production in 2009/10 wasimpacted by drought conditions in the upper North Island (refer Note 20) but overall milk production was 3% higher than 2008/09.Note 8 – Wool RevenueGroup Group Parent Parent2010 2009 2010 2009$000 $000 $000 $000Revenue from wool sales 6,482 6,213 6,464 6,198Profit/(loss) on change of wool inventory (568) (193) (568) (193)Total Wool Revenue 5,914 6,020 5,896 6,005Refer to the Balanced Scorecard on pages 17 to 22 for wool production information.Wool is valued at estimated net market value at time of harvest. Wool revenue for 2009/10 is largely similar to 2008/09. The wool price continuedto languish over 2009/10 with similar production volumes as 2008/09.Note 9 – Forestry RevenueRefer to the Balanced Scorecard on pages 17 to 22 for forestry production information and Note 25 for a description of forestry activities.<strong>Landcorp</strong>’s forestry revenue comprised:Group Group Parent Parent2010 2009 2010 2009Note $000 $000 $000 $000Forestry sale proceeds 1,225 1,216 1,225 890Book value of forestry sold/harvested 25 (588) (1,190) (588) (791)Profit (loss) from forestry sales 637 26 637 99Forest growth 25 1,179 1,070 1,167 1,054Allocation of carbon credits 27 777 – 777 –Afforestation grant scheme receipts 142 – 142 –Total Forestry Revenue 2,735 1,096 2,723 1,153Forestry revenue for 2009/10 was increased from 2008/09 due to improved sales prices and lower costs of sale.During 2009/10 <strong>Landcorp</strong> received an allocation of New Zealand <strong>Unit</strong>s (“carbon credits”) for a portion of its post-1989 forests (refer Note 27)and income from the Afforestation Grant Scheme.66
Note 10 – Other Produce RevenueGroup Group Parent Parent2010 2009 2010 2009$000 $000 $000 $000Velvet 600 450 600 450Other agricultural produce 40 143 40 143Total other agricultural Produce Revenue 640 593 640 593Refer to the Balanced Scorecard on pages 17 to 22 for velvet production information.Other agricultural produce mainly comprises skins, hides and dags as well as other miscellaneous produce.Note 11 – Equity Accounted InvestmentsThe Group has the following interests in jointly controlled entities:BalancePercentage heldJoint Ventures Principal activity date 2010 2009Wharewaka (2003) Ltd Property development 31 March 50% 50%Wharewaka East Ltd Property development 31 March 50% 50%Jointly controlled entities are equity accounted as follows:Group Group Parent Parent2010 2009 2010 2009$000 $000 $000 $000Investment in equity accounted investments comprises:Investment at beginning of year 3,043 3,911 – –Equity accounted earnings 23 382 – –Less dividends received (300) (1,250) – –Less investment realised – – – –Investment at End of Year 2,766 3,043 – –Balance sheet information for equity accounted investments:Current assets 211 268 – –Non current assets 9,502 9,085 – –Current liabilities (105) (11) – –Non current liabilities (6,842) (6,299) – –Net assets 2,766 3,043 – –Equity accounted earnings comprises:Income 120 686 – –Expenses (79) (137) – –Surplus before tax 41 549 – –Income tax (18) (167) – –Net surplus 23 382 – –Other gains and losses – – – –Total Recognised Revenues and Expenses 23 382 – –There are no contingent liabilities relating to the Group’s interest in the joint ventures, and no contingent liabilities of the ventures themselves.Transactions with jointly controlled entitiesLand sales to jointly controlled entities are recognised as they become unconditional and when significant risks and rewards of ownership havebeen transferred. During the year, no land sales to jointly controlled entities were recognised, and no land transfers (2009 $9.7 million) were madeto jointly controlled entities for development purposes.67
LANDCORP FARMING LIMITED AND SUBSIDIARIESNOTES TO THE FINANCIAL STATEMENTS CONTINUEDNote 12 – Other Gains and LossesGroup Group Parent Parent2010 2009 2010 2009Note $000 $000 $000 $000Gain on sale of development land 845 1,970 – –Net gain/(loss) on disposal of property, plant and equipment 1,757 (59) 1,783 (31)Impairment loss on property, plant and equipment 28 – (137) – –Gain/(loss) on disposal of available-for-salefinancial instruments:Profit/(loss) on sale over carrying value – 408 – 408Revaluation gains/(losses) previously recognised in equity 20 14 72 14Loss on disposal of held-for-trading financial instruments (569) – (569) –Reimbursement of protected land losses 38 4,505 – 4,505 –Change in harvested feeds on hand (1,619) 2,935 (737) 2,624Other gains 24 11 22 11Total Other Gains and Losses 4,963 5,142 5,076 3,026The gain on sale of development land reflects profits from the sale of land through <strong>Landcorp</strong> Estates Ltd. This has declined in 2009/10 reflecting asignificant decline in sales of developed sections.The loss on disposal of held-for-trading financial instruments arises from the close-out of interest rate hedge instruments during the year, resultingfrom lower debt levels.The reimbursement of protected land losses arises from the <strong>Crown</strong>’s obligation to reimburse <strong>Landcorp</strong> for losses arising from the management ofprotected land, as discussed in Notes 4 and 38.Harvested feeds comprises hay, silage and balage. This feed is made for internal <strong>Landcorp</strong> use and is not usually sold. <strong>Landcorp</strong> does not havesystems to record total production of this produce and considers it impracticable to do so. The reported income from produce on farm representsthe change in the total value of produce on hand from the beginning to the end of the year. The decrease in 2009/10 mainly reflects a decreasedquantity of harvested feed at 30 June 2010, reflecting both the use of feed stores to mitigate drought impacts and lower production on droughtaffected farms.Note 13 – Other IncomeGroup Group Parent Parent2010 2009 2010 2009$000 $000 $000 $000Dividends received from third parties 57 42 56 41Dividends received from subsidiaries – – 1,400 5,100Rent received 637 576 588 546Cropping and horticulture 152 188 152 188Sundry income 1,070 7,408 2,726 6,151Total Other Revenue 1,916 8,214 4,922 12,026Prior year sundry income was increased due to forfeited deposits paid for land sales that did not settle in accordance with the contracted sale.68
Note 14 – Farm Working ExpensesGroup Group Parent Parent2010 2009 2010 2009$000 $000 $000 $000Pasture maintenance 20,459 28,077 17,909 24,424Shearing 4,572 4,640 4,555 4,631Cropping and feed costs 20,522 17,252 18,306 15,385Animal health 5,626 6,040 5,004 5,216Animal breeding 2,290 2,601 2,090 2,387Livestock and other freight 1,932 1,906 1,699 1,706Grazing charges 3,427 3,123 2,334 1,884Other farm working expenses 4,057 5,331 3,157 3,769Total Farm Working Expenses 62,885 68,970 55,054 59,402<strong>Landcorp</strong> experienced easing in some significant costs 2009/10, especially fertiliser, which over the previous two years had increased dramatically.In 2009/10 fertiliser prices reduced but remain above long-term average levels. <strong>Landcorp</strong> managed its fertiliser application during the year to focuson areas of highest need, resulting in lower overall fertiliser application.Note 15 – PersonnelGroup Group Parent Parent2010 2009 2010 2009$000 $000 $000 $000Staff remuneration 39,279 38,345 35,924 34,643Contributions to defined benefit superannuation schemes 826 646 774 604Restructuring and transfer costs 122 529 118 477Staff training 663 985 631 912Other 1,164 996 1,068 913Total Personnel Costs 42,054 41,501 38,515 37,549Increased superannuation scheme contributions reflect increased membership in <strong>Landcorp</strong>’s defined contribution superannuation scheme andKiwiSaver. Decreased staff training costs reflect more targeted training plus deferral of some training to 2010/11.Note 16 – Depreciation and AmortisationGroup Group Parent Parent2010 2009 2010 2009$000 $000 $000 $000Depreciation of Property, Plant and EquipmentDepreciation on buildings – freehold land 2,505 2,544 2,505 2,544– leased land 379 351 – –– protected land 126 108 – –Depreciation on plant 3,970 3,671 3,171 2,897Depreciation on motor vehicles 3,843 3,832 3,412 3,285Depreciation on furniture and equipment 600 647 545 593Depreciation on computer equipment 439 532 385 406Total Depreciation 11,862 11,685 10,018 9,725Amortisation of Intangible AssetsAmortisation of computer software 695 550 695 550Total Amortisation 695 550 695 550Total Depreciation and Amortisation 12,557 12,235 10,713 10,27569
LANDCORP FARMING LIMITED AND SUBSIDIARIESNOTES TO THE FINANCIAL STATEMENTS CONTINUEDNote 17 – MaintenanceGroup Group Parent Parent2010 2009 2010 2009$000 $000 $000 $000Maintenance on land improvements 3,928 4,016 3,641 3,707Maintenance on buildings 1,880 1,711 1,794 1,642Maintenance on plant 1,881 2,035 1,522 1,582Maintenance on motor vehicles 3,018 3,297 2,728 2,832Maintenance on furniture and equipment 59 65 58 65Maintenance on computer equipment 103 115 103 113Total Maintenance 10,869 11,239 9,846 9,941Note 18 – Other Operating ExpensesGroup Group Parent Parent2010 2009 2010 2009$000 $000 $000 $000Fees to auditors– statutory audit 165 173 135 134– non-audit-related services 13 – 13 –Change in debtors impairment 142 53 141 50Directors’ remuneration 306 334 306 334Donations and scholarships 88 124 88 123Rent 4,120 3,715 5,835 2,772Research and Development 601 730 601 729Fuel 2,258 3,113 1,982 2,601Electricity 2,463 2,062 2,163 1,784Rates 3,591 3,515 3,322 3,312Other 6,362 6,713 4,978 4,808Total Other Operating Expenses 20,109 20,532 19,564 16,647The non-audit-related services expense relates to the secondment to <strong>Landcorp</strong> of a junior accountant from <strong>Landcorp</strong>’s auditors during 2009/10.The accountant is not a member of the audit team.Note 19 – Net Finance CostsGroup Group Parent Parent2010 2009 2010 2009$000 $000 $000 $000Interest on bank accounts and loans (6,396) (12,089) (6,396) (12,085)Interest capitalised on construction of assets 231 344 231 328Net cash flows from interest rate derivatives (5,289) (1,085) (5,289) (1,085)Net interest expense (11,454) (12,830) (11,454) (12,842)Interest received 88 89 3,174 6,625Net Finance Costs (11,366) (12,741) (8,280) (6,217)Lower loan interest costs reflect lower debt levels during the year resulting from the sale of farms, as described in Note 36.Interest income and expense on <strong>Landcorp</strong>’s transactional bank accounts are presented net with interest expense on bank loans as <strong>Landcorp</strong>manages its daily cash requirements jointly with its debt programme. This presentation is considered to reflect the substance of <strong>Landcorp</strong>’sfunding costs.Interest has been capitalised on the construction of assets at <strong>Landcorp</strong>’s weighted average interest rate applicable over the time of construction,4.57% (2009 5.81%).Net cashflows from interest rate derivatives are presented within net interest expense as all interest rate derivatives are held to hedge <strong>Landcorp</strong>’sfunding costs.70
Note 20 – Effect of DroughtDuring 2009/10, the upper North Island of New Zealand experienced a major drought. A number of <strong>Landcorp</strong>’s properties were impacted by thisdrought, which materially affected feed conditions on affected properties. The drought markedly increased farming costs, especially purchased feedcosts, which were much higher than budget due to both increased feed prices and the requirement to purchase higher quantities than expected.In addition, there was a reduction in both milk and livestock production due to this drought.In 2008/09, <strong>Landcorp</strong> incurred carry-over effects from the severe widespread drought of 2007/08. The predominant 2008/09 effects were a lowerlambing percentage, carry-over costs and additional feed costs.<strong>Landcorp</strong> has estimated the cost of these droughts as follows:Group Group Parent Parent2010 2009 2010 2009$000 $000 $000 $000Forgone RevenueReduced livestock sales values 929 8,400 929 8,400Reduced milk revenue 3,165 900 3,165 9004,094 9,300 4,094 9,300Increased ExpensesPurchased Feed 285 200 285 200Grazing 386 100 386 100Other costs 100 200 100 200771 500 771 500Total Estimated Cost of Drought 4,865 9,800 4,865 9,800The estimated costs of the droughts are based on the following assumptions:Reduced milk revenue is based on reduced milk production from budget specifically identified on drought affected properties, valued at <strong>Landcorp</strong>’saverage sales price. <strong>Landcorp</strong> considers that the milk production budget on these drought affected properties would have been met if there hadbeen a ‘normal’ milking season.Reduced livestock sales are based on the estimated loss on lower lamb and cattle finishing weights.Increased expenses are based on specifically identified expenses arising from the drought.Note 21 – Accounts ReceivableGroup Group Parent Parent2010 2009 2010 2009$000 $000 $000 $000Trade debtors 3,647 2,778 3,512 2,607Receivable from subsidiaries – – 590 418Milk income receivable 13,414 9,051 10,441 6,087Other receivables and prepayments 11,107 9,011 10,091 7,461Total Accounts Receivable 28,168 20,840 24,634 16,573The increased milk income receivable reflects a higher forecast milk price this season, combined with slightly higher production levels.See Note 36 for the impairment of accounts receivable.71
LANDCORP FARMING LIMITED AND SUBSIDIARIESNOTES TO THE FINANCIAL STATEMENTS CONTINUEDNote 22 – InventoryInventory at the end of the year comprised:Group Group Parent Parent2010 2009 2010 2009$000 $000 $000 $000Agricultural produce:Wool 167 817 167 811Velvet 1,161 849 1,161 849Harvested feeds 6,772 7,498 6,772 7,498Consumables 2,818 3,336 1,664 1,540Total Inventory 10,918 12,500 9,764 10,698<strong>Landcorp</strong> does not have systems to record on-farm production and use of harvested feeds so is unable to quantify the total amount of agriculturalproduce produced and consumed during the period. Harvested feeds are only measured at balance date. The decline in the value of harvestedfeeds reflects the decreased quantity of harvested feed at 30 June 2010, as described in Note 12.Note 23 – Property Held for SaleProperty held for sale comprises:Group Group Parent Parent2010 2009 2010 2009$000 $000 $000 $000Development land 7,550 8,145 – –Farmland 29,130 30,233 11,925 13,508Buildings 954 544 275 292Total Property Held for Sale 37,634 38,922 12,200 13,800The Parent’s property held for sale comprises farms that have been identified as either a poor strategic fit for the business, or have a higheralternative use value than farming. Sales of these farms is expected to occur within one year.Development land held for sale is land that is being developed by either jointly controlled entities (refer Note 11) or <strong>Landcorp</strong> Estates Ltddirectly. Land being developed by jointly controlled entities will be sold by the Group to the jointly controlled entity when the developmentis complete. Land being developed directly by <strong>Landcorp</strong> Estates comprises developed residential sections that are currently being marketed.72
Note 24 – LivestockA – NATURE OF ACTIVITIES<strong>Landcorp</strong> is primarily a pastoral farming company, with most of its revenue being derived from livestock. Most livestock classes are primarilygrown for sale to meat processors. These may also provide ancillary income from various agricultural produce, such as wool and velvet.Dairy cattle are primarily held to produce milk (see Note 7).The quantity of livestock owned by <strong>Landcorp</strong> at 30 June is shown below. <strong>Landcorp</strong>’s mature livestock are primarily breeding livestock andlivestock held for production (e.g. dairy cows held for milk production). Immature livestock held at 30 June are either replacement breedinglivestock or livestock that take more than one farming season to grow to intended marketable size. Livestock numbers do not include livestockowned by sharemilkers.Group Group Parent Parent2010 2009 2010 2009head head head headSheepMature 422,181 438,666 422,101 438,652Immature 178,075 168,550 176,787 167,022Total Sheep 600,256 607,216 598,888 605,674BeefMature 34,245 35,410 33,151 33,681Immature 52,480 56,342 51,840 56,017Total Beef Cattle 86,725 91,752 84,991 89,698DairyMature 31,311 25,452 23,654 19,607Immature 19,578 25,691 14,482 19,363Total Dairy Cattle 50,889 51,143 38,136 38,970DeerMature 60,380 60,567 60,380 60,567Immature 44,939 42,827 44,939 42,827Total Deer 105,319 103,394 105,319 103,394OtherMature 171 306 171 306Immature 10 4 10 4Total Other Livestock 181 310 181 310Total Livestock 843,370 853,815 827,515 838,046Financial risk management strategies relating to livestock are discussed in Note 36.B – VALUE OF LIVESTOCKThe value of livestock at 30 June was:Group Group Parent Parent2010 2009 2010 2009$000 $000 $000 $000Sheep 62,536 61,683 62,417 61,615Beef 59,483 61,927 57,947 60,091Dairy 54,890 51,027 41,160 38,797Deer 34,808 43,370 34,808 43,370Other 34 43 34 40Total Value of Livestock 211,751 218,050 196,366 203,913Livestock fair values are established as follows:Livestock held for breeding or production purposes are valued using the Inland Revenue Department’s (IRD) national average market values(NAMVs). NAMVs are calculated annually by the IRD based on a survey of nominated livestock valuers of good quality livestock on farm.These survey results are weighted averaged based on national livestock populations.73
LANDCORP FARMING LIMITED AND SUBSIDIARIESNOTES TO THE FINANCIAL STATEMENTS CONTINUEDNote 24 – Livestock (continued)<strong>Landcorp</strong> considers that its livestock breeds are representative of the national livestock breeds and that <strong>Landcorp</strong>’s geographic distribution oflivestock is not materially different from national averages.The <strong>Landcorp</strong> Board considers whether there is any evidence of material change in NAMVs between the publication of NAMVs and the 30 Junebalance date. As at 30 June 2010, <strong>Landcorp</strong> considered NAMVs to be an appropriate fair value for livestock held for breeding or production.Livestock held for slaughter purposes are valued based on quoted market prices.The change in the value of livestock owned by <strong>Landcorp</strong> during the year was due to:Group Group Parent Parent2010 2009 2010 2009Note $000 $000 $000 $000Livestock value at start of year 218,050 201,428 203,913 180,440Value changes caused by:Birth and growth of animals 6 72,032 71,697 68,344 68,711Purchases 2,674 4,617 2,870 4,232Livestock losses 6 (8,850) (9,570) (8,446) (8,778)Livestock available for sale or production 283,906 268,172 266,681 244,605Book value of stock sold 6 (67,514) (57,698) (64,508) (55,552)Effect of price changes (4,641) 7,576 (5,807) 14,860Livestock Value at End of Year 211,751 218,050 196,366 203,913The effect of price changes for the year were mainly due to a decline in the market value of deer, which was partially offset by higher valuesof sheep and dairy cattle. As the majority of these gains arise on livestock held for breeding and/or production, rather than sale, these gains arestated at a particular time and do not represent cash flows that are realised in the ordinary course of livestock farming.Livestock are classified as current assets if they are likely to be sold within one year. This includes a proportion of the breeding livestock that arelikely to be sold as cull animals.Group Group Parent Parent2010 2009 2010 2009$000 $000 $000 $000Current 61,764 66,763 58,084 63,421Non-current 149,987 151,287 138,282 163,965Total Value of Livestock 211,751 218,050 196,366 227,38674
Note 25 – ForestsA – NATURE OF ACTIVITIES<strong>Landcorp</strong>’s exotic forests are managed as an ancillary activity to farming. Land is allocated for forestry use when it is considered better suitedto forestry than for pastoral farming. Factors included in this decision include the viability of pastoral farming and land development activity,soil types, local climate and erosion control.Forests are considered economically viable where the forest stand is at least two hectares in size. Forests over 20 years of age are consideredharvestable, with prime harvest age around 25 years. The age of <strong>Landcorp</strong>’s forests are shown below:Group Group Parent Parent2010 2009 2010 2009Hectares Hectares Hectares HectaresForest ageLess than 10 years 2,118 1,975 1,543 1,46110 – 15 years 445 843 379 80115 – 20 years 842 426 842 42620 – 25 years 544 606 543 605Greater than 25 years 894 880 882 868Total Forest Area 4,843 4,730 4,189 4,161Financial risk management strategies relating to forestry are discussed in Note 36.B – VALUE OF FORESTSThe change in the value of forests owned by <strong>Landcorp</strong> during the year was due to:Group Group Parent Parent2010 2009 2010 2009Note $000 $000 $000 $000Forest value at beginning of year 8,648 9,805 8,092 8,978Costs capitalised to the forest crop 1,452 1,204 1,295 933Value change due to:Growth 9 1,179 1,070 1,167 1,054Valuation change 55 (2,241) 64 (2,082)Book value of forest felled 9 (588) (1,190) (588) (791)Book value of forest sold – – – –Forest Value at End of Year 10,746 8,648 10,030 8,092Forest valuations at 30 June 2010 were provided by P F Olsen Ltd. A before-tax market discount rate of 12% was used, based on the size of<strong>Landcorp</strong>’s forest stands and market prices for timber sales.During 2009/10 <strong>Landcorp</strong> Farming was allocated 42,434 New Zealand <strong>Unit</strong>s (“carbon credits”) for sections of its post-1990 forests(refer Note 27). In the event that these forest areas are harvested, a liability equivalent to the decrease in carbon will be incurred.Forests are classified as current if they are intended to be harvested within one year.Group Group Parent Parent2010 2009 2010 2009$000 $000 $000 $000Current 1,200 1,200 1,200 1,200Non-current 9,546 7,448 8,830 6,892Forest Value at End of Year 10,746 8,648 10,030 8,09275
LANDCORP FARMING LIMITED AND SUBSIDIARIESNOTES TO THE FINANCIAL STATEMENTS CONTINUEDNote 26 – Other Financial Assets and LiabilitiesGroup Group Parent Parent2010 2009 2010 2009$000 $000 $000 $000Other Financial AssetsExternal Financial AssetsAvailable-for-sale financial assetsShare investments 43,547 41,781 30,950 29,753Internal Financial AssetsShares in subsidiaries – – 164,404 149,458Loans to subsidiaries – – 54,713 73,913Total Other Financial Assets 43,547 41,781 250,067 253,124Other Financial LiabilitiesFinancial liabilities measured at amortised costBank loans 149,400 181,800 149,400 181,800Held-for-trading financial liabilitiesInterest rate derivatives 10,642 7,306 10,642 7,306Commodity derivatives 35 – 35 –Financial guaranteesFinancial guarantees – – – –Total Other Financial Liabilities 160,077 189,106 160,077 189,106Financial assets and liabilities are classified according to NZ IFRS criteria, the names of which may not reflect <strong>Landcorp</strong>’s intent for holding theassets and/or liabilities.<strong>Landcorp</strong>’s external share investments are largely in cooperative and processing companies where shareholding is required to supply thatcompany and/or to facilitate normal farming operations. As such, the Group is normally unable to sell these investments and continue theGroup’s business operations.Derivative financial instruments are used by the Group to hedge interest rate, foreign exchange and commodity risks. <strong>Landcorp</strong> has elected not touse hedge accounting, which, under NZ IFRS, requires all derivative financial instruments to be classified as held-for-trading. <strong>Landcorp</strong>’s financialmanagement policies explicitly prohibit trading in financial instruments.Financial risk management strategies relating to financial assets and liabilities are discussed in Note 36.A – Revaluation of Financial InstrumentsGroup Group Parent Parent2010 2009 2010 2009$000 $000 $000 $000Recognised in Profit and LossRevaluation of held-for-trading financial instruments (5,325) (8,049) (5,325) (8,049)Total Recognised in Profit and Loss (5,325) (8,049) (5,325) (8,049)Recognised directly in equityRevaluation of available-for-sale financial instruments (86) (7,112) (106) (4,886)Total Recognised Directly in Equity (86) (7,112) (106) (4,886)Total Gain/Loss on Revaluation (5,411) (15,161) (5,431) (12,935)76
Note 26 – Other Financial Assets and Liabilities (continued)B – Value of Financial InstrumentsThe valuation methods used to determine the fair values of those financial assets and liabilities that are measured at fair value in the statementof financial position are shown below, classified according to the NZ IFRS fair value hierarchy.Level 1 – Fair value determined by quoted prices (unadjusted) in active markets for identical assets or liabilities.Share InvestmentsThe majority of shares are valued using either quoted prices on a stock exchange or at prices set by cooperative companies that are based onestimated fair value. A small portion of the share portfolio (less than 10%) are unlisted equities or cooperatives whose share prices are set by thecooperative at a value other than estimated fair value. For these shares the fair value is estimated at the lower of the current cost to purchaseadditional shares, or required sales values in the case of cooperative companies with restricted shareholding requirements.Level 2 – Fair value based on inputs that are observed either directly (i.e. as prices) or indirectly (i.e. derived from prices).Interest Rate and Commodity DerivativesThe values of interest rate and commodity derivatives are based on estimated market values at balance date, given prevailing market interest ratesand the terms of the derivative instruments.C – Current and Non-Current Financial Assets and LiabilitiesFinancial assets are classified as current if they are expected to be realised within one year. Share investments include shares in dairy cooperatives,some of which require an annual adjustment in shares owned depending on production levels. This means that while the overall portfolio isnot expected to be realised in the short-term, minor sales of shares may be required once final production levels for the year ahead are known.On this basis, share investments are classified as non-current, unless specific sales of shares have been identified in the Business Plan.Loans to subsidiaries may be repaid at any time by the subsidiary. These are only classified as current if a subsidiary’s Business Plan includes netrepayment of debt within the next year.Group Group Parent Parent2010 2009 2010 2009$000 $000 $000 $000Other Financial AssetsCurrentInternal Financial AssetsLoans to subsidiaries – – 23,888 –Non-CurrentExternal Financial AssetsAvailable-for-sale financial assetsShare investments 43,547 41,781 30,950 29,753Internal Financial AssetsShares in subsidiaries – – 164,404 149,458Loans to subsidiaries – – 30,825 73,913Total Other Financial Assets 43,547 41,781 250,067 253,124Other Financial LiabilitiesCurrentFinancial liabilities measured at amortised costBank loans 44,400 56,800 44,400 56,800Held-for-trading financial liabilitiesInterest rate and commodity derivatives 1,732 1,408 1,732 1,408Non-CurrentFinancial liabilities measured at amortised costBank loans 105,000 125,000 105,000 125,000Held-for-trading financial liabilitiesInterest rate derivatives 8,945 5,898 8,945 5,898Total Other Financial Liabilities 160,077 189,106 160,077 189,10677
LANDCORP FARMING LIMITED AND SUBSIDIARIESNOTES TO THE FINANCIAL STATEMENTS CONTINUEDNote 26 – Other Financial Assets and Liabilities (continued)D – Bank LoansBank loans are the drawn components of bank cash advance facilities. The facilities may be borrowed against, or repaid, at any time by <strong>Landcorp</strong>.The facilities are subject to a negative pledge agreement which means that <strong>Landcorp</strong> may not grant a security interest over its assets without theconsent of its lenders. Facilities are either on a daily floating interest rate or a short-term fixed rate.Group Group Parent Parent2010 2009 2010 2009$000 $000 $000 $000Carrying Value 149,400 181,800 149,400 181,800Principal drawn 149,400 181,800 149,400 181,800Fair Value 149,400 181,800 149,400 181,800Cash advance facilities have been drawn as follows:Group Group Parent Parent2010 2009 2010 2009$000 $000 $000 $000Drawn 149,400 181,800 149,400 181,800Undrawn 55,600 68,200 55,600 68,200Total 205,000 250,000 205,000 250,000Cash advance facilities are committed to:Group Group Parent Parent2010 2009 2010 2009$000 $000 $000 $0000 – 6 months 100,000 125,000 100,000 125,0006 – 12 months – – – –One to two years 105,000 50,000 105,000 50,000Two to five years – 75,000 – 75,000Greater than five years – – – –Total 205,000 250,000 205,000 250,000E – Financial GuaranteesThe Parent is party to a bank account offset facility with other Group companies. This facility allows more efficient management of Group cashbalances and funding facilities. Under the facility individual company bank accounts are combined for interest payment calculations, and the bankhas the right to offset ‘in-funds’ accounts against ‘overdraft’ accounts in the event of default by any Group company. The maximum combinedtotal of all ‘overdraft’ accounts is $25 million.The fair value of this financial guarantee is considered to be immaterial, as all Group companies are considered solvent and no payments areexpected to be made under the guarantee.78
Note 27 – Intangible AssetsGroup Group Parent Parent2010 2009 2010 2009Note $000 $000 $000 $000Carbon CreditsFair ValueOpening balance – – – –Additions 777 – 777 –Net Carrying Amount 777 – 777 –Computer SoftwareCostOpening balance 3,243 2,974 3,243 2,974Additions 281 269 281 269Disposals (683) – (683) –Closing balance 2,841 3,243 2,841 3,243Accumulated AmortisationOpening balance (1,016) (466) (1,016) (466)Amortisation 16 (695) (550) (695) (550)Disposals 372 – 372 –Closing balance (1,339) (1,016) (1,339) (1,016)Net Carrying Amount 1,502 2,227 1,502 2,227Total Intangible Assets 2,279 2,227 2,279 2,227<strong>Landcorp</strong>’s intangible assets comprise carbon credits received under the Emissions Trading Scheme and farm management and financeinformation systems.<strong>Landcorp</strong> has commenced entering its eligible post-1989 forests into the Emissions Trading Scheme. During 2009/10 <strong>Landcorp</strong> earned42,434 New Zealand <strong>Unit</strong>s on 877 registered hectares. <strong>Landcorp</strong> has not yet received any carbon credits for pre-1990 forests.79
LANDCORP FARMING LIMITED AND SUBSIDIARIESNOTES TO THE FINANCIAL STATEMENTS CONTINUEDNote 28 – Property, Plant & EquipmentGroup Group Parent Parent2010 2009 2010 2009Note $000 $000 $000 $000Land and ImprovementsFreehold land and buildingsFair ValueOpening balance 1,123,581 1,203,756 1,123,581 1,203,756Additions 16,604 33,002 16,604 33,002Capitalised interest 19 220 328 220 328Disposals (43,227) (1,792) (43,227) (12,917)Reversal of depreciation on revaluation (1,256) (2,189) (1,256) (2,189)Revaluation increase/(decrease) (119,831) (96,316) (119,831) (98,399)Reclassified as property held for sale – – – –Reclassified as protected land 30 – (13,208) – –Reclassified from property held for sale – – – –Closing balance 976,091 1,123,581 976,091 1,123,581Accumulated DepreciationOpening balance – – – –Depreciation 16 (2,505) (2,544) (2,505) (2,544)Disposals 1,249 355 1,249 355Reversal on revaluation 1,256 2,189 1,256 2,189Closing balance – – – –Net carrying amount 976,091 1,123,581 976,091 1,123,581Buildings on leased landCostOpening balance 21,279 14,804 – –Additions 1,014 6,459 – –Capitalised interest 19 – 16 – –Disposals (2) – – –Closing balance 22,291 21,279 – –Accumulated DepreciationOpening balance (772) (421) – –Depreciation 16 (379) (351) – –Closing balance (1,151) (772) – –Net carrying amount 21,140 20,507 – –Total Land and Improvements 997,231 1,144,088 976,091 1,123,581Protected LandCostOpening balance 117,575 104,160 – –Reclassification from freehold land and buildings 30 – 13,208 – –Additions 230 207 – –Closing balance 117,805 117,575 – –Accumulated DepreciationOpening balance (201) (93) – –Depreciation 16 (126) (108) – –Closing balance (327) (201) – –Net carrying amount 117,478 117,374 – –80
Note 28 – Property, Plant & Equipment (continued)Group Group Parent Parent2010 2009 2010 2009Note $000 $000 $000 $000PlantCostOpening balance 44,208 38,950 35,686 31,438Additions 3,810 6,303 2,985 5,222Capitalised interest 11 – 11 –Disposals (2,084) (1,045) (1,819) (974)Closing balance 45,945 44,208 36,863 35,686Accumulated DepreciationOpening balance (19,987) (16,845) (18,152) (15,852)Depreciation 16 (3,970) (3,671) (3,171) (2,897)Disposals 1,080 529 1,018 597Closing balance (22,877) (19,987) (20,305) (18,152)Net carrying amount 23,068 24,221 16,558 17,534Motor VehiclesCostOpening balance 32,492 33,380 28,312 27,897Additions 4,318 3,891 3,676 3,509Disposals (2,674) (4,779) (1,580) (3,094)Closing balance 34,136 32,492 30,408 28,312Accumulated Depreciation and ImpairmentOpening balance (16,542) (16,270) (14,869) (14,145)Depreciation 16 (3,843) (3,832) (3,412) (3,285)Reduction in value due to impairment 12 – (137) – –Disposals 1,745 3,697 1,264 2,561Closing balance (18,640) (16,542) (17,017) (14,869)Net carrying amount 15,496 15,950 13,391 13,443Furniture and EquipmentCostOpening balance 6,290 5,937 5,905 5,577Additions 434 544 421 517Disposals (141) (191) (141) (189)Closing balance 6,583 6,290 6,185 5,905Accumulated DepreciationOpening balance (3,810) (3,305) (3,711) (3,259)Depreciation 16 (600) (647) (545) (593)Disposals 98 142 98 141Closing balance (4,312) (3,810) (4,158) (3,711)Net carrying amount 2,271 2,480 2,027 2,19481
LANDCORP FARMING LIMITED AND SUBSIDIARIESNOTES TO THE FINANCIAL STATEMENTS CONTINUEDNote 28 – Property, Plant & Equipment (continued)Group Group Parent Parent2010 2009 2010 2009Note $000 $000 $000 $000Computer EquipmentCostOpening balance 4,825 4,659 4,513 4,268Additions 403 181 403 259Disposals (16) (15) (15) (14)Closing balance 5,212 4,825 4,901 4,513Accumulated DepreciationOpening balance (4,043) (3,752) (3,822) (3,575)Depreciation 16 (439) (532) (385) (406)Disposals 21 241 13 159Closing balance (4,461) (4,043) (4,194) (3,822)Net carrying amount 751 782 707 691Total Net Carrying Amount 1,156,295 1,304,895 1,008,774 1,157,443Valuations of freehold land and buildings at 30 June 2010 were provided by Darroch Limited. The valuations take into account general factorsthat influence farm land prices and recent farm sales in the relevant regions. Factors specific to <strong>Landcorp</strong> that have been taken into account forvaluations include the following factors:• The effects of the Conservation Act 1987 relating to the establishment of marginal strips and conservation management planswhere applicable.• The effects of the Treaty of Waitangi (SOE Act) and the memorials pertaining to section 27B of the State Owned Enterprises Act 1986, whichprovides for the resumption of land on recommendation of the Waitangi Tribunal. In the North Island many section 27B memorials are inplace and their effect has been considered resulting in deductions from unencumbered current market value of 0-6%.• South Island properties include a deduction of up to 5%, reflecting the effect of the Right of First Refusal memorial to Ngai Tahu registeredon the title of those properties.All freehold land purchased from the <strong>Crown</strong> on commencement (1 April 1987) had a memorial placed on the title through the Treaty of Waitangi(State Enterprises) Act 1988. That Act provides for full compensation to the owner of any such land that is the subject of a successful land claim.Certain land not required for Treaty settlement has since had that memorial replaced with a statutory right of first refusal (in favour of Maori) onfuture sale by <strong>Landcorp</strong> or another <strong>Crown</strong> body.Property, plant and equipment under construction at balance date comprised:Group Group Parent Parent2010 2009 2010 2009$000 $000 $000 $000Land Development 1,588 2,742 1,536 2,677Buildings on freehold land 414 1,053 414 1,053Buildings on leased land 7 – – –Plant 210 255 210 255Motor vehicles 28 – 28 –2,247 4,050 2,188 3,985Had the Group’s freehold land and buildings (other than land and buildings classified as held for sale or included in a disposal group) andprotected land been measured on a historical cost basis, their carrying amount would have been as follows:Group Group Parent Parent2010 2009 2010 2009$000 $000 $000 $000Freehold Land 340,165 341,862 340,165 341,862Buildings on freehold land 59,510 60,403 59,510 60,403Total land and buildings at historical cost 399,675 402,265 399,675 402,26582
Note 29 – Accounts PayableGroup Group Parent Parent2010 2009 2010 2009$000 $000 $000 $000Trade creditors 7,863 6,876 6,654 5,898Payable to subsidiaries – – 5,291 401Land sales deposits held as stakeholder – 2,014 – 2,014Other land sales deposits received 4,929 5,153 4,929 5,153Other payables and accruals 3,672 8,914 2,998 1,030Total Accounts Payable and Accruals 16,464 22,957 19,872 14,496Note 30 – Redeemable Preference SharesIn September 2007, <strong>Landcorp</strong> signed an agreement (the “Agreement”) with its shareholder concerning the protection of certain <strong>Landcorp</strong> land.Under the Agreement, <strong>Landcorp</strong> identified properties it wished to sell and the shareholder decided which properties it wished to protect fromsale. The protected properties were transferred into a new subsidiary company (<strong>Landcorp</strong> Holdings Ltd), where they are owned and managed by<strong>Landcorp</strong> but accounted for separately from <strong>Landcorp</strong>’s other operations. The shareholder agreed to invest additional capital of $104.5 million in<strong>Landcorp</strong>, equivalent to the value of the protected properties ($103.4 million of land and improvements and forests of $1.1 million). <strong>Landcorp</strong> willtransfer the properties to the shareholder when required under the terms of the Agreement, with an equivalent value of Redeemable PreferenceShares being redeemed.The capital investment of $104.5 million by the shareholder comprises:• a one-off capital injection equal to half the value of the protected land. <strong>Landcorp</strong> received this capital injection of $52.2 million in October2007 and issued Redeemable Preference Shares equal to the injection.• The balance of $52.3 million is by way of diverting future dividends from <strong>Landcorp</strong> for up to four years and issuing Redeemable PreferenceShares equal to the dividend amounts. In October 2009, <strong>Landcorp</strong> diverted its 2008/09 annual dividend of $10 million and issuedRedeemable Preference Shares equal to the diverted dividend. Diversion of dividends are non-cash transactions as payments of dividend areoffset against the payment for the purchase of the Redeemable Preference Shares with no cash being paid or received. The dividend diversiontransactions are not recognised in the Statement of Cash Flows. To date, $35 million of dividends have been diverted to issue RedeemablePreference Shares. <strong>Landcorp</strong>’s 2009/10 dividend (to be paid October 2010) will be the final dividend diverted under the Agreement. <strong>Landcorp</strong>has declared a dividend for 2009/10 of $18 million (refer Note 32).As part of the Agreement, <strong>Landcorp</strong> will not sell any farms for four years to September 2011, other than those that were under contract or thatwere identified for sale and deemed not to be protected at the time the Agreement was signed, or when the shareholders agree to a sale.Redeemable preference shares issued under the Agreement are redeemable on demand by the share owner.In addition, Taurewa Station was incorporated into the Agreement in October 2008. The shareholder provided a $13.2 million cash injection inreturn for an equivalent value of Redeemable Preference Shares. Taurewa Station was transferred from <strong>Landcorp</strong> Farming Ltd to <strong>Landcorp</strong> HoldingsLtd after the encumbrances under section 40 of the Public Works Act 1981 were resolved (see Note 38).Redeemable preference shares carry no voting rights and are not eligible for dividends or any share of net assets on wind-up.Under NZ IFRS, these redeemable preference shares are required to be reported as a liability. <strong>Landcorp</strong> considers these redeemable preferenceshares as part of its equity, as shown in Note 31.Group Group Parent Parent2010 2009 2010 2009$000 $000 $000 $000Value at start of period 90,408 64,200 90,408 64,200Issued during period 10,000 26,208 10,000 26,208Value at End of Period 100,408 90,408 100,408 90,40883
LANDCORP FARMING LIMITED AND SUBSIDIARIESNOTES TO THE FINANCIAL STATEMENTS CONTINUEDNote 31 – Capital ManagementThe Group considers its capital as comprising all the components of Shareholders’ Equity and Redeemable Preference Shares (classified underNZ IFRS as a liability), as follows:Group Group Parent Parent2010 2009 2010 2009Comment $000 $000 $000 $000Share capital A 125,000 125,000 125,000 125,000Retained earnings B 100,292 106,167 225,400 243,064Revenue reserves C 68,792 78,758 67,922 79,054Fair value reserve D 1,409 1,444 3,741 3,762Asset revaluation reserves E 719,564 851,659 606,725 739,741Other equity F 222,114 196,621 210,755 185,262Total Shareholders’ Funds 1,237,171 1,359,649 1,239,543 1,375,883Redeemable preference shares G 100,408 90,408 100,408 90,408Total Managed Capital 1,337,579 1,450,057 1,339,951 1,466,291Under the State-Owned Enterprises Act, <strong>Landcorp</strong>’s ordinary shares may only be owned by the Ministers of Finance and State-Owned Enterprises.This prevents <strong>Landcorp</strong> from raising equity capital from other sources.<strong>Landcorp</strong> manages its capital such that a debt to equity level is maintained so that a target interest cover ratio is achieved. Dividends are paid bythe Group to the level that the remaining debt to equity ratio provides the targeted interest cover ratio over the five-year Business Plan budgetperiod. <strong>Landcorp</strong>’s target for dividend payments is to pay up to 75% of net operating profit (after tax).COMPONENTS OF CAPITALA – Share CapitalThe Parent’s shareholding is held equally by the Minister of Finance and the Minister for State-Owned Enterprises in terms of the State-OwnedEnterprises Act 1986. Ordinary shares carry one vote per share and carry the right to participate in dividends.All shares are fully paid up. Share capital comprises:ParentParent2010 2009000 shares 000 sharesOrdinary shares 125,000 125,000B – Retained EarningsRetained earnings comprises <strong>Landcorp</strong>’s accumulated net profits (excluding profits from the revaluations of livestock and financial assets) lessdividends paid. By excluding these price revaluations, and the components of other equity (refer comment F), retained earnings is an approximatemeasure of the accumulated cash profits retained by <strong>Landcorp</strong>.C – Revenue Reserves<strong>Landcorp</strong> has chosen to classify the net revaluations of livestock (biological assets revaluation reserve) and derivatives (financial assets revaluationreserve) separately from retained earnings. Under NZ IFRS the revaluations on these assets are required to be reported in the Statement ofComprehensive Income and, as a component of net profit after tax, initially form part of retained earnings. However, these revaluations do notrepresent cash flows and, especially in the case of livestock, cannot be realised in the ordinary course of livestock farming.D – Fair Value ReserveThe fair value reserve comprises the cumulative net change in the fair value of available-for-sale financial assets, until the investment is derecognised.E – Asset Revaluation ReservesThe asset revaluation reserves are used to record changes in the fair value of individual land and buildings.F – Other EquityOther equity represents transfers from assets revaluation reserves of asset revaluations, when the associated asset is sold. Given that most of<strong>Landcorp</strong>’s property sales reflect changes in the composition of land holdings, rather than reductions, these transfers are not usually realised ona portfolio basis. Hence, other equity is not a cashflow realised for distribution and can be considered a form of asset revaluation reserve.G – Redeemable Preference SharesRedeemable preference shares are used as a capital injection to compensate <strong>Landcorp</strong> for the land under the Agreement for Protected Land asdescribed in Note 30.84
Note 32 – DividendsParent Parent Parent Parent2010 2009 2010 2009Cents per share $000 $000Ordinary sharesInterim dividend – – – –Final dividend 8.0 10.4 10,000 13,000Total Dividends for Year 8.0 10.4 10,000 13,000A final dividend for 2010 of $18.0 million was declared in August 2010 (2009 $10.0 million). Under the Agreement Concerning <strong>Landcorp</strong> LandProtected From Sale $17.4 million of this dividend will be reinvested in <strong>Landcorp</strong> as redeemable preference shares, with the proceeds beinginvested in a subsidiary company that is holding land that is protected from sale (see Note 30). The balance will be paid to the shareholders.Redeemable preference shares are not eligible to participate in dividend payments.Note 33 – Non-cash TransactionsUnder the Agreement Concerning <strong>Landcorp</strong> Land Protected from Sale, <strong>Landcorp</strong>’s dividend payments are diverted to pay for the <strong>Crown</strong>’s purchaseof redeemable preference shares (see Note 30). During 2009/10 <strong>Landcorp</strong> declared (from 2008/09 profits) a dividend of $10 million (2009$13 million). The cash payment for this dividend was offset against the payment from the <strong>Crown</strong> for the purchase of 10 million $1 redeemablepreference shares (2009 13 million shares). As no cash flows occurred, this transaction has not been recognised in the Statement of Cash Flows.Note 34 – Income TaxA – INCOME TAX EXPENSETax expense/(income) recognised for the year was:Group Group Parent Parent2010 2009 2010 2009$000 $000 $000 $000Current tax expense/(income)Current tax expense/(income) for year (10,612) (9,279) (8,800) (5,708)Adjustments to prior year 6,379 170 5,419 (254)Effect on recognised tax losses due to change in income tax rate 3,727 – 3,098 –(506) (9,109) (283) (5,962)Deferred tax expense/(income)Temporary differences 5,040 (3,458) 1,683 (3,814)Adjustments to prior year – – – –Effect on deferred tax balances due to change in income tax rate (1,066) – (1,003) –3,974 (3,458) 680 (3,814)Total Income Tax Expense/(Income) 3,468 (12,567) 397 (9,776)85
LANDCORP FARMING LIMITED AND SUBSIDIARIESNOTES TO THE FINANCIAL STATEMENTS CONTINUEDNote 34 – Income Tax (continued)The prima facie income tax expense on accounting profit reconciles to the recognised tax expense/(income) as follows:Group Group Parent Parent2010 2009 2010 2009$000 $000 $000 $000Profit before tax (2,373) (2,237) (18,399) 21,315Income tax expense /(income) calculated at 30% (712) (671) (5,520) 6,395Prior year current tax adjustments 6,379 170 5,419 (254)Increase in income tax expense due to:Non-deductible expenses 5,916 50 11,271 50Unrecoverable development expenditure 43 95 – –Non-deductible asset impairment – (6) – –Donations 26 4 26 4Other (462) 3,298 (28) 2,723Decrease in income tax expense due to:Land development expenditure (9,459) (4,286) (9,205) (3,823)Deductions arising from livestock (1,685) (8,787) (1,871) (10,664)Non assessable income 140 1,560 (477) (368)Other 726 (3,994) (1,313) (3,839)Effect on tax balances due to change in income tax rate 2,556 – 2,095 –Total Income Tax Expense/(Income) 3,468 (12,567) 397 (9,776)The corporate income tax rate in New Zealand was changed from 30% to 28% with effect from the 2011/12 tax year. Due to <strong>Landcorp</strong>’s taxyear, this will be effective for <strong>Landcorp</strong> from 1 July 2011. This revised rate has not impacted the tax payable for the current period but will doso in future periods. The impact of the change in tax rate has been taken into account in the measurement of deferred taxes at the end of thereporting period.B – DEFERRED INCOME TAX RECOGNISED DIRECTLY IN EQUITY AND OTHER COMPREHENSIVE INCOMEThe following deferred amounts were charged/(credited) directly to equity during the period:Group Group Parent Parent2010 2009 2010 2009$000 $000 $000 $000Property, plant and equipmentEffect on tax balances due to change in income tax rate (1,128) – (1,128) –Property revaluations (1,584) (6,358) (1,584) (6,358)Available-for-sale financial assetsEffect on tax balances due to change in income tax rate (41) – (107) –Revaluations of available-for-sale financial assets (30) (2,138) (50) (1,470)Total Deferred Income Tax Recognised Directly In Equityand Other Comprehensive Income (2,783) (8,496) (2,869) (7,828)86
Note 34 – Income Tax (continued)C – DEFERRED TAX BALANCESDeferred tax balances at balance date were:Group Group Parent Parent2010 2009 2010 2009$000 $000 $000 $000Deferred taxation assetTemporary differences 7,868 6,203 6,221 3,928Tax losses recognised 51,927 51,420 43,111 43,08659,795 57,623 49,332 47,014Deferred taxation liabilityTemporary differences (42,668) (39,811) (37,604) (37,499)(42,668) (39,811) (37,604) (37,499)Net deferred taxation asset/(liability) 17,127 17,812 11,728 9,515Current taxation asset/(liability) – – – –Net Taxation Asset/(Liability) 17,127 17,812 11,728 9,515The availability of the tax losses recognised is subject to the requirements of the income tax legislation being met.Taxable and deductible temporary differences arise from the following:Balance SheetTax Expense/(Income)Group Group Group Group2010 2009 2010 2009$000 $000 $000 $000GroupDeferred tax assets:Trade and other receivables 40 – (40) 4Inventories 642 1,133 491 1,552Available-for-sale financial assets 908 994 754 –Property, plant and equipment 92 113 21 (23)Fair-value-through-profit-&-loss financial assets 2,989 2,192 (797) (2,192)Tax bases without a liability carrying amount 14 15 1 1Trade and other payables 1,261 – (1,261) 121Provisions 1,922 1,756 (166) (95)7,868 6,203 (997) (632)Deferred tax liabilities:Trade and other receivables 2,521 19 2,502 19Inventories 17,365 18,126 (761) (1,489)Available-for-sale financial assets 1,454 1,612 (755) –Fair-value-through-profit-&-loss financial assets – – – (224)Property, plant and equipment 21,328 20,054 3,985 (1,132)Trade and other payables – – – –42,668 39,811 4,971 (2,826)Deferred Tax Expense/(Income) 3,974 (3,458)87
LANDCORP FARMING LIMITED AND SUBSIDIARIESNOTES TO THE FINANCIAL STATEMENTS CONTINUEDNote 34 – Income Tax (continued)Balance SheetTax Expense/(Income)Parent Parent Parent Parent2010 2009 2010 2009$000 $000 $000 $000ParentDeferred tax assets:Inventories 58 – (58) 2,685Property, plant and equipment 92 91 (1) (1)Fair-value-through-profit-&-loss financial assets 2,989 2,192 (797) (2,192)Tax bases without a liability carrying amount 14 15 1 –Trade and other payables 1,261 – (1,261) 121Provisions 1,807 1,630 (177) (88)6,221 3,928 (2,293) 525Deferred tax liabilities:Trade and other receivables 1,261 19 1,242 23Inventories 17,183 18,126 (943) (1,043)Available-for-sale financial assets 1,454 1,612 – –Fair-value-through-profit-&-loss financial assets – – – (224)Property, plant and equipment 17,706 17,742 2,674 (3,095)Trade and other payables – – – –37,604 37,499 2,973 (4,339)Deferred Tax Expense/(Income) 680 (3,814)D – IMPUTATION CREDIT ACCOUNT BALANCESParentParent2010 2009$000 $000Balance at beginning of the period 4,127 3,872Adjustment to prior year balances (608) –Attached to dividends received 303 264Attached to dividends paid – –RWT refunded – (9)Parent company balance at end of year 3,822 4,127Available through indirect interests in subsidiaries – –Imputation Credits Available Directly And Indirectly To Shareholders Of The Parent Company 3,822 4,12788
Note 35 – Reconciliation of Profit and Operating Cash FlowGroup Group Parent Parent2010 2009 2010 2009Note $000 $000 $000 $000Net profit after tax (5,841) 10,330 (18,796) 31,091Non cash itemsDepreciation and amortisation 16 12,557 12,235 10,713 10,275Non-cash livestock income 1,658 (9,043) 1,741 (8,613)Forest growth 9 (1,179) (1,070) (1,167) (1,054)Allocation of carbon credits (777) – (777)Dividends received from equity accounted joint ventures 11 300 1,250 – –Non-cash movement in equity accounted investments 11 (23) (382) – –Loss on impairment of subsidiary – – 17,854 –(Gain)/loss due to price changes on livestock 4,641 (7,576) 5,807 (14,860)(Gain)/loss due to price changes on forests (55) 2,241 (64) 2,082(Gain)/loss due to price changes on financial instruments 5,325 8,049 5,325 8,049(Gain)/loss on revaluation of property, plant and equipment 11,196 10,199 11,196 10,199Change in deferred tax asset 685 (21,128) (2,213) (16,232)Deferred tax on revaluation of assets 2,783 8,496 2,869 7,828Change in deferred tax liability due to other capital transactions – – – –Movement in working capital itemsInventories 1,582 (3,074) 934 (2,393)Accounts receivable (7,328) 204 (8,061) 10,632Accounts payable and accruals (6,493) 3,672 5,376 (1,137)Employee entitlements 1,201 387 1,148 354Items classified as Investing or Financing activitiesNet loss/(gain) on movement of assets (9,365) (2,866) (10,352) (5,513)Purchase of breeding stock 2,674 2,195 2,870 1,550Change in accounts receivable due to capital items (2,177) 1,780 (3,236) (6,053)Change in accounts payable due to capital items 6,720 (6,663) (3,132) (2,551)Net Cash Flows from Operating Activities 18,085 9,236 18,035 23,654Note 36 – Risk ManagementThe Group is exposed to various risks arising in the ordinary course of business. The Board of Directors authorises the use of financial instrumentsunder approved policy guidelines to manage financial risks. A Treasury Management Committee comprising the executive management team andan independent treasury advisor meet on a monthly basis to co-ordinate and oversee the operation of the treasury function. Details of these risksand risk management policies are explained below:A – Risks due to Agricultural ActivitiesThe Group is exposed to many financial risks relating to agricultural activities:Environmental and climatic risksLike all farmers, <strong>Landcorp</strong> is exposed to climatic and other environmental risks. <strong>Landcorp</strong>’s geographic spread of farms usually allows a high degreeof mitigation against adverse climatic (e.g. drought or flooding) and environmental (e.g. disease outbreaks) effects at a regional level. Whenadverse climatic events occur livestock are initially attempted to be accommodated on other <strong>Landcorp</strong> properties.The geographic spread of <strong>Landcorp</strong>’s forestry assets also provides a high degree of risk mitigation against risks associated with forestry, such as fireand disease.<strong>Landcorp</strong> has strong environmental policies and procedures aimed at compliance with environmental and other laws. Environmental policies aredesigned to be compliant with laws in target export markets as well as New Zealand law.89
LANDCORP FARMING LIMITED AND SUBSIDIARIESNOTES TO THE FINANCIAL STATEMENTS CONTINUEDNote 36 – Risk Management (continued)Commodity price risk<strong>Landcorp</strong> is exposed to risks arising from fluctuations in the price and sales volume of livestock and forestry. Where possible, <strong>Landcorp</strong> enters intosupply contracts for livestock to ensure sales volumes can be met by processing companies. <strong>Landcorp</strong> uses oil-price derivatives to hedge pricemovements on the majority of its petrol and diesel usage. Other than this, <strong>Landcorp</strong> is unable to use financial instruments to hedge commodityprice risk, due to a lack of effective hedging markets.<strong>Landcorp</strong> has diversified its main sources of livestock revenue across four product streams – sheep meat, beef, venison, milk – which provide lowerlevels of exposure to prices of any one commodity.Financing riskThe nature of livestock farming means that most of <strong>Landcorp</strong>’s revenue is received in the second half of the financial year, whereas expenses areincurred throughout the year. <strong>Landcorp</strong> manages this financing risk through budgeting and actively managing working capital requirements, as wellas maintaining credit facilities at levels sufficient to meet working capital requirements, as described in Note 26.B – Credit RiskCredit risk is the risk of loss arising from a counterparty to a contract failing to discharge its obligations. In the normal course of its business,<strong>Landcorp</strong> incurs credit risk from trade receivables and transactions with financial institutions. <strong>Landcorp</strong> has a credit policy, which is used to managethis exposure to credit risk. As part of this policy, credit evaluations are performed on all customers requiring credit over a certain amount. Limitson exposures are set and monitored on a regular basis. As at 30 June 2010 <strong>Landcorp</strong> did not have any significant concentrations of credit risk.<strong>Landcorp</strong>’s maximum credit exposure is shown below. <strong>Landcorp</strong> does not expect the non-performance of any obligations at balance date beyondthose estimated as impaired.Group Group Parent Parent2010 2009 2010 2009Note $000 $000 $000 $000Cash Balances 718 30 1,409 711Accounts Receivable 21 28,168 30,494 24,634 16,573Other Financial Assets 26 43,547 41,781 250,067 253,124Maximum Credit Exposure 72,433 72,305 276,110 270,408The status of accounts receivable at balance date was:Group Group Parent Parent2010 2009 2010 2009$000 $000 $000 $000Not yet due 27,969 30,048 24,455 16,147Past due – up to 30 days 79 146 65 132Past due – 31 to 60 days 114 47 113 46Past due – 61 to 90 days 1 161 1 161Past due – more than 90 days 5 92 – 87Total Accounts Receivable 28,168 30,494 24,634 16,573Accounts receivable are estimated to be impaired as follows:Group Group Parent Parent2010 2009 2010 2009$000 $000 $000 $000Gross accounts receivable 28,381 30,559 24,843 16,635Individual impairment (208) (37) (205) (34)Collective impairment (5) (28) (5) (28)Total Accounts Receivable 28,168 30,494 24,634 16,57390
Note 36 – Risk Management (continued)C – Liquidity RiskLiquidity risk is the risk that an entity will encounter difficulty in raising funds at short notice to meet financial commitments. The Group hasliquidity headroom available through term borrowing arrangements and specific funding for seasonal fluctuations (see Note 26).Every year the Group prepares a five-year Business Plan, which includes a forecast of funding requirements. The Treasury Management Committeereviews the required funding and assesses the appropriate level and term structure of funding facilities. Intra-year, <strong>Landcorp</strong>’s policies require thatcommitted funding facilities are greater than current quarter peak-funding requirements.The table below analyses the Group’s financial liabilities by period of contractual maturity. Parent numbers are not presented as they are notmaterially different from Group. Total amounts do not match to the Statement of Financial Position as contractual flows are the absoluteundiscounted amount of future cashflows, including forecast interest expense on interest-bearing liabilities.2010 0 – 6 6 – 12 One to Two to Greater than No fixedTotal months months two years five years five years maturityNote $000 $000 $000 $000 $000 $000 $000Group 2010LiabilitiesLand sales deposits 29 4,929 – – – – – 4,929Payable for land purchases 29 – – – – – – –Other accounts payable and accruals 29 11,535 11,535 – – – – –Employee entitlements 7,827 3,830 – – – – 3,997Other financial liabilities 26Bank loans 156,772 47,598 2,631 106,543 – – –Interest rate derivatives 10,642 865 865 1,408 5,118 2,386 –Commodity derivatives 35 18 17 – – – –Redeemable preference shares 31 100,408 – – – – – 100,408Total Contractual Maturity 292,148 63,846 3,513 107,951 5,118 2,386 109,3342009 0 – 6 6 – 12 One to Two to Greater than No fixedTotal months months two years five years five years maturityNote $000 $000 $000 $000 $000 $000 $000Group 2009LiabilitiesLand sales deposits 29 7,167 – – – – – 7,167Payable for land purchases 29 – – – – – – –Other accounts payable and accruals 29 15,790 15,790 – – – – –Employee entitlements 6,628 2,839 – – – – 3,789Other financial liabilities 26Bank loans 190,561 57,339 2,243 54,584 76,395 – –Interest rate derivatives 5,524 2,192 1,873 3,030 503 (2,074) –Redeemable preference shares 31 90,408 – – – – – 90,408Total Contractual Maturity 316,078 78,160 4,116 57,614 76,898 (2,074) 101,364Land sales deposits are the receipt of deposit monies for land sales that have not yet been recognised. <strong>Landcorp</strong> will only need to settle theseliabilities in cash if the sales contracts are cancelled.Redeemable preference shares arise from the protected land agreement (refer Note 31). These shares are likely to be redeemed by the transfer ofprotected land to the redeemable preference shareholder (the New Zealand Government).91
LANDCORP FARMING LIMITED AND SUBSIDIARIESNOTES TO THE FINANCIAL STATEMENTS CONTINUEDNote 36 – Risk Management (continued)D – Foreign Currency RiskForeign currency risk is the risk that <strong>Landcorp</strong>’s sales revenue will be impacted by fluctuations in foreign exchange rates. <strong>Landcorp</strong> is exposedto indirect foreign currency risk through the sale of products by processing companies to overseas markets. <strong>Landcorp</strong> has a foreign currencypolicy designed to limit the negative impact of exchange rate movements on revenue. Foreign currency risk is quantified and managed and thepolicy is to fix, either directly or indirectly, a minimum of 20 percent of sales revenue to mitigate the level of foreign currency risk. Sales revenueis fixed indirectly through the hedging activities of processing companies (such as milk processors) and sales contracts fixed in New Zealanddollars. Sales revenue is fixed directly with foreign currency derivatives, such as forward foreign exchange contracts and foreign currency options.At 30 June 2010, approximately 40% of 2010/11 revenue (2009 29%) was estimated to be fixed indirectly through the hedging activities ofprocessing companies. No direct foreign currency hedging was in place at 30 June 2010 (2009 none).E – Interest Rate RiskInterest rate risk is the risk of loss arising from changes in interest rates. <strong>Landcorp</strong> is exposed to interest rate risk on borrowings used to fundinvestment and ongoing operations. <strong>Landcorp</strong> has an interest rate risk management policy designed to identify and manage interest rate riskto ensure funding is obtained in a cost effective manner, to minimise the cost of borrowing and to provide greater certainty of funding costs.Management monitors the level of interest rates on an ongoing basis, and from time-to-time, will fix the rates of interest payable using derivativefinancial instruments. Forward rate agreements, interest rate swaps and interest rate options may be used for risk management purposes.Assets and liabilities will mature or re-price within the periods shown in the table below. Parent numbers are not presented as they are notmaterially different from Group, except for shares in subsidiaries, which are not interest rate sensitive, and loans to subsidiaries, which are atdaily floating interest rates (refer Note 26).Re-pricing Analysis 2010 Non-interest 0 – 6 6 – 12 One to Two to Greater thanEffective Total sensitive months months two years five years five yearsinterest rate $000 $000 $000 $000 $000 $000 $000Group 2010AssetsCash and Cash Equivalents 2.25% 718 – 718 – – – –Accounts Receivable 28,168 28,168 – – – – –Inventories 10,918 10,918 – – – – –Property intended for sale 37,634 37,634 – – – – –Livestock 211,751 211,751 – – – – –Forests 10,746 10,746 – – – – –Equity Accounted Investments 2,766 2,766 – – – – –Deferred Tax Asset 17,127 17,127 – – – – –Other Financial Assets 43,547 43,547 – – – – –Intangible Assets 2,279 2,279 – – – – –Property, Plant and Equipment 1,156,295 1,156,295 – – – – –LiabilitiesAccounts Payable and Accruals (16,464) (16,464) – – – – –Employee Entitlements 6.47% (7,829) (7,123) (706) – – – –Other Financial LiabilitiesBank loans 3.52% (149,400) – (149,400) – – – –Interest rate derivatives (10,642) – 104,566 – 228 4,564 (120,000)Commodity derivatives (35) (35) – – – – –Redeemable Preference Shares (100,408) (100,408) – – – – –Shareholders’ Funds (1,237,171) (1,237,171) – – – – –Re-pricing Profile – 160,030 (44,822) – 228 4,564 (120,000)The interest rate on term borrowing as amended by off balance sheet financial instruments was 6.19% per cent.92
Note 36 – Risk Management (continued)Re-pricing Analysis 2009 Non-interest 0 – 6 6 – 12 One to Two to Greater thanEffective Total sensitive months months two years five years five yearsinterest rate $000 $000 $000 $000 $000 $000 $000Group 2009AssetsCash and Cash Equivalents 2.00% 30 – 30 – – – –Accounts Receivable 30,494 30,494 – – – – –Inventories 12,500 12,500 – – – – –Property intended for sale 29,268 29,268 – – – – –Livestock 218,050 218,050 – – – – –Forests 8,648 8,648 – – – – –Equity Accounted Investments 3,043 3,043 – – – – –Deferred Tax Asset 17,812 17,812 – – – – –Other Financial Assets 41,781 41,781 – – – – –Intangible Assets 2,227 2,227 – – – – –Property, Plant and Equipment 1,304,895 1,304,895 – – – – –LiabilitiesAccounts Payable and Accruals (22,957) (22,957) – – – – –Employee Entitlements 6.47% (6,628) (5,882) (746) – – – –Other Financial LiabilitiesBank loans 3.29% (181,800) – (181,800) – – – –Interest rate derivatives (7,306) – 151,199 – 3,480 (61,985) (100,000)Redeemable Preference Shares (90,408) (90,408) – – – – –Shareholders’ Funds (1,359,649) (1,359,649) – – – – –Re-pricing Profile – 189,822 (31,317) – 3,480 (61,985) (100,000)The interest rate on term borrowing as amended by off balance sheet financial instruments was 5.57% per cent.F – Sensitivity AnalysisFor the 2010 year, it is estimated that the following movements in risk factors would have resulted in the following effects on net profit beforetax. The effects are all estimated after the effect of any hedging instruments used in the year, but do not include any potential price changes infinancial instruments at balance date.The sensitivity analysis is based on exposures arising over the 2009/10 year, rather than exposures at balance date, as <strong>Landcorp</strong>’s operations arehighly seasonal and the effect of risk exposures and hedging instruments at balance date do not reflect those experienced during the year.Group Group Parent Parent2010 2009 2010 2009$000 $000 $000 $000Interest rate riskNet finance costs would have changed by:OCR higher/lower by 1% (310) / +310 (520) / +520 (310) / +310 (520) / +520Foreign currency riskRevenue would have changed by:NZD 1% higher/lower against USD (739) / +755 (595) / +607 (559) / +570 (564) / +575NZD 1% higher/lower against EUR (373) / +380 (427) / +436 (371) / +378 (425) / +433NZD 1% higher/lower against GBP (145) / +148 (155) / +159 (144) / +146 (154) / +157NZD 1% higher/lower against all currencies (1,178) / +1,202 (1,178) / +1,202 (1,073) / + 1,095 (1,142) / + 1,165Commodity price riskRevenue would have changed by:1% increase/decrease in all commodity prices +1,617 / (1,617) +1,560 / (1,560) +1,413 / (1,413) +1,398 / (1,398)93
LANDCORP FARMING LIMITED AND SUBSIDIARIESNOTES TO THE FINANCIAL STATEMENTS CONTINUEDNote 37 – Related PartiesUltimate Controlling PartyThe ultimate controlling party of <strong>Landcorp</strong> is the New Zealand Government.Key Management Personnel CompensationKey management personnel comprise directors and executive management personnel who have responsibility for planning, directing andcontrolling the activities of <strong>Landcorp</strong>.Key management personnel compensation comprised:GroupGroup2010 2009$000 $000Short-term employee benefits 2,146 2,158Post-employment benefits 90 812,236 2,239Short term employee benefits include salary, directors remuneration, medical and life insurance and the cost of any other fringe benefits incurredduring the year as well as any accrued performance payments due within one year.Post-employment benefits are contributions to defined contribution superannuation schemes, including employer KiwiSaver contributions.Other Related Party TransactionsThe Group undertakes many transactions with other <strong>Crown</strong> owned entities which are carried out on an arms length basis and in the normalcourse of business, as are all transactions within the <strong>Landcorp</strong> Group.The only material transaction with the <strong>Crown</strong> during the year was the sale of the Sweetwater dairy complex and Te Raite and Te Karae farms tothe <strong>Crown</strong> for $51 million. As part of the sales agreements, <strong>Landcorp</strong> will continue to operate the properties on a lease (Te Karae and Te Raite) andsharemilker (Sweetwater) basis for two years.<strong>Landcorp</strong> Farming Ltd holds shares in a number of cooperative suppliers and customers. These shareholdings are required to enable the Group totransact business with them. All transactions with these entities are on an arms length basis.No related party debts were written off during the year, and other than loans to subsidiaries, amounts owing at balance date were not materialto the Group.Transactions with jointly controlled entities are described in Note 11 – Equity Accounted Investments.Transactions with subsidiary companies are described in Note 40 – Subsidiary Companies.Transactions between the Group and entities in which Directors were associated, were undertaken at arms length. A list of entities in whichthe Directors have an interest are listed in the section entitled “Disclosures in Terms of the Companies Act 1993” in the Annual Report (see pages97 to 99).Note 38 – Contingent Assets and LiabilitiesAt 30 June 2010 <strong>Landcorp</strong> had the following contingent assets and liabilities:(a) Taurewa station (in the central plateau) was purchased from the <strong>Crown</strong> in 1987, with clear legal title. During 2006/07, when <strong>Landcorp</strong> triedto sell the property, it was discovered that this title was encumbered under section 40 of the Public Works Act, and may have been requiredto be offered back to the descendents of the original owners. Subsequently LINZ determined that Taurewa need not be offered back to thedescendents of the original owners on grounds of impracticability and title was transferred from <strong>Landcorp</strong> Farming to <strong>Landcorp</strong> Holdings.The claim for damages over the termination of a sales contract was fully provided for at 30 June 2010, following quantification of probabledamages. This claim was settled in July 2010 for approximately the amount provided for.(b) A revised cap and trade system for greenhouse gas emissions was passed into law in late 2009. Much of the detail of the scheme is yet to befinalised through Regulation, currently under development.As a pastoral farmer and forester, <strong>Landcorp</strong> will gain emission credits (“New Zealand <strong>Unit</strong>s”) and incur liabilities through the system. As thelegislation currently stands, <strong>Landcorp</strong> would receive credits for the pre-1990 forestry plantations. <strong>Landcorp</strong> has estimated that it would beeligible to receive around 136,000 carbon credits, for its pre-1990 forests. <strong>Landcorp</strong> is in the process of applying for these credits. In the eventthat pre-1990 forests are deforested, a deforestation liability would be incurred.<strong>Landcorp</strong> could claim credits on the post-1989 forest carbon sequestration, though an equal liability on a volume basis would be incurredon harvest. <strong>Landcorp</strong> has estimated that up to 88,000 carbon credits could be eligible to be claimed for 2008 and 2009 sequestration up to31 December 2009, although only 42,434 had been received by 30 June 2010 (refer Note 27). Should these plantations be harvested and/ordeforested, a liability would be incurred up to a maximum of the credits received.94
Note 38 – Contingent Assets and Liabilities (continued)For Pastoral farming emissions, <strong>Landcorp</strong> will receive credits in 2015 for approximately 90% of its pastoral emissions. This will result ina potential liability for the remaining 10% of emissions. The actual liability may be altered through the intensity approach which mayincrease or reduce the liability depending on <strong>Landcorp</strong>’s emissions intensity relative to the industry average. While the details of theimplementation of the scheme are still to be finalised, <strong>Landcorp</strong> has estimated its carbon equivalent emissions from livestock at around520,000 tonnes per annum.(c) Under the Agreement Concerning <strong>Landcorp</strong> Land Protected from Sale (refer Note 30), any accumulated gains (losses) on the protectedproperty will be paid to the <strong>Crown</strong> (reimbursed by the <strong>Crown</strong>) when that property is transferred to <strong>Crown</strong> ownership. During 2009/10the <strong>Crown</strong> signed an Agreement in Principle to settle a Treaty of Waitangi claim. This Agreement in Principle included the transfer of three<strong>Landcorp</strong> properties to Iwi, which were purchased from <strong>Landcorp</strong> Farming by the <strong>Crown</strong> during the year and one property held by <strong>Landcorp</strong>Holdings under the protected land agreement. <strong>Landcorp</strong> recognised the reimbursement receivable to date from the <strong>Crown</strong> for the affectedprotected property (refer Note 12). The reimbursement for losses incurred on the other protected properties has not been recognised by<strong>Landcorp</strong>. At 30 June 2010, this unrecognised reimbursement totalled $5.7 million (2009 $8.3 million).Note 39 – CommitmentsGroup Group Parent Parent2010 2009 2010 2009$000 $000 $000 $000Contracted capital commitments 817 568 493 280Operating lease commitments:Within one year 4,344 10,622 1,549 1,129One to two years 4,008 4,587 1,169 1,481Two to five years 12,521 13,226 3,005 3,058Later than five years 107,601 130,131 5,505 6,209Parent operating lease commitments relate to the lease of farmland and office space. Other Group operating lease commitments relate to thelong-term lease of farmland by <strong>Landcorp</strong> Pastoral Ltd that is currently undergoing pastoral conversion and farming. Under the terms of the landconversion and lease agreement, land parcels will be added to the lease each year and the lease commitment will increase over time.Note 40 – Subsidiary CompaniesBalancePercentage heldSubsidiaries Principal activity date 2010 2009<strong>Landcorp</strong> Estates Ltd Property development 30 June 100% 100%<strong>Landcorp</strong> Developments Ltd Land conversion and development 30 June 100% 100%<strong>Landcorp</strong> Pastoral Ltd Pastoral farming on leased land 30 June 100% 100%<strong>Landcorp</strong> Holdings Ltd Holding protected land 30 June 100% 100%During 2009/10, it was decided to amalgamate the activities of <strong>Landcorp</strong> Pastoral and <strong>Landcorp</strong> Developments into the parent on 1 July 2010to simplify operations. The accumulated losses incurred by these subsidiaries has been recognised as an impairment loss in 2009/10 withinthe parent.Transactions with subsidiary companies:During the year <strong>Landcorp</strong> Farming Ltd provided management and support services to its subsidiaries at a cost of $0.4 million (2009 $0.4 million).All inter-group transactions are undertaken at market value. During the year <strong>Landcorp</strong> Farming Ltd sold livestock and property, plant andequipment to subsidiaries at market value. At 30 June 2010, <strong>Landcorp</strong> Farming Ltd’s accounts receivable balance included $0.6 million (2009$0.4 million) owing from subsidiary companies and accounts payable had $5.3 million (2009 $0.4 million) owing to subsidiary companies.The increased amount owing in 2010 is primarily due to the pass-through of the <strong>Crown</strong>’s reimbursement of protected land losses through<strong>Landcorp</strong> Farming to <strong>Landcorp</strong> Holdings.Loans to subsidiaries at 30 June 2010 are mainly for the purchase of capital assets and working capital.The balance of loans at 30 June 2010 was $54.7 million (2009 $73.9 million) and is subject to interest charged at market rates. Total interest paidby subsidiaries to <strong>Landcorp</strong> Farming Ltd during the year amounted to $3.1 million (2009 $6.5 million).No subsidiary company debts were written off during the year.95
LANDCORP FARMING LIMITED AND SUBSIDIARIESAudit ReportTO THE READERS OF LANDCORP FARMING LIMITED AND GROUP’SFINANCIAL STATEMENTS FOR THE YEAR ENDED 30 JUNE 2010The Auditor-General is the auditor of <strong>Landcorp</strong> Farming Limited (the Company) and group. The Auditor-General has appointed me, Trevor Deed,using the staff and resources of Deloitte, to carry out the audit of the financial statements of the Company and group, on her behalf, for theyear ended 30 June 2010.Unqualified opinionIn our opinion:– The financial statements of the Company and group on pages 47 to 95:– comply with generally accepted accounting practice in New Zealand;– comply with International Financial Reporting Standards; and– give a true and fair view of:– the Company and group’s financial position as at 30 June 2010; and– the results of operations and cash flows for the year ended on that date.– Based on our examination the Company and group kept proper accounting records.The audit was completed on 30 August 2010, and is the date at which our opinion is expressed.The basis of our opinion is explained below. In addition, we outline the responsibilities of the Board of Directors and the Auditor, and explainour independence.Basis of opinionWe carried out the audit in accordance with the Auditor-General’s Auditing Standards, which incorporate the New Zealand Auditing Standards.We planned and performed the audit to obtain all the information and explanations we considered necessary in order to obtain reasonableassurance that the financial statements did not have material misstatements, whether caused by fraud or error.Material misstatements are differences or omissions of amounts and disclosures that would affect a reader’s overall understanding of thefinancial statements. If we had found material misstatements that were not corrected, we would have referred to them in our opinion.The audit involved performing procedures to test the information presented in the financial statements. We assessed the results of thoseprocedures in forming our opinion.Audit procedures generally include:– determining whether significant financial and management controls are working and can be relied on to produce complete and accuratedata;– verifying samples of transactions and account balances;– performing analyses to identify anomalies in the reported data;– reviewing significant estimates and judgements made by the Board of Directors;– confirming year-end balances;– determining whether accounting policies are appropriate and consistently applied; and– determining whether all financial statement disclosures are adequate.We did not examine every transaction, nor do we guarantee complete accuracy of the financial statements.We evaluated the overall adequacy of the presentation of information in the financial statements. We obtained all the information andexplanations we required to support our opinion above.Responsibilities of the Board of Directors and the AuditorThe Board of Directors is responsible for preparing the financial statements in accordance with generally accepted accounting practice inNew Zealand. The financial statements must give a true and fair view of the financial position of the Company and group as at 30 June 2010and the results of operations and cash flows for the year ended on that date. The Board of Directors’ responsibilities arise from the State-Owned Enterprises Act 1986 and the Financial Reporting Act 1993.We are responsible for expressing an independent opinion on the financial statements and reporting that opinion to you. This responsibilityarises from section 15 of the Public Audit Act 2001 and section 19(1) of the State-Owned Enterprises Act 1986.IndependenceWhen carrying out the audit we followed the independence requirements of the Auditor-General, which incorporate the independencerequirements of the New Zealand Institute of Chartered Accountants.Other than the audit, we have no relationship with or interests in the Company or any of its subsidiaries.Trevor DeedDeloitteOn behalf of the Auditor-GeneralWellington, New ZealandThis audit report relates to the financial statements of <strong>Landcorp</strong> Farming Limited and group (“<strong>Landcorp</strong>”) for the year ended30 June 2010 included on <strong>Landcorp</strong>’s website. <strong>Landcorp</strong>’s Board of Directors are responsible for the maintenance and integrity of<strong>Landcorp</strong>’s website. We have not been engaged to report on the integrity of <strong>Landcorp</strong>’s website. We accept no responsibility for anychanges that may have occurred to the financial statements since they were initially presented on the website. The audit reportrefers only to the financial statements named above. It does not provide an opinion on any other information which may have beenhyperlinked to/from these financial statements. If readers of this report are concerned with the inherent risks arising from electronicdata communication they should refer to the published hard copy of the audited financial statements and related audit report dated30 August 2010 to confirm the information included in the audited financial statements presented on this website. Legislation inNew Zealand governing the preparation and dissemination of financial statements may differ from legislation in other jurisdictions.96
Disclosures in Terms of the Companies Act 1993Interests register (Section 211(1)(e))Entries made in the interests register during the year covered particulars of directors’ interests, directors’ remuneration and directors’ andofficers’ liability insurance. Details are recorded under the separate headings below.Directors’ interests (Section 140)The following are particulars of general notices of disclosure of interest given by <strong>Landcorp</strong> directors during the year –Director Organisation PositionHon. J R Sutton CNZM Stone Hut Forest Investments Ltd Chairman and ShareholderW A Larsen CNZM Air New Zealand Ltd Director and ShareholderCentreport LtdChairmanJenkin Timber LtdDirectorLarsen Consulting LtdPrincipalFoundation for Research, Science and TechnologyDirectorA W Baylis Blackhead Quarries Ltd Chairman(Appointed 1.11.09) Blue River Dairy Products Ltd DirectorCarisbrook Stadium TrustTrusteeEdincorp Business Services LtdPrincipalHelicopters NZ LtdDirectorInstitute of Directors Accreditation BoardChairmanPort of Tauranga LtdDirector and ShareholderReal Journeys LtdChairmanScales Corporation LtdDirectorSouth Canterbury Finance LtdChairmanF R S Clouston Abacus Biotech Ltd Director and ShareholderPalliser Estate Wines of Martinborough LtdDirector and ShareholderPerpetual Funds Management LtdDirectorNZ Markets Disciplinary TribunalMemberNZICA Appeals CouncilMemberNew Zealand Red Cross FoundationTrusteeKirkcaldie & Stains LtdDirectorL B Henry Cranleigh Strategic Ltd Chairman(Retired 31.10.09) Cranleigh Capital Management Ltd ChairmanMedTech LtdDirectorAuckland University of TechnologyCouncil MemberChristchurch Arts Festival TrustTrusteeAsia New Zealand FoundationTrusteeVirtual Trade MissionTrusteeAUT Millennium <strong>Ownership</strong> TrustTrusteeMinter Ellison Rudd WattsSpecial CounselT Houpapa JP THS & Associates Ltd Director(Appointed 1.5.10) Waikato Bay of Plenty Franchise Board Director(Waikato Bay of Plenty Magic Netball)Strada Corporation LtdDirectorPemberton Construction LtdDirectorWaikato River Guardians Establishment CommitteeMember (<strong>Crown</strong> Appointee)Federation of Maori AuthoritiesChairman, Tainui DelegateTe Uranga B2 IncorporationCommittee of ManagementMaori Women’s Welfare LeagueWaiariki Regional Council MemberPuwaha Ki Te Ao TrustTrustee97
LANDCORP FARMING LIMITED AND SUBSIDIARIESDISCLOSURES IN TERMS OF THE COMPANIES ACT 1993 CONTINUEDDirector Organisation PositionM L James Farmers Mutual Group Ltd DirectorFarmers Mutual Finance LtdDirectorStaples Rodway (Taranaki) LtdDirectorTSB Community TrustTrusteeNew Zealand Institute of Highway TechnologyDirectorJ M Mitchell Loganburn Station Ltd Director & ShareholderTe Hau Farm (Marlborough) LtdDirector & ShareholderOkiwa Holdings LtdDirector & ShareholderClifford Bay Marine Farms LtdShareholderB J Morrison CNZM,JP Basil J Morrison & Associates PrincipalWaiuta Farms LimitedDirector and ShareholderNZ Conservation AuthorityMemberNZ Geographic BoardMemberLocal Government Superannuation Trust LtdChairmanWaitangi TribunalMemberCivic Assurance (NZ Local GovernmentDirectorInsurance Corporation Ltd)Lotteries Significant Projects Funding CommitteeMemberLotteries Communities Facilities CommitteeMemberM R Mullins MNZM Massey University Council Council Member(Retired 30.4.10) Paewai Mullins Systems Ltd DirectorP M Shearing LtdDirectorTe Huarahi Tika TrustChairmanAohanga IncorporationChairmanAtihau Whanganui IncorporationDirectorPoutama Maori Business TrustChairmanHautaki LtdDirectorUse of company information (Section 145)No requests were received from directors to use company information which they obtained in their capacity as directors and which would nototherwise have been available to them.98
Share dealings (Section 148)No director owned, acquired or disposed of equity securities in <strong>Landcorp</strong> Farming Ltd or its subsidiaries, <strong>Landcorp</strong> Pastoral Ltd, <strong>Landcorp</strong>Developments Ltd, <strong>Landcorp</strong> Estates Ltd and <strong>Landcorp</strong> Holdings Ltd, during the year.Directors’ remuneration and other benefits (Sections 161 and 211(1)(f))Directors of <strong>Landcorp</strong> Farming Ltd and <strong>Landcorp</strong> Pastoral Ltd received remuneration as recorded below. No remuneration or other benefitswere paid to the directors of <strong>Landcorp</strong> Estates Ltd, <strong>Landcorp</strong> Developments Ltd or <strong>Landcorp</strong> Holdings Ltd.Dollars in thousands 2010 2009<strong>Landcorp</strong> Farming Ltd and<strong>Landcorp</strong> Pastoral LtdHon. J R Sutton (Chairman) 71 71W A Larsen (Deputy Chairman) 47 47A W Baylis (appointed November 2009) 23 –F R S Clouston 35 35L B Henry (retired October 2009) 12 35T Houpapa (appointed May 2010) 6 –M L James 40 40J M Mitchell (appointed May 2009) 35 6B J Morrison 35 35M R Mullins (retired April 2010) 29 35C M Williams (retired April 2009) – 29The only other benefit received by directors during the year was the provision of an insurance cover for directors’ and officers’ liability.Employees’ remuneration and other benefits (Section 211(1)(g))Set out below are the numbers of employees and former employees whose total remuneration (including non-cash benefits and fringe benefittax) was within the specified bands –GroupGroupDollars in thousands 2010 2009100 – 109 6 8110 – 119 11 8120 – 129 5 6130 – 139 9 7140 – 149 7 6150 – 159 3 2160 – 169 4 2190 – 199 1 1220 – 229 3 1230 – 239 1 3260 – 269 1 1520 – 529 1 1Redundancy and leave payments are excluded from these figures.Indemnity and insurance (Sections 162 and 211(1)(f))During the year the Board resolved to continue with an insurance cover of $20 million to provide indemnity for directors’ and officers’ liabilitywith the premium costs being met by <strong>Landcorp</strong>.99
LANDCORP FARMING LIMITED AND SUBSIDIARIESDirectoryBoard of DirectorsHon. Jim Sutton CNZMChairmanWarren Larsen CNZMDeputy ChairmanBill BaylisFalcon CloustonTraci Houpapa JPMarise JamesJane MitchellBasil Morrison CNZM, JPAuditorTrevor Deed(under appointment by theController and Auditor-General)DeloitteWellingtonSolicitorsBuddle FindlayWellingtonRickit LawWellingtonBankersWestpac Banking CorporationANZ National Bank LtdCommonwealth Bank ofAustraliaCorporate andRegistered Office15 Allen StreetPO Box 5349WellingtonTel: (04) 381 4050Fax: (04) 384 1194Chief Executive:Chris KellyChief Financial Officer:Richard PerryCompany Secretary:John Kennedy-GoodNational Manager–Services and Strategy:Collier IsaacsNational Manager – Property:Gerry SoanesNational Business Managers:Graeme MulliganAllan StillNational Manager Marketingand Procurement:Phil McKenzieHead of Genetics <strong>Unit</strong>:Geoff NicollCompany Manager –<strong>Landcorp</strong> Estates Ltd:Neil Prichard<strong>Landcorp</strong> Sires<strong>Landcorp</strong> Sires of proven value TMBusiness Manager (Genetics):Alex Clarksires@landcorp.co.nz0508 LANDCORP(0508 526 326)LandSysLandSys Manager:Chris NeillTel: (04) 381 4050Websitewww.landcorp.co.nzWellington OfficeFarmsDairy unitsCOMMUNICATOR AWARDJacqueline Rowarth, Professorof Pastoral Agriculture at MasseyUniversity, is the <strong>Landcorp</strong>Agricultural Communicator ofthe Year for 2010. The award,administered by the Guild ofAgricultural Journalists andCommunicators, recognisesexcellence in communicatingagricultural issues, eventsor information. The judgesapplauded Prof. Rowarth’s dedication to promoting publicawareness of science and the importance of research toschools, interest groups and society in general. They said shehas always been a prolific speaker about the importance ofagriculture to the New Zealand economy and particularlyabout the need to attract quality young people into educationfor all different facets of the agricultural sector.100
QUICK FACTS 2009/10Livestock numbersAT 30 JUNE 2010Total animals 844,502Sheep 600,256Beef cattle 86,725Dairy cattle* 52,202Deer 105,319* includes sharemilker cowsProduction in 2009/10TONNESMilksolids 11,504Venison 2,060Sheep meat 9,639Beef 10,268Shorn wool 2,723Velvet 12Hectares owned and leasedAS AT 30 JUNE 2010OwnedLeasedNorth Island 86,099 25,746South Island 81,096 181,957Total 167,195 207,703<strong>Landcorp</strong> operatesFarms over 3,000 ha 19Farms with over 10,000 ewes 12Dairy farms with over 1,000 cows 21Farms carrying over 20,000 stock units 16Permanent staffPeople 584Red deer on Mararoa Station, Southland.101