Rudiments of Numeracy by A.S.C.Ehrenberg - School of Mathematics
Rudiments of Numeracy by A.S.C.Ehrenberg - School of Mathematics
Rudiments of Numeracy by A.S.C.Ehrenberg - School of Mathematics
- No tags were found...

You also want an ePaper? Increase the reach of your titles
YUMPU automatically turns print PDFs into web optimized ePapers that Google loves.
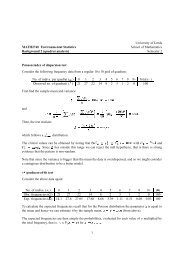
19771 EHRENBERG - <strong>Rudiments</strong> <strong>of</strong> <strong>Numeracy</strong> 285first two numbers had been 640 and 580 instead <strong>of</strong> 600 and 580, the arrangement wouldmatter more:580 640640 compared to 580With less rounded numbers the effect is even stronger. For example, subtracting 583 from637 is easier in the form637 583583 than 637Facilitating such mental arithmetic is important when one is scanning large sets <strong>of</strong> data.Rule 5: Spacing and LayoutTable 12 illustrates a form <strong>of</strong> table layout widely used in typed reports and prestigiousprinted documents. The rows are given in double or triple spacing and the columns arespread right across the page.TABLE 12Widely Spaced FiguresUnemployedTotal Male Female1973 600 500 99'70 580 500 87'68 550 460 89'66 330 260 71Such tables look nice but are counter-productive. The data are not easy to read becausethe eye has to travel too far. The rule is that figures which are meant to be compared shouldbe placed close together. Single spacing is particularly effective in making the eye read downcolumns. But there are also need to be deliberate gaps to guide the eye across the table (e.g.between groups <strong>of</strong> 5 or so rows) as was illustrated in Tables 2 and 5.Rule 6: Graphs versus TablesGraphs are widely thought to be easier on the reader than tables <strong>of</strong> numbers, but this isonly partially true. Graphs are <strong>of</strong> little use in communicating the quantitative aspects <strong>of</strong> thedata, but they can highlight qualitative results (like that something has gone up, is a curverather than a straight line, or is small rather than large). For example, the bar-chart <strong>of</strong> theunemployment data in Fig. 1 shows dramatically that(i) Unemployment increased most from 1966 to 1968,(ii) Female unemployed were far less than male,but these are qualitative features <strong>of</strong> the data which can also be conveyed quite well verbally,as in (i) and (ii). But a graph can make the points more "graphic", and hence graphs can bevery useful at the beginning or end <strong>of</strong> an analysis.