Rudiments of Numeracy by A.S.C.Ehrenberg - School of Mathematics
Rudiments of Numeracy by A.S.C.Ehrenberg - School of Mathematics
Rudiments of Numeracy by A.S.C.Ehrenberg - School of Mathematics
- No tags were found...
Create successful ePaper yourself
Turn your PDF publications into a flip-book with our unique Google optimized e-Paper software.
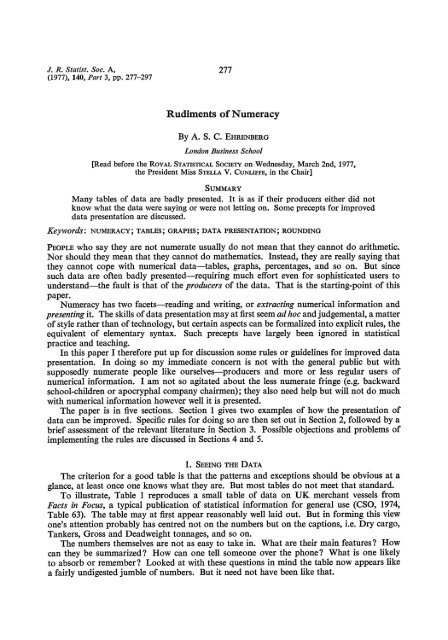
J. R. Statist. Soc. A, 277(1977), 140, Part 3, pp. 277-297<strong>Rudiments</strong> <strong>of</strong> <strong>Numeracy</strong>By A. S. C. EHRENBERGLondon Business <strong>School</strong>(Read before the ROYAL STATISTICAL SOCIETY on Wednesday, March 2nd, 1977,the President Miss STELLA V. CUNLIFFE, in the Chair]SUMMARYMany tables <strong>of</strong> data are badly presented. It is as if their producers either did notknow what the data were saying or were not letting on. Some precepts for improveddata presentation are discussed.Keywords: NMERACY; TABLES; GRAPHS; DATA PRESENTATION; ROUNDINGPEOPLE who say they are not numerate usually do not mean that they cannot do arithmetic.Nor should they mean that they cannot do mathematics. Instead, they are really saying thatthey cannot cope with numerical data-tables, graphs, percentages, and so on. But sincesuch data are <strong>of</strong>ten badly presented-requiring much effort even for sophisticated users tounderstand-the fault is that <strong>of</strong> the producers <strong>of</strong> the data. That is the starting-point <strong>of</strong> thispaper.<strong>Numeracy</strong> has two facets-reading and writing, or extracting numerical information andpresenting it. The skills <strong>of</strong> data presentation may at first seem ad hoc and judgemental, a matter<strong>of</strong> style rather than <strong>of</strong> technology, but certain aspects can be formalized into explicit rules, theequivalent <strong>of</strong> elementary syntax. Such precepts have largely been ignored in statisticalpractice and teaching.In this paper I therefore put up for discussion some rules or guidelines for improved datapresentation. In doing so my immediate concern is not with the general public but withsupposedly numerate people like ourselves-producers and more or less regular users <strong>of</strong>numerical information. I am not so agitated about the less numerate fringe (e.g. backwardschool-children or apocryphal company chairmen); they also need help but will not do muchwith numerical information however well it is presented.The paper is in five sections. Section 1 gives two examples <strong>of</strong> how the presentation <strong>of</strong>data can be improved. Specific rules for doing so are then set out in Section 2, followed <strong>by</strong> abrief assessment <strong>of</strong> the relevant literature in Section 3. Possible objections and problems <strong>of</strong>implementing the rules are discussed in Sections 4 and 5.1. SEEING THE DATAThe criterion for a good table is that the patterns and exceptions should be obvious at aglance, at least once one knows what they are. But most tables do not meet that standard.To illustrate, Table 1 reproduces a small table <strong>of</strong> data on UK merchant vessels fromFacts in Focus, a typical publication <strong>of</strong> statistical information for general use (CSO, 1974,Table 63). The table may at first appear reasonably well laid out. But in forming this viewone's attention probably has centred not on the numbers but on the captions, i.e. Dry cargo,Tankers, Gross and Deadweight tonnages, and so on.The numbers themselves are not as easy to take in. What are their main features? Howcan they be summarized? How can one tell someone over the phone? What is one likelyto absorb or remember? Looked at with these questions in mind the table now appears likea fairly undigested jumble <strong>of</strong> numbers. But it need not have been like that.


