Community-Based Surveillance of Antimicrobial Use and ...
Community-Based Surveillance of Antimicrobial Use and ...
Community-Based Surveillance of Antimicrobial Use and ...
- No tags were found...

You also want an ePaper? Increase the reach of your titles
YUMPU automatically turns print PDFs into web optimized ePapers that Google loves.
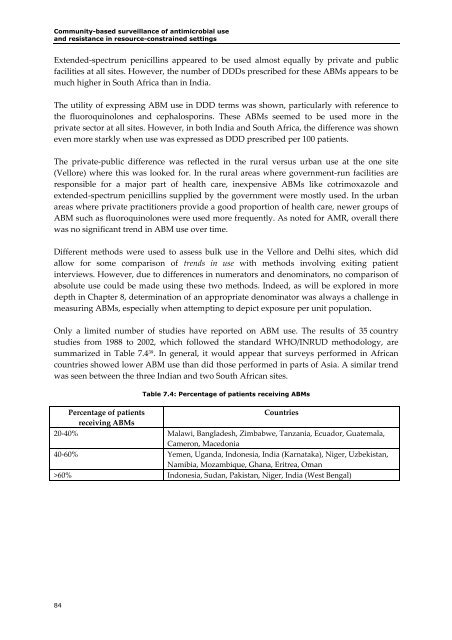
<strong>Community</strong>-based surveillance <strong>of</strong> antimicrobial use<strong>and</strong> resistance in resource-constrained settingsExtended‐spectrum penicillins appeared to be used almost equally by private <strong>and</strong> publicfacilities at all sites. However, the number <strong>of</strong> DDDs prescribed for these ABMs appears to bemuch higher in South Africa than in India.The utility <strong>of</strong> expressing ABM use in DDD terms was shown, particularly with reference tothe fluoroquinolones <strong>and</strong> cephalosporins. These ABMs seemed to be used more in theprivate sector at all sites. However, in both India <strong>and</strong> South Africa, the difference was showneven more starkly when use was expressed as DDD prescribed per 100 patients.The private‐public difference was reflected in the rural versus urban use at the one site(Vellore) where this was looked for. In the rural areas where government‐run facilities areresponsible for a major part <strong>of</strong> health care, inexpensive ABMs like cotrimoxazole <strong>and</strong>extended‐spectrum penicillins supplied by the government were mostly used. In the urbanareas where private practitioners provide a good proportion <strong>of</strong> health care, newer groups <strong>of</strong>ABM such as fluoroquinolones were used more frequently. As noted for AMR, overall therewas no significant trend in ABM use over time.Different methods were used to assess bulk use in the Vellore <strong>and</strong> Delhi sites, which didallow for some comparison <strong>of</strong> trends in use with methods involving exiting patientinterviews. However, due to differences in numerators <strong>and</strong> denominators, no comparison <strong>of</strong>absolute use could be made using these two methods. Indeed, as will be explored in moredepth in Chapter 8, determination <strong>of</strong> an appropriate denominator was always a challenge inmeasuring ABMs, especially when attempting to depict exposure per unit population.Only a limited number <strong>of</strong> studies have reported on ABM use. The results <strong>of</strong> 35 countrystudies from 1988 to 2002, which followed the st<strong>and</strong>ard WHO/INRUD methodology, aresummarized in Table 7.4 39 . In general, it would appear that surveys performed in Africancountries showed lower ABM use than did those performed in parts <strong>of</strong> Asia. A similar trendwas seen between the three Indian <strong>and</strong> two South African sites.Table 7.4: Percentage <strong>of</strong> patients receiving ABMsPercentage <strong>of</strong> patientsCountriesreceiving ABMs20‐40% Malawi, Bangladesh, Zimbabwe, Tanzania, Ecuador, Guatemala,Cameron, Macedonia40‐60% Yemen, Ug<strong>and</strong>a, Indonesia, India (Karnataka), Niger, Uzbekistan,Namibia, Mozambique, Ghana, Eritrea, Oman>60% Indonesia, Sudan, Pakistan, Niger, India (West Bengal)84