CGN User Manual - Common Lisp.net
CGN User Manual - Common Lisp.net
CGN User Manual - Common Lisp.net
- No tags were found...

You also want an ePaper? Increase the reach of your titles
YUMPU automatically turns print PDFs into web optimized ePapers that Google loves.
2.2.1 Limitations of <strong>CGN</strong> on WindowsThe Windows version of gnuplot doesn’t use the -persist parameter at all.Due to that, the with-gnuplot macro works a little diferent that in Linux 4 .You can use the with-gnuplot macro, but when It will show all the plots, Itwill wait for you to write something and push intro to return. This is theonly change.2.3 Where does <strong>CGN</strong> work?<strong>CGN</strong> is very portable due to Its use of ltk.There are some test that document and show some of the features of <strong>CGN</strong>.You can run them writing (cgn::plot-test) , (cgn::splot-test) , (cgn::plot2dtest)and (cgn::multiple-connection-test). A combination of some <strong>Lisp</strong> implementationand operative system is considered to work when It can runwithout trouble all these tests. At the moment, this includes:1. CMUCL 19e on Suse Linux 10 Enterprise Edition for x86.2. SBCL 1.0.14 on Suse Linux 10 Enterprise Edition for x86.3. <strong>Lisp</strong>Works 4.4 Personal Edition on Suse Linux 10 Enterprise Editionfor x86.4. CLISP 2.44 on Syse Linux 10 Enterprise Edition for x86.5. SBCL 1.0.14 on OpenSuse 10.1 for x86 64.6. CLISP 2.44 on OpenSuse 10.1 for x86 64.7. Closure <strong>Common</strong> <strong>Lisp</strong> (aka OpenMCL) on OpenSuse 10.1 for x86 64.8. Mac OS X.9. CLISP 2.44 on Windows XP (32 bits) 5 .10. <strong>Lisp</strong>Works 4.4 Personal Edition on Windows XP (32 bits).Older versions of <strong>CGN</strong> where tested on other combinations and wereknown to work, but nowadays we don’t have such operative systems to testIt. This includes OpenBSD (sbcl) and FreeBSD (clisp). Please, send us theoperative system/ <strong>Lisp</strong> implementation that you use.4 <strong>CGN</strong> will try to guess which operative system is running using the which-os function.5 On Windows, with-gnuplot works a little diferent due to gnuplot don’t understanding-persist.6
4.2 The splot macroThis macro is very similar to plot.gnuplot instead of plot.Simply uses the splot command from5 The <strong>CGN</strong> API<strong>CGN</strong> implements an API similar to that from Maxima. Usually, if you havea Maxima command to plot something, simply change [] by () and delete allthe commas and you’ll get something that works with <strong>CGN</strong>.They all understand the following options• connection This is an option that does not exist in Maxima. Use (’connection name ) and <strong>CGN</strong> will know which active gnuplot connectionto use for that plot.• y• legend• xlabel This is the label to put at the x axis. ( ’xlabel ”my-x-label” )• ylabel This is the label to put at the y axis. ( ’ylabel ”my-y-label” )• logx• logy• box• gnuplot term options• gnuplot out file options• gnuplot pm3d options• gnuplot ps term command• gnuplot default term command5.1 plot2dplot2d is the <strong>CGN</strong> function for the Maxima plot2d. This can plot scatterplots and lisp functions ( and lambda expressions too) . Try (cgn::plot2dtest)to see an example.8
5.2 plot3dplot3d is the <strong>CGN</strong> function for the Maxima plot3d.functions. Try (cgn::plot3d-test) to see an example.This can only plot6 Using multiple connectionsSince <strong>CGN</strong> 009, you can use more than one gnuplot connection at time. Todo that, you must understand something about how <strong>CGN</strong> works.<strong>CGN</strong> uses a special variable named *gnuplot* to mantain a hash tablewhere It looks for open connections to gnuplot. Each connection is namedby a symbol. When you call to start-gnuplot (or with-gnuplot does this foryou), <strong>CGN</strong> creates a connection named ’default-gnuplot-connection. Whenyou use some method from <strong>CGN</strong>, it looks for the name of the connectionto use by looking at the variable *default-connection-name* 6 . Then, if youwant to use more than one connection, just:1. Create a new connection.2. Bind *default-connection-name* to the name of the connection youwant to use.3. Just call the functions as you do usually. Everything will be sent tothat connection.You can create a new connection calling add-new-gnuplot-connection name.You can also close manually a connection calling delete-gnuplot-connectionname.6.1 The with-gnuplot-connection macroThe procedure of binding 7 *default-connection-name* and plotting somethingis very usual. <strong>CGN</strong> provides a macro to do that. This is the withgnuplot-connectionmacro. To do something with a connection, just use:(with-gnuplot-connection name;Put your code here)6 Some methods understand the name of the connection as a parameter, too. Lookabove for the list of parameters that plot2d and plot3d understand.7 Please, you should never destructively set this variable. This would cause strangethings to happen.9
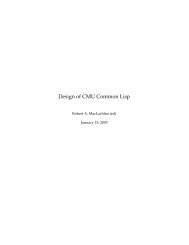
Figure 1: This is the new easy-plotter utility.Remember to open the connection manually before calling with-gnuplotconnection.7 The easy-plotter utility<strong>CGN</strong> has a little gui for the plot macro. If you write (cgn::easy-plotter),you’ll get a ltk window where you can write the function to plot and theparameters you want to use. If you want to plot a file, you must write It’sname between quotes (”). See 1.8 Plotting functions<strong>CGN</strong> has more than one method to plot functions. The gnuplot-like methodis to use the plot-1 and splot-1 functions. This functions translate immediatelyinto the equivalent gnuplot order. The second method is to use theplot-function method. This function tries to guess what you want to do.That way you don’t have to care about what function to use.10
plot-1 what-to-plot &key parametric surface What to plot is a string,something like ”cos(x)” or ”x * tan(x) ” . Note that the variable MUSTbe called x. If parametric is t, you must give something like ”cos(t),sin(t)”. Note that in this other case, the variable must be called t. Ifsurface is t, you get a surface plot.splot-1 what-to-plot &key parametric surface What to plot is a string,something like ”cos(x*y)” or ”x - y ” . Note that the variables MUSTbe called x and y. If parametric is t, you must give something like”cos(u), sin(u), v”. Note that in this other case, the variables must benamed u and v. If surface is t, you get a surface plotplot-function what-to-plot This function tries to guess where to call plotor splot. Its algorithm is easy to understand 8 :1. Counts the number of commas at what-to-plot.2. If the number of commas is 2, you are trying to do a 3D parametricplot (something like ”splot u, u - v , v ” ).3. If the number of commas is 1, you are trying to do a 2D parametricplot (something like ”plot cos(t), sin(t)” ).4. If the number of commas is zero, you are trying to do a nonparametric plot. Then It looks for a ”y” letter in what-to-plot. IfIt finds It, tries to do an f(x,y) plot (like ”splot x*y” ). It calls(plot what-to-plot) in any other case.plot-function works very well, but you always can use plot and splot ifthe algorithm doesn’t understand what you want. Other functions inthe library, like animate-function use plot-function to do Its work.Note that you always must give an adequate name to your variables: tfor a 2D parametric plot, u and v for a 3D parametric plot, etc... Seefigures 2, 3, 4 and 5 for examples. Also note that plot-function neverdoes a surface plotting by itself. If you want to do that, enable surfaceplotting by (enable-surface) , plot something with plot-function anddisable surfaces with (disable-surface).replot-function what-to-plot This is the same as plot-function, but usingreplot. Use this to add a second plot to the same screen.See figure 68 This is the new algorithm from <strong>CGN</strong>009. The old algorithm from <strong>CGN</strong>008 was worse.Please upgrade to <strong>CGN</strong>009 if you have some problem with plot-function11
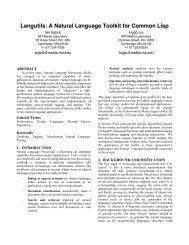
Figure 2: This can be the ouput from (plot-1 ”cos(x)” ) or (plot-function”cos(x)” )12
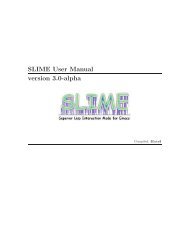
Figure 3: This is a circle. Can be the output from (plot-1 ”cos(t), sin(t)”:parametric t ) or (plot-function ”cos(t), sin(t)” )13
Figure 4: The output from (splot-1 ”x*y*cos(x*y)”) or (plot-function”x*y*cos(x*y)”)14
Figure 5: A beautiful cilinder. You can draw It with (splot-1 ”sin(u), cos(u), v ” :parametric t ) or (plot-function ”sin(u), cos(u) , v ” )15
Figure 6: Two function plots at the same screen. This was generated with(with-gnuplot () (plot-function ”cos(x)” ) (replot-function ”tan(x)” ) )16
Figure 7: A very simple surface plot. This was generated with (with-gnuplot() (splot-1 ”cos(x) + y*sin(x)” :surface t ) )8.1 Surfaces<strong>CGN</strong> uses the pm3d module to plot surfaces. You’ve seen above that youcan set :parametric t when you call splot or plot to plot a surface. You canalso use enable-surface and disable-surface to manage this manually.enable-surface Simply sets the pm3d module.disable-surface Unsets the pm3d module.See figure 7 for an example.9 Plotting scatter graphics<strong>CGN</strong> can create scatter graphics easily. To do that, first of all you mustcreate a scatter-graphic description for your graphic. Then you can adddata series to It. Finally, use plot-scatter-graphic to plot the scatter-graphicdescription.create-scatter-graphic-description title This creates a descriptionobject for you scatter graphic. Once this is created, you have to add data17
series to It.create-scatter-data-serie (sc scatter-graphic) x y x error y errortitle This is the method used to add data series to a description object. x,y, x error and y error are lists. Title is the title for the data serie. Note thatall the list need to have the same length. If you don’t want error in the x ory axis, just set x error or y error to a list filled with zeros, with the adequatelength.plot-scatter-graphic scatter-graphic &key fit-function This functionwill plot your scatter graphic description. fit-function is a function ( agnuplot string ) which is supposed to match you points . If you don’t provideIt, you’ll get a normal scatter plot.Example: create an scatter graphic with points from experiment1: (1,2) ,(2,3), (3,4) without errorbars and points from experiment2: (2.5,1) , (3.1,2),(4.5, 7) ,(8,9) with a 10% of error for x and y.(setq sc (create-scatter-graphic-description "Our experiments"))(create-scatter-data-serie sc ’(1 2 3) ’(2 3 4) ’(0 0 0)’(0 0 0 ) "Experiment1")(create-scatter-data-serie sc ’(2.5 3.1 4.5 8) ’(1 2 7 9)’(0.25 0.31 0.45 0.8) ’(0.1 0.2 0.7 0.9) "Experiment2")(plot-scatter-graphic sc)See figure 8 to see the output.9.1 The simple wayplot-points x y &key x error y error This is easier to use if you wanta scatter graphic with only 1 data series on It. You provide lists to thisfunction, all them with the same length. If you provide x error, you’ll geterrorbars at the x axis. If you provide y error, you’ll get errorbars at the yaxis. All the combinations of x error and y error are possible.Example:(with-gnuplot ()(plot-points(list 1 2 3 4 5)(list 2 3 4 5 6 )18
Figure 8: A scatter graphic)):y_error (list 0.1 0.05 0.12 0.07 0.1 )See figure 9.9.2 plot-points-and-functionThis has been contributed by Dan Becker. The prototype of this function is:plot-points-and-function ( x y func xstart xend data-title func-title)This function is used to plot a x-y data serie plus a function which issupposed to match. x and y are sequences ( lists or vectors) with the samelength, func is a string containing a gnuplot function, xstart and xend is therange to use in the x axis , data-title and func-title are the titles to showin the graphic for the data series and the function. Please run (cgn::plotpoints-and-function-test)to see a little example.19
Figure 9: A scatter graphic made with plot-points20
Figure 10: A more elaborated histogram, with two data series.10 Ploting histograms<strong>CGN</strong> can plot histograms. The plot-histogram function makes this easy.Note that this function has a side effect: it resets gnuplot after showing theplot. plot-histogram xtics serie xtics is a list with the titles appearing atthe xaxis, under each column. serie is the height of each column.With plot-histogram you get a very simple histogram. You can do morecomplicated histograms with plot-complex-histogram. See figure 10(with-gnuplot ()(let((hg (create-histogram-description "Histograma" (list "Anglaterra" "Espanya" ) ))(create-histogram-data-serie hg (list 1.3 2 ) "1940" )(create-histogram-data-serie hg (list 2.5 3.7 ) "1990" )(plot-complex-histogram hg )))21
11 Configuring gnuplot<strong>CGN</strong> can do some personalization of gnuplot for you. At the moment:set-grid on-offset-range eix min maxset-title text12 Printing<strong>CGN</strong> can print directly from gnuplot. To do that, It needs to know whatoperative system is running 9 . Just use:print-graphic&optional (os *os*)os must be set to ’w32 10 on windows. For non-windows machines, you canuse whatever symbol except ’w32: linux, unix, my-beautiful-machine, etc...13 Saving/loading<strong>CGN</strong> can save a gnuplot session to a file, and It can load It later. You haveto understand that <strong>CGN</strong> does not save nothing. It’s gnuplot who saves thesession. Then, when you load the saved session, you can restore gnuplot’sstatus (plotted functions, title, etc...), but not <strong>CGN</strong>’s status.To save use:save-cgnfileAnd to load:load-cgnfile9 This is only until release 007. Release 008 can determinate which os is running withoutthe help of the user.10 There’s an easy trick to conditionally set *os* to the correct symbol. Just (if (member:win32 *features*) (setq *os* ’w32) (setq *os* ’another)). This code was written for <strong>CGN</strong>008, but It’s not included in It because I don’t know If works everywhere. I’ve tried Itwith sbcl and clisp and works. Please, if you’ve tried It with another lisp for windows,send me a mail to superratoli@gmail.com and this code will be included in <strong>CGN</strong> 009.22
14 Creating animationsSince <strong>CGN</strong> 008, <strong>CGN</strong> can create animations. To do that, simply use animatefunction.animate-function what-function &key what-parameter initialvalueincrement number-of-frames fpswhat-function simply is a string, where you use some paramether. <strong>CGN</strong>will change the value of that paramether. Example: ”sin(a*x)”. <strong>CGN</strong>will change the value of a.what-paramether is the variable that <strong>CGN</strong> will change. In our example,the string ”a”.initial-value is a number, the initial value for a.increment is the number to add (this can be a negative number) to theparamether to compute the next frame.number-of-frames is the total number of images in the animation.fps (frames per second) is the number of frames per second that <strong>CGN</strong>will show.Here you have a little animation. Copy It to your REPL and see what Itdoes.(with-gnuplot ()(animate-function "cos(a * x ) + a * sin(x) ":variable "a":initial_value 0.0:increment 0.01:number_of_frames 100:fps 10 ) )15 Sending commands directly to gnuplot<strong>CGN</strong> simply sends commands to gnuplot writing to a pipe. You can do dothat too. This way, you can do everything that gnuplot can do, even if <strong>CGN</strong>doesn’t have implemented It. Simply use format-gnuplot.format-gnuplot text &rest arguments format-gnuplot works exactlylike the habitual format function in lisp, but It doesn’t have a stream paramether.This is just the pipe. Example: supose you want to plot the function23
cos(x). <strong>CGN</strong> can do that, but this is an example. In gnuplot, you wouldwrite ”plot cos(x)”. Well, you just could use (format-gnuplot ”plot cos(x)”). Play a little with this function and you’ll see how easy is to use It.16 Debugging <strong>CGN</strong>Since <strong>CGN</strong> 008, debugging is supported. You shouldn’t enable debug for anormal use. Enable It only if you are developing some kind of extension to<strong>CGN</strong>. To enable debug, just use:(enable-debug)And to disable It:(disable-debug)With debug enabled, <strong>CGN</strong> will print to *standard-output* everythingthat It sends to gnuplot.17 Inside <strong>CGN</strong>Basically, <strong>CGN</strong> is constructed over two different parts:• A pipe that can comunicate with gnuplot and a function to send messagesto It and• Lots of <strong>Lisp</strong> functions wrapping the most common operations you cando with gnuplot.<strong>CGN</strong> uses Ltk for the pipe issue. Ltk is a graphical toolkit for <strong>Lisp</strong> thatuses a pipe to communicate with Tk 11 . It runs everywhere a <strong>Lisp</strong> implementationexists and is well supported and mantained. It provides a functionthat creates a pipe and returns a stream to the executed program. But with2 goodies: It’s mantained by other people than me ( less work for me) andwraps code for lots of different <strong>Lisp</strong> implementations. Using It, <strong>CGN</strong> workseverywhere.11 Tk is the Tcl ToolKit. It’s an interpreter that, when called without arguments, waitsfor code on standard input. Ltk just creates the Tk code needed to create windows,buttons, etc...24
17.1 Extending <strong>CGN</strong>It’s easy to extend <strong>CGN</strong>. Everything you have to do is create a new functionthat sends to gnuplot the code that fills your needs, using format-gnuplot.format-gnuplot is just like format, but provides some features like debuggind.It also makes sure that gnuplot executes the command you send.The first thing you have to do is creating a package for putting your codein It:(defpackage :extending-cgn-example(:use :cl :cl-user :cgn)(:export #:set-property))(in-package :extending-cgn-example)To extend <strong>CGN</strong> It’s not necessary create classes. You just have to writefunctions that send the code that fills your needs. At this example, we facea very common problem: there are lots of flags that control the behaviourof gnuplot. <strong>CGN</strong> doesn’t have functions to set all of them. Well, now we’regonna write a function to set all the flags that don’t need paramethers.First of all, we study what the generated code will seem:set timestampset arrow...It becomes clear that this function will do the work:(defun set-property ( property )(format-gnuplot "set ~A" property ))Now we can test this function and see what It happens:* (start-gnuplot)* (enable-debug)T* (plot-function "cos(x)")plot cos(x)* (set-property "timestamp")set timestamp* (plot-function "sin(x)")plot sin(x)25
Figure 11: Before calling set-property18 Seeing release infoJust type(show-release-info)And you’ll see something like this:<strong>CGN</strong> 008 released 9-II-0719 Changelog<strong>CGN</strong> 009Now <strong>CGN</strong> never uses tmp files. This prevents some extrange bugsfrom <strong>CGN</strong>008.9-II-07: <strong>CGN</strong> 008Added plot-scatterAdded create-scatter-data-serie26
Figure 12: After calling set-property. Watch the timestamp.Added create-scatter-graphic-descriptionAdded new structures : data-serie and scatter-graphic, to saveinformation about scatter graphics.Added show-release-info.Added two new flags: *release* and *release-date*.format-gnuplot now does debug if debugging is enabled.Added enable-debug and disable-debug.Added *debug*, a flag to control if <strong>CGN</strong> must do debug.All the library has been updated to use the new format-gnuplotfacilities.Format-gnuplot now understands all the options that format canunderstand.Replot-function now can replot every type of functions.Created a new manual for <strong>CGN</strong>.Animate-function now can create animations for whatever type offunction, only for one paramether.27
Added animate-function, to create animations. At the moment,only for f(x), and one paramether.plot-function now plots using the parametric form.20-VI-06: <strong>CGN</strong> 007Added print-graphic, to print directly from <strong>CGN</strong>.Modified plot-function. Now can be used to plot g(x,y), not onlyf(x).Added save-cgn, to save.Added load-cgn, to load.Added with-gnuplot, a macro which should be the prefered wayto use <strong>CGN</strong>.Added the *os* special variable, to use with with-gnuplot to let<strong>CGN</strong> know which os is running. This is used to print, at themoment.Updated cldoc documentation.8-VI-06: <strong>CGN</strong> 006Corrected bug. Gnuplot keeped running later of using close-gnuplot.Comments now translated to English. It seems that the originalCatalonian documentation produced slow compilations at nonCatalonian machines.Added cldoc documentation.20 BibliographyThe oficial pdf manual of Gnuplot 4.2.2.The gnuplot demos at the demo/ subdirectory of Its source tree.I used the histogram.py program by Mustafa Paksoy to learn aboutxtics and histograms.The oficial documentation of Maxima.In the beginning, cgn was inspired by the gnuplot.py package. Google”gnuplot.py” to find It.Lots of tutorials and examples from the www.28