Energy Assurance Study: Interim Report - Southwest Florida ...
Energy Assurance Study: Interim Report - Southwest Florida ...
Energy Assurance Study: Interim Report - Southwest Florida ...
- No tags were found...

Create successful ePaper yourself
Turn your PDF publications into a flip-book with our unique Google optimized e-Paper software.
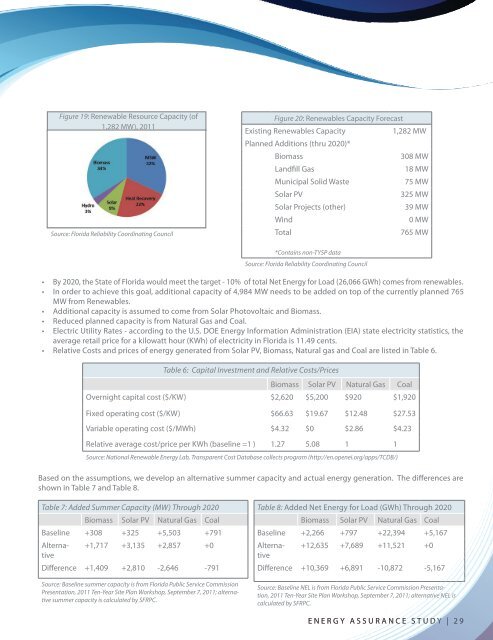
Figure 19: Renewable Resource Capacity (of1,282 MW), 2011Source: <strong>Florida</strong> Reliability Coordinating CouncilFigure 20: Renewables Capacity ForecastExisting Renewables Capacity1,282 MWPlanned Additions (thru 2020)*Biomass308 MWLandfill Gas18 MWMunicipal Solid Waste75 MWSolar PV325 MWSolar Projects (other)39 MWWind0 MWTotal765 MW*Contains non-TYSP dataSource: <strong>Florida</strong> Reliability Coordinating Council• By 2020, the State of <strong>Florida</strong> would meet the target - 10% of total Net <strong>Energy</strong> for Load (26,066 GWh) comes from renewables.• In order to achieve this goal, additional capacity of 4,984 MW needs to be added on top of the currently planned 765MW from Renewables.• Additional capacity is assumed to come from Solar Photovoltaic and Biomass.• Reduced planned capacity is from Natural Gas and Coal.• Electric Utility Rates - according to the U.S. DOE <strong>Energy</strong> Information Administration (EIA) state electricity statistics, theaverage retail price for a kilowatt hour (KWh) of electricity in <strong>Florida</strong> is 11.49 cents.• Relative Costs and prices of energy generated from Solar PV, Biomass, Natural gas and Coal are listed in Table 6.Table 6: Capital Investment and Relative Costs/PricesBiomass Solar PV Natural Gas CoalOvernight capital cost ($/KW) $2,620 $5,200 $920 $1,920Fixed operating cost ($/KW) $66.63 $19.67 $12.48 $27.53Variable operating cost ($/MWh) $4.32 $0 $2.86 $4.23Relative average cost/price per KWh (baseline =1 ) 1.27 5.08 1 1Source: National Renewable <strong>Energy</strong> Lab, Transparent Cost Database collects program (http://en.openei.org/apps/TCDB/)Based on the assumptions, we develop an alternative summer capacity and actual energy generation. The differences areshown in Table 7 and Table 8.Table 7: Added Summer Capacity (MW) Through 2020Biomass Solar PV Natural Gas CoalBaseline +308 +325 +5,503 +791Alternative+1,717 +3,135 +2,857 +0Difference +1,409 +2,810 -2,646 -791Source: Baseline summer capacity is from <strong>Florida</strong> Public Service CommissionPresentation, 2011 Ten-Year Site Plan Workshop, September 7, 2011; alternativesummer capacity is calculated by SFRPC.Table 8: Added Net <strong>Energy</strong> for Load (GWh) Through 2020Biomass Solar PV Natural Gas CoalBaseline +2,266 +797 +22,394 +5,167Alternative+12,635 +7,689 +11,521 +0Difference +10,369 +6,891 -10,872 -5,167Source: Baseline NEL is from <strong>Florida</strong> Public Service Commission Presentation,2011 Ten-Year Site Plan Workshop, September 7, 2011; alternative NEL iscalculated by SFRPC.ENERGY ASSURANCE STUDY | 29