Parental socialisation effort and the intergenerational transmission ...
Parental socialisation effort and the intergenerational transmission ...
Parental socialisation effort and the intergenerational transmission ...
- No tags were found...

You also want an ePaper? Increase the reach of your titles
YUMPU automatically turns print PDFs into web optimized ePapers that Google loves.
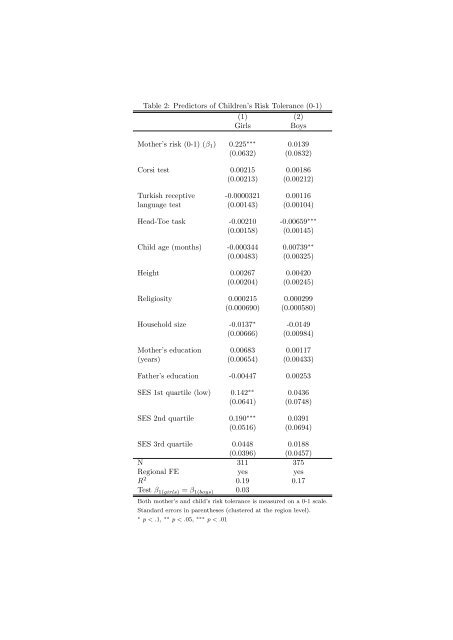
Table 2: Predictors of Children’s Risk Tolerance (0-1)(1) (2)GirlsBoysMo<strong>the</strong>r’s risk (0-1) (β 1 ) 0.225 ∗∗∗ 0.0139(0.0632) (0.0832)Corsi test 0.00215 0.00186(0.00213) (0.00212)Turkish receptive -0.0000321 0.00116language test (0.00143) (0.00104)Head-Toe task -0.00210 -0.00659 ∗∗∗(0.00158) (0.00145)Child age (months) -0.000344 0.00739 ∗∗(0.00483) (0.00325)Height 0.00267 0.00420(0.00204) (0.00245)Religiosity 0.000215 0.000299(0.000690) (0.000580)Household size -0.0137 ∗ -0.0149(0.00666) (0.00984)Mo<strong>the</strong>r’s education 0.00683 0.00117(years) (0.00654) (0.00433)Fa<strong>the</strong>r’s education -0.00447 0.00253SES 1st quartile (low) 0.142 ∗∗ 0.0436(0.0641) (0.0748)SES 2nd quartile 0.190 ∗∗∗ 0.0391(0.0516) (0.0694)SES 3rd quartile 0.0448 0.0188(0.0396) (0.0457)N 311 375Regional FE yes yesR 2 0.19 0.17Test β 1(girls) = β 1(boys) 0.03Both mo<strong>the</strong>r’s <strong>and</strong> child’s risk tolerance is measured on a 0-1 scale.St<strong>and</strong>ard errors in paren<strong>the</strong>ses (clustered at <strong>the</strong> region level).∗ p < .1, ∗∗ p < .05, ∗∗∗ p < .01