Annual Reports - Indraprastha Gas Limited
Annual Reports - Indraprastha Gas Limited
Annual Reports - Indraprastha Gas Limited

You also want an ePaper? Increase the reach of your titles
YUMPU automatically turns print PDFs into web optimized ePapers that Google loves.
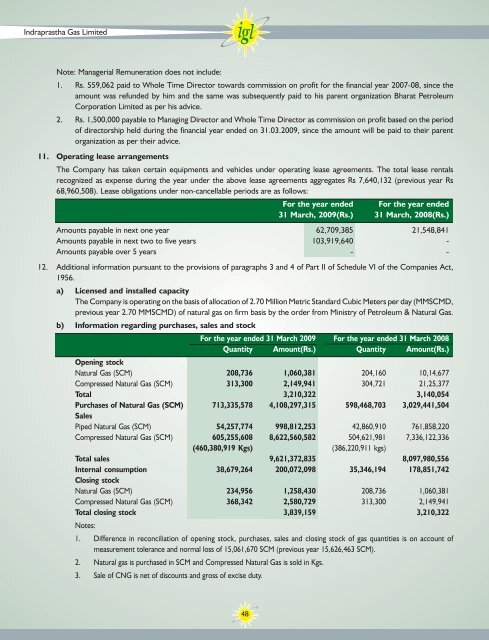
Note: Managerial Remuneration does not include:<br />
1. Rs. 559,062 paid to Whole Time Director towards commission on profit for the financial year 2007-08, since the<br />
amount was refunded by him and the same was subsequently paid to his parent organization Bharat Petroleum<br />
Corporation <strong>Limited</strong> as per his advice.<br />
2. Rs. 1,500,000 payable to Managing Director and Whole Time Director as commission on profit based on the period<br />
of directorship held during the financial year ended on 31.03.2009, since the amount will be paid to their parent<br />
organization as per their advice.<br />
11. Operating lease arrangements<br />
The Company has taken certain equipments and vehicles under operating lease agreements. The total lease rentals<br />
recognized as expense during the year under the above lease agreements aggregates Rs 7,640,132 (previous year Rs<br />
68,960,508). Lease obligations under non-cancellable periods are as follows:<br />
For the year ended For the year ended<br />
31 March, 2009(Rs.) 31 March, 2008(Rs.)<br />
Amounts payable in next one year 62,709,385 21,548,841<br />
Amounts payable in next two to five years 103,919,640 -<br />
Amounts payable over 5 years - -<br />
12. Additional information pursuant to the provisions of paragraphs 3 and 4 of Part II of Schedule VI of the Companies Act,<br />
1956.<br />
a) Licensed and installed capacity<br />
The Company is operating on the basis of allocation of 2.70 Million Metric Standard Cubic Meters per day (MMSCMD,<br />
previous year 2.70 MMSCMD) of natural gas on firm basis by the order from Ministry of Petroleum & Natural <strong>Gas</strong>.<br />
b) Information regarding purchases, sales and stock<br />
For the year ended 31 March 2009 For the year ended 31 March 2008<br />
Quantity Amount(Rs.) Quantity Amount(Rs.)<br />
Opening stock<br />
Natural <strong>Gas</strong> (SCM) 208,736 1,060,381 204,160 10,14,677<br />
Compressed Natural <strong>Gas</strong> (SCM) 313,300 2,149,941 304,721 21,25,377<br />
Total 3,210,322 3,140,054<br />
Purchases of Natural <strong>Gas</strong> (SCM)<br />
Sales<br />
713,335,578 4,108,297,315 598,468,703 3,029,441,504<br />
Piped Natural <strong>Gas</strong> (SCM) 54,257,774 998,812,253 42,860,910 761,858,220<br />
Compressed Natural <strong>Gas</strong> (SCM) 605,255,608 8,622,560,582 504,621,981 7,336,122,336<br />
(460,380,919 Kgs) (386,220,911 kgs)<br />
Total sales 9,621,372,835 8,097,980,556<br />
Internal consumption<br />
Closing stock<br />
38,679,264 200,072,098 35,346,194 178,851,742<br />
Natural <strong>Gas</strong> (SCM) 234,956 1,258,430 208,736 1,060,381<br />
Compressed Natural <strong>Gas</strong> (SCM) 368,342 2,580,729 313,300 2,149,941<br />
Total closing stock<br />
Notes:<br />
3,839,159 3,210,322<br />
1. Difference in reconciliation of opening stock, purchases, sales and closing stock of gas quantities is on account of<br />
measurement tolerance and normal loss of 15,061,670 SCM (previous year 15,626,463 SCM).<br />
2. Natural gas is purchased in SCM and Compressed Natural <strong>Gas</strong> is sold in Kgs.<br />
3. Sale of CNG is net of discounts and gross of excise duty.<br />
48