Austria Case Study - the IEA Bioenergy Task 38 Website
Austria Case Study - the IEA Bioenergy Task 38 Website
Austria Case Study - the IEA Bioenergy Task 38 Website
- No tags were found...
Create successful ePaper yourself
Turn your PDF publications into a flip-book with our unique Google optimized e-Paper software.
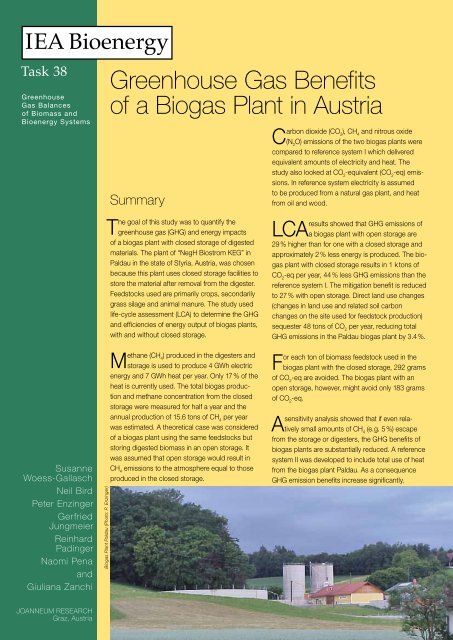
Courtesy ofJOANNEUM RESEARCHCalculation of GHG emissionsThe GHG calculations are based on an LCA following <strong>the</strong> internationalstandards ISO 14 040 and 14 044 and <strong>the</strong> standard methodology forGHG balances of bioenergy systems, as developed in <strong>IEA</strong> <strong>Bioenergy</strong><strong>Task</strong> <strong>38</strong>. The software tool GEMIS (Gesamt-Emissions-Modell IntegrierterSysteme) developed by <strong>the</strong> Öko-Institut in Darmstadt / Germany was usedfor <strong>the</strong> calculations.In <strong>the</strong> LCA, emissions of <strong>the</strong> GHGs carbon dioxide (CO 2), methane(CH 4), and nitrous oxide (N 2O) were calculated. Emissions of CH 4and N 2Owere expressed as CO 2-equivalent (CO 2‐eq), using 100 year global warmingpotentials (Forster P. et al, 2007).The LCA assumes a 20-year life time for <strong>the</strong> Paldau plant. CO 2removed from <strong>the</strong> atmosphere through photosyn<strong>the</strong>sis is assumed to balanceCO 2released during combustion of biomass, <strong>the</strong>refore no emissionsare counted at <strong>the</strong> point of combustion, in accordance with <strong>the</strong> Guidelinesof <strong>the</strong> IPCC (IPCC 2006).In addition to CO 2emissions due to cultivation and harvesting ofcrops, transportation, and construction and dismantling of plants, calculationsincluded carbon stored due to direct land-use change (dLUC) 1 . Inboth bio gas systems analyzed, dLUC occurs because set-aside land isconverted to cultivate maize. Only changes in soil carbon were considered.For <strong>the</strong>se calculations <strong>the</strong> Styrian Soil Carbon Data base was used(Amt der Stmk. Landes regierung, 2004). In <strong>Austria</strong> set-aside land is oftengrass land so a grass land site was chosen to represent set-aside land.The conversion from grass land to crop land results in an increase in soilcarbon because of low humus percentage in <strong>the</strong> grass land.Emissions due to dLUC due to conversion of grassland to crop productionwere averaged over 20 years, which corresponds to <strong>the</strong> life-timeof biogas plants such as Paldau. It was assumed that no dLUC occurswere wood is used for heat in reference system I, because it is assumed<strong>the</strong> wood is harvested from a sustainably managed forest. In <strong>the</strong> biogassystems, no CO 2removals were attributed to <strong>the</strong> increased growth offorest compared to <strong>the</strong> reference system I enabled by <strong>the</strong> fact that <strong>the</strong>biogas plants supply heat previously supplied by wood. The reason istwo-fold: <strong>the</strong> removals are negligible and <strong>Austria</strong> does not include carbonstock changes due to forest management in its Kyoto Protocol accounting.Description of <strong>the</strong> three basic casesThe following three basic cases were analyzed:■■The existing Paldau biogas plant with a closed storage,■■A <strong>the</strong>oretical biogas plant similar to Paldau but with open storage,■■Reference system I: An equivalent amount of electricity is produced bya natural gas power plant and heat equivalent to heat use from biogasplant.The lower biogas production in <strong>the</strong> biogas plant without closed storageresults in lower electricity production. The electricity supply in <strong>the</strong> openstorage is consequently supplemented with electricity from a natural gaspower plant. Electricity from a natural gas power plant is also used inreference system I.The quantity of heat produced in reference system I is <strong>the</strong> same as<strong>the</strong> quantity of heat currently used from <strong>the</strong> Paldau biogas plant (17 %of 7 GWh, ie 1.2 GWh). Heat is provided by four domestic oil heatingsystems and one domestic wood log heating system, <strong>the</strong> systems whichwere in use prior to <strong>the</strong> heat from <strong>the</strong> biogas plant. For <strong>the</strong> sensitivityanalysis a reference system II was developed in which <strong>the</strong> amount of heatproduced is equivalent to <strong>the</strong> total heat production of <strong>the</strong> Paldau plant.System boundaryThe process chains of <strong>the</strong> biogas plant with closed storage andof reference system I are documented in figure 1. Reference system Iutilises <strong>the</strong> same amounts of: manure, land area and grass as <strong>the</strong> Paldaubiogas plant and provides <strong>the</strong> same amounts of electricity, used heatand fodder. In <strong>the</strong> reference system I, <strong>the</strong> corn and maize silage is usedfor fodder instead of as an input to a biogas plant; undigested manureis used for fertilizer ra<strong>the</strong>r than as a biogas plant input, and grass silageis composted and used as a fertilizer instead of as biogas feedstock. Inreference system I, set-aside land is mulched once a year. Heat and electricityare sourced from conventional energy sources. All <strong>the</strong> correspondingGHG emissions are considered in <strong>the</strong> LCA.To account for <strong>the</strong> CH 4and N 2O emissions to <strong>the</strong> atmosphere from<strong>the</strong> undigested manure, <strong>the</strong>se were subtracted from <strong>the</strong> biogas plantcalculations. As undigested animal manure is 20 percent less effectiveas fertilizer than digested manure, some syn<strong>the</strong>tic fertilizer was includedin <strong>the</strong> reference system I to provide equivalent fertilizer value as obtainedfrom animal manure in <strong>the</strong> biogas system.In <strong>the</strong> biogas systems <strong>the</strong> reduction in fodder supply is coveredthrough a combination of conversion and fertilization of 53.6 ha of setasideland, increased soya imports, and higher yields through additionalfertilizer on original cultivated area (214 ha). Additional fertilizer plusadditional land supply 60 per cent of <strong>the</strong> deficit, with <strong>the</strong> o<strong>the</strong>r 40 percent addressed through soy imports (for more details, please see fullreport, pages 16 – 18: Woess-Gallasch et al, 2011). The digested grassfrom <strong>the</strong> biogas plants is also used as a fertilizer and is equivalent to <strong>the</strong>fertiliser value of <strong>the</strong> composted grass silage in <strong>the</strong> reference system I.Functional unitGHG emissions were calculated as tons per year. The values of <strong>the</strong>biogas plants were <strong>the</strong>n calculated in terms of GHG emission reductionsin comparison to reference system I, and expressed per unit of energyoutput (kWh) and per unit mass of biomass (t ). DM1 Land-use change can be ei<strong>the</strong>r direct or indirect. Land-use change is calleddirect if <strong>the</strong> change occurs on-site. This study only includes emissions fromdLUC.
Results and discussionEnergy and biogas productionThe biogas plant Paldau produces 270 Nm 3 of biogas per hour,equivalent to 2,365 Mio Nm 3 per year. The two 250 kW elgas enginesproduce 4,300 MWh annually which is fed into <strong>the</strong> public grid. Aftersubtracting <strong>the</strong> biogas plants’ electricity requirements – 272 MWh– a net production of 4,029 MWh is achieved. The plant’s grossheat production is 7,250 MWh, but heat available is only partly used(17 %).The measurements of <strong>the</strong> biogas produced in <strong>the</strong> closed storageshow a mean value of 3.9 Nm 3 per hour, or 34,160 Nm 3 per year.In <strong>the</strong> LCA calculations, <strong>the</strong> assumption was made that <strong>the</strong> storageremained closed also during material removal. The CH 4concentrationof <strong>the</strong> biogas in <strong>the</strong> storage was 63.8 % which is higher than thatproduced in <strong>the</strong> digester, which is 48.8 %. This means that 15.6 tonsof CH 4would be produced annually in <strong>the</strong> biogas plant storage underbest management practices.Greenhouse gas emissionsTable 1 shows <strong>the</strong> GHG emissions in tons per year.Table 1: GHG emissions in tons per yearGHG emissions t / yr CO 2CH 4N 2O CO 2-eqBiogas plant Paldau,closed storageBiogas plant Paldau,open storage202 9.6 3.3 1,409233 25.2 3.2 1,818Reference system I 2,224 10.9 < 0.1 2,502Note: For calculation of total CO 2-eq emissions <strong>the</strong> global warming potentialsof IPCC were used (Forster P. et al, 2007)Figure 2 shows all <strong>the</strong>se Greenhouse gas emissions. The biogasplant with closed storage has <strong>the</strong> lowest emissions, 1,409 t CO 2-eq / yr. If <strong>the</strong> emissions reductions due to dLUC are not considered,emissions from closed storage are 1,457 t CO 2-eq / yr (see Figure 3).Thus dLUC reduces total CO 2-eq emissions by 3.4 %. The biogasCourtesy ofJOANNEUM RESEARCHplant with an open storage results in 1,818 t CO 2-eq / yr. and <strong>the</strong>reference system I in 2,502 t CO 2-eq / yr.Table 2 shows <strong>the</strong> GHG emissions per kWh produced, which iscomposed of 0.76 kWh eand 0.24 kWh th.Table 2: GHG emissions in g per produced kWhGHG emissions g / kWh CO 2CH 4N 2O CO 2‐eqBiogas plant Paldau,closed storageBiogas plant Paldau,open storage<strong>38</strong> 2 1 26644 5 1 344Reference system I 421 2 < 1 473Reference system IImore heat806 2 < 1 930Note: More information on reference system II please find below under“Sensitivity Analysis”Table 3: GHG emission reductions of <strong>the</strong> biogas plant systems comparedto <strong>the</strong> reference system I in g per produced kWhGHG emission reductionsto refe ren ce system Ig / kWhBiogas plant Paldau,closed storageBiogas plant Paldau,open storageCO 2CH 4N 2O CO 2-eq<strong>38</strong>2 < 1 -1 207376 -3 -1 129Note: Each kWh is composed of 0.76 kWh eand 0.24 k Wh th–negative values mean an increase of GHG emissionsTable 4: GHG emission reductions kg per tDMof biomass feedstockcompared to reference system IGHG emission reductionsto reference system I CO 2CH 4N 2O CO 2‐eqkg / t biomass DMBiogas plant Paldau,closed storageBiogas plant Paldau,open storage540 0.4 -0.9 292531 -3.8 -0.8 183Note: Negative values mean an increase of GHG emissionsBiogas plantPaldauclosed storageBiogas plantPaldauopen storageReferencesystem I072022392332725006301 4091 818CO 2CH 4as CO 2-eqN 2O as CO 2-eqTotal CO 2-eq100015002000 2 500GHG emissions t CO 2-eq / yrFigure 2: GHG emissions in CO 2-equivalent emissions per year.Note: The CO 2emission from biogas plants includes 48 tonnes of CO 2sequestration from dLUC.9679542 2242 502Table 3 shows <strong>the</strong> GHG emission reductionsof <strong>the</strong> biogas plant systems comparedto <strong>the</strong> reference system I in g per producedkWh.In Table 4 <strong>the</strong> GHG emission reductionsin comparison to reference system I havebeen calculated per ton of dry biomassfeedstock (tDM). For each tonne of biomassfeedstock used in <strong>the</strong> biogas plant with <strong>the</strong>closed storage, 292 grams of CO 2-eq canbe avoided. The biogas plant with an openstorage, however, avoids only 183 grams ofCO 2-eq.


