Land-Use, Land-Use Change and Forestry - the IEA Bioenergy Task ...
Land-Use, Land-Use Change and Forestry - the IEA Bioenergy Task ...
Land-Use, Land-Use Change and Forestry - the IEA Bioenergy Task ...

You also want an ePaper? Increase the reach of your titles
YUMPU automatically turns print PDFs into web optimized ePapers that Google loves.
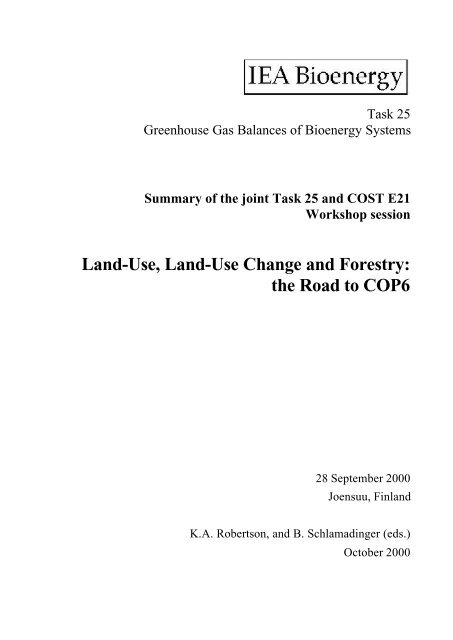
<strong>Task</strong> 25Greenhouse Gas Balances of <strong>Bioenergy</strong> SystemsSummary of <strong>the</strong> joint <strong>Task</strong> 25 <strong>and</strong> COST E21Workshop session<strong>L<strong>and</strong></strong>-<strong>Use</strong>, <strong>L<strong>and</strong></strong>-<strong>Use</strong> <strong>Change</strong> <strong>and</strong> <strong>Forestry</strong>:<strong>the</strong> Road to COP628 September 2000Joensuu, Finl<strong>and</strong>K.A. Robertson, <strong>and</strong> B. Schlamadinger (eds.)October 2000
Table of ContentsPresentationsSession 3: <strong>L<strong>and</strong></strong> <strong>Use</strong>, <strong>L<strong>and</strong></strong>-<strong>Use</strong> change <strong>and</strong> <strong>Forestry</strong> Activities under Articles 3.3 <strong>and</strong> 3.4.J.Liski, T.Karjalainen, A.Pussinen, G.J. Nabuurs <strong>and</strong> P.KauppiTrees as carbon sinks <strong>and</strong> sources in <strong>the</strong> European Union 1D.BradleyDomestic options for carbon management 5S.SubakAddressing COP6 decisions on agricultural soil carbon accumulation 9A.Cowie <strong>and</strong> K.LambMeasuring <strong>and</strong> marketing carbon sequestration in planted forests in NewSouth Wales, Australia 17
Liski et al – Trees as carbon sinks <strong>and</strong> sources in <strong>the</strong> European Union 1Trees as carbon sinks <strong>and</strong> sources in <strong>the</strong> European UnionLiski J 1) *, Karjalainen T 1) , Pussinen A 1) , Nabuurs G-J 2) & Kauppi P 3)1) European Forest Institute, Torikatu 34, FIN-80100 Joensuu, Finl<strong>and</strong>2) Institute for <strong>Forestry</strong> <strong>and</strong> Nature Research, Postbus 23, NL-6700 AA, Wageningen, The Ne<strong>the</strong>rl<strong>and</strong>s3) Department of Limnology <strong>and</strong> Environmental Protection, P.O. Box 27, FIN-00014 University of Helsinki,Finl<strong>and</strong>ABSTRACTThe carbon (C) sinks <strong>and</strong> sources of trees that may be accounted for under Article 3.3 of <strong>the</strong> Kyoto Protocolduring <strong>the</strong> first commitment period from 2008 to 2012 were estimated for <strong>the</strong> countries of <strong>the</strong> EuropeanUnion (EU) based on existing forest inventory data. Two sets of definitions for <strong>the</strong> accounted activities,afforestation, reforestation <strong>and</strong> deforestation, were applied. Applying <strong>the</strong> definitions by <strong>the</strong> Food <strong>and</strong>Agricultural Organization of <strong>the</strong> United Nations (FAO), <strong>the</strong> trees were estimated to be a C source in 8 <strong>and</strong> aC sink in 7 countries, <strong>and</strong> in <strong>the</strong> whole EU a C source of 5.4 Tg year -1 . Applying <strong>the</strong> definitions by <strong>the</strong>Intergovernmental Panel of Climate <strong>Change</strong> (IPCC), <strong>the</strong> trees were estimated to be a C source in 3 <strong>and</strong> a Csink in 12 countries, <strong>and</strong> in <strong>the</strong> whole EU a C sink of 0.1 Tg year -1 . These estimates are small compared with<strong>the</strong> C sink of trees in all EU forests, 63 Tg year -1 , <strong>the</strong> anthropogenic CO 2 emissions of <strong>the</strong> EU, 880 Tg Cyear -1 , <strong>and</strong> <strong>the</strong> reduction target of <strong>the</strong> CO 2 emissions, 8 %. In individual countries, <strong>the</strong> estimated C sink of <strong>the</strong>trees accounted for under Article 3.3 was at largest 8% <strong>and</strong> <strong>the</strong> C source 12% compared with <strong>the</strong> CO 2emissions.Key words:Kyoto Protocol, Article 3.3, carbon sink, carbon source, stock change, forest, CO 2 emission, afforestation,reforestation, deforestation.
2 <strong>IEA</strong> <strong>Bioenergy</strong> <strong>Task</strong> 25 Workshop, Joensuu, Finl<strong>and</strong>: LULUCF: The Road to COP6OutlineTrees as carbon sinks <strong>and</strong>sources in <strong>the</strong> EuropeanUnionJari Liski 1) , Timo Karjalainen 1) , Ari Pussinen 1) , Gert-JanNabuurs 2) & Pekka Kauppi 3)1)European Forest Institute, Joensuu, Finl<strong>and</strong>2)Institute for <strong>Forestry</strong> <strong>and</strong> Nature Research, Wageningen,The Ne<strong>the</strong>rl<strong>and</strong>s3)Department of Limnology <strong>and</strong> Environmental Protection,University of Helsinki, Finl<strong>and</strong>E U R O P E A N F O R E S T I N S T I T U T E1 Introduction- “Kyoto forests” (Article 3.3)2 Material <strong>and</strong> methods- definitions, calculations, data3 Results- whole EU, countries- area, carbon- ARD l<strong>and</strong>s, all forests, CO2 emissions4 Summary <strong>and</strong> Conclusions1E U R O P E A N F O R E S T I N S T I T U T E2Kyoto forestsObjectives of <strong>the</strong>present studyto estimate in EUcountries•<strong>the</strong> area of <strong>the</strong> ARDl<strong>and</strong>s•<strong>the</strong> carbon balance oftrees on <strong>the</strong> ARD l<strong>and</strong>sApplied definitions of ARDFAOIPCCIGBP Terrestrial Carbon Working Group. 1998. Science 280: 1393-1394.to relate <strong>the</strong> area <strong>and</strong> <strong>the</strong>balance to•all forests•CO 2emissionsE U R O P E A N F O R E S T I N S T I T U T E3E U R O P E A N F O R E S T I N S T I T U T E4 .
4 <strong>IEA</strong> <strong>Bioenergy</strong> <strong>Task</strong> 25 Workshop, Joensuu, Finl<strong>and</strong>: LULUCF: The Road to COP6SummaryConclusionsIn <strong>the</strong> whole EU• <strong>the</strong> area of <strong>the</strong> ARD l<strong>and</strong>s 2 to 9 % of all forest area• trees on <strong>the</strong> ARD l<strong>and</strong>s a sink, a source or nei<strong>the</strong>r• <strong>the</strong> sink or <strong>the</strong> source on <strong>the</strong> ARD l<strong>and</strong>s at largest up to a few %of <strong>the</strong> carbon sink of trees in all forests <strong>and</strong> a few ‰ of <strong>the</strong> CO 2emissions• <strong>the</strong> carbon sink of trees in all forests 7 % of <strong>the</strong> CO 2 emissionsIn individual countries• where <strong>the</strong> carbon sink of all trees is small, much of it can be on<strong>the</strong> AR l<strong>and</strong>s• where <strong>the</strong> carbon sink of all trees is large, little of it is on <strong>the</strong> ARl<strong>and</strong>sThe carbon balance of trees on <strong>the</strong> ARD l<strong>and</strong>s• <strong>the</strong> sink as large as <strong>the</strong> targeted emission reduction in a fewcountries, considerable source in a few o<strong>the</strong>rs• Article 3.3 may be relevant in <strong>the</strong>se few countries for <strong>the</strong>management of <strong>the</strong>se l<strong>and</strong>s, probably
D. Bradley – Domestic Options for carbon management 5Domestic options for carbon managementDoug Bradley, Domtar Inc, CanadaKyoto- In vs Not yet inDomestic Options for CarbonManagement<strong>Task</strong> Force 25Joensuu, Finl<strong>and</strong>Sept 28, 2000Doug BradleyDomtar11IN KYOTONOT YET IN KYOTO_________Fossil Fuel Reduction_ ____Carbon Sequestration_____________Energy Efficiency Fuel Switching Afforest., Reforest O<strong>the</strong>r <strong>Forestry</strong>, Agricultural(Biomass for fossil fuel) Deforestation ActivitiesReduce fossil fuel Reduces fossil fuel Sequesters carbon Sequesters carbon(defn. - Article 3.3) (negotiated- Article 3.4)Examples:-Fuel efficient motors -Wood waste cogen -Planting on poor agric. l<strong>and</strong> <strong>Forestry</strong>:-Waste heat capture -Black liquor -Reducing deforestation -Pest <strong>and</strong> disease control-Prod’n enhancemt integrated gasific.-Fire control-Improved Maint. <strong>and</strong> combined cycle cogen -Commercial thinning-Juvenile Spacing-Tree Improvment- Reduc. impact loggingAgricultural:-Reduced tillage-Manure management-Shelterbelts22Carbon Impacts of Emission ReductionActivities<strong>Forestry</strong>:InitialLong TermJuvenile spacing emission sequestr.Pest spray sequestr. sequestr.Tree Improvement sequestr. sequestr.Commercial thinning emission sequestr.Fertilization emission sequestr.O<strong>the</strong>r:<strong>L<strong>and</strong></strong>fill Incineration emission sequestr.500450400350300250200150100500Natural Jack Pine Forest (Baseline)Forest <strong>and</strong> Products Carbon PoolsGorcam modelBaseline2000 2020 2040 2060 2080 2100 2120 2140 2160 2180 2200Year<strong>L<strong>and</strong></strong>fillLLPSLPO<strong>the</strong>r Veg.TreesLitterRootsSoil3344 .
6 <strong>IEA</strong> <strong>Bioenergy</strong> <strong>Task</strong> 25 Workshop, Joensuu, Finl<strong>and</strong>: LULUCF: The Road to COP6Juvenile Spaced St<strong>and</strong>Forest <strong>and</strong> Products Carbon PoolsGorcam ModelProjectNet EmissionsControl vs Spaced Gorcam ModelSt<strong>and</strong>-level Net Biomass60050040030020010002000 2020 2040 2060 2080 2100 2120 2140 2160 2180 2200Year<strong>L<strong>and</strong></strong>fillLLPSLPO<strong>the</strong>r VegTreesLitterRootsSoilNet Biomass(t CO2e/ ha)5004003002001000-1002000 2020 2040 2060 2080 2100 2120 2140 2160 2180 2200-200-300-400Year<strong>L<strong>and</strong></strong>fillLLPSLPO<strong>the</strong>r Veg.TreesLitterRootsSoilTotal (with l<strong>and</strong>fill)Total (no l<strong>and</strong>fill)5566St<strong>and</strong> SequestrationAnnual CreditingGorcam ModelSt<strong>and</strong> Net Sequestration- Tonnes CO 2/haForest Level Impact of Spacing50Gorcam ModelForest-level Net BiomassConstant Production Option250200150100500-502000 2010 2020 2030 2040 2050 2060 2070 2080 2090 2100 2110 2120 2130-100-150Net Biomass Net All Pools Amortized SequestrationBiomass(t CO2e / ha controlled & protected)4030201002000 2020 2040 2060 2080 2100 2120 2140 2160 2180 2200-10<strong>L<strong>and</strong></strong>fillLLPSLPO<strong>the</strong>r VegTreesLitterRootsSoilTotal (without <strong>L<strong>and</strong></strong>fill)Total (with <strong>L<strong>and</strong></strong>fill)-2077Year88 .
D. Bradley – Domestic Options for carbon management 7Bud Worm Spray ProgramGorcam ModelEarly CreditingNet Biomass(t CO2e/ ha)St<strong>and</strong>-level Net Biomass40030020010002000 2020 2040 2060 2080 2100 2120 2140 2160 2180-100-200<strong>L<strong>and</strong></strong>fillLLPSLPO<strong>the</strong>r Veg.TreesLitterRootsSoilTotal (with l<strong>and</strong>fill)Total (no l<strong>and</strong>fill)Can governments become “carbonmanagers” using an early creditingsystem, for <strong>the</strong> long term good of <strong>the</strong>atmosphere?How would <strong>the</strong> system work?-300-400YearWhat incentive would it provide?991010Early Credit to a Juvenile Spacing Program(tonnes CO 2e)Example of Early Crediting System2000-102010-202020-301990 2000 2010 2020 2030Emissions 604 700 764 764 764ActualSequestrationCredits(5)525154040<strong>Forestry</strong> OffsetsSpacing 0 2 (25) (40)Thinning 0 3 (8) (14)Tree Improve 0 (2) (24) (44)Pest Control 0 (6) (6) (6)0 (3) (63) (104)Net(10)100Net Emissions 604 700 761 701 66011111212 .
8 <strong>IEA</strong> <strong>Bioenergy</strong> <strong>Task</strong> 25 Workshop, Joensuu, Finl<strong>and</strong>: LULUCF: The Road to COP6Carbon Management via Incentives(amortization)Risks of Early Crediting2000-05 2005-10 2010-15 2015-20 totalBase Emissions 700 720 690 640 2750With Amortization:Credits given -10 -10 -10 -30 -60Book Emissions 690 710 680 610 2690• Issuing credits if forests don’t count in Kyoto II• Issuing credits where benefits are over-estimated• Issuing credits where benefits never happen• Excess credit liabilityActual reductions 0 -10 -20 -30 -60Actual Emissions 700 710 670 610 269013131414Benefits to Early CreditingCountries Net Enissions• Implement many more projects thanwould o<strong>the</strong>rwise happen• Wider range of options to reach Kyototargets• Allows least cost solutions• Doesn’t cost government money, justpaper credits• Government becomes manager of carbon8007507006506005505001990 2000 2010 2020 2030With Early CreditingEmissionsNet EmissionsTarget15151616
S.Subak – Addressing COP6 Decisions on Agricultural Soil Carbon 9Addressing COP6 Decisions on Agricultural Soil CarbonAccumulationSusan SubakAmerican Association for <strong>the</strong> Advancement of Science FellowOffice of Atmospheric Programs, U.S. Environmental Protection AgencyABSTRACTThe Kyoto Protocol introduces <strong>the</strong> possibility that changes in carbon stock on agricultural <strong>and</strong> forest l<strong>and</strong><strong>and</strong> soils may be counted against countries’ commitments to reduce <strong>the</strong>ir greenhouse gas emissions.Including activities related to l<strong>and</strong> use change <strong>and</strong> forestry in <strong>the</strong> international climate change agreementmay stimulate new incentives for soil-conservation practices domestically. However, a primary criteria for<strong>the</strong>ir inclusion relates to <strong>the</strong> level of accuracy <strong>and</strong> transparency with which carbon stock changes can beassessed. Parties will also be concerned with <strong>the</strong> wider environmental impact of different sequestrationpractices, <strong>and</strong> <strong>the</strong> impact of offsets on overall emissions targets. This paper examines <strong>the</strong>se issues foragricultural soils, considering recent research in temperate regions. It is argued that incentives for carbonsequestration practices may need to be implemented independently of actual stock changes because farmlevelsoil monitoring would be very costly. Priority should be given to establishing incentives for covercrops <strong>and</strong> to exp<strong>and</strong>ing conservation tillage programs. These activities provide a range of ancillaryenvironmental benefits. In contrast, improvements in biomass yield tend to rely on higher fertilizer inputswith <strong>the</strong>ir related environmental costs. Carbon accumulated through any of <strong>the</strong>se activities is easily lost if <strong>the</strong>practices are discontinued, <strong>and</strong> so assessment procedures are needed that would avoid overestimatingsequestration. Annual accumulation in agricultural soils could be equivalent to about 10% of Annex I carbondioxide emissions, <strong>and</strong> <strong>the</strong>refore options for limiting sink credits from soils should be considered.
10 <strong>IEA</strong> <strong>Bioenergy</strong> <strong>Task</strong> 25 Workshop, Joensuu, Finl<strong>and</strong>: LULUCF: The Road to COP6ADDRESSING COP6 DECISIONS ON AGRICULTURAL SOIL CARBON ACCUMULATIONDr. Susan SubakFellow, American Association for <strong>the</strong> Advancement of ScienceBased at: Office of Atmospheric ProgramsU.S. Environmental Protection AgencyWashington DCsubak.susan@epa.govIn <strong>the</strong> United States, a strong constituency for including agriculture soils in <strong>the</strong> Kyoto ProtocolA. Support among U.S. “Conservatives”Midwestern farmers <strong>and</strong> Republican Members of Congress have been supporting <strong>the</strong> idea of rewardingcarbon sequestration on American farml<strong>and</strong>, although potential is small (~ 0.1 t C/ha/year forconservation tillage; ~ 0.3 t C/ha/year for cover crops)B. Some support among U.S. environmental organizationsViewed as environmentally beneficial because practices that sequester carbon in soil tend to prevent soilerosion <strong>and</strong> reduce requirements for fertilizer. Viewed to be less of a loophole than forests becausepotential sequestration is relatively small for Annex I.Considerations for COP6 <strong>and</strong> Beyond: Additionality Verifiability Reversibility Indirect Effects
S.Subak – Addressing COP6 Decisions on Agricultural Soil Carbon 11Sources <strong>and</strong> Sinks of Carbon from Agricultural SoilsSourcesTransformations • Cropl<strong>and</strong>s from wetl<strong>and</strong>s• Cropl<strong>and</strong>s fromgrassl<strong>and</strong>sSinks• Set-aside (to grassl<strong>and</strong>or woodl<strong>and</strong>)ProductionSoilconservation• Cropl<strong>and</strong>s from naturalecosystems• Lower residue yield (maybe due to fertilizer inputsor genetic improvements)• <strong>Change</strong> to crop typeswith lower biomass levels• Lower lignin contentcrops• Longer fallow• Intensive till• Residue (straw) sales• Stubble burning• Higher residue yields• <strong>Change</strong> to crops withhigher biomass levels(agroforestry or certaincrop switching to e.g.from soybeans to corn)• Higher lignin contentcrops• Shorter fallow• No-till or minimum till• Residue incorporationinto soils• Cover crops (inter-rowwith perennials; orwinter cover forannuals)• Control of soil waterO<strong>the</strong>r • liming • Animal manure orsewage sludge storage
12 <strong>IEA</strong> <strong>Bioenergy</strong> <strong>Task</strong> 25 Workshop, Joensuu, Finl<strong>and</strong>: LULUCF: The Road to COP6O<strong>the</strong>r Environmental Impacts of Agricultural ManagementPositiveNegativeCrop <strong>and</strong>residue yieldincreasethrough fertilizerinputs• Nitrous oxide emissions fromnitrogen fertilizers (Mosier etal., 1995)• Fossil fuel energy inputs toproduce nitrogen fertilizer• Reduced soil uptake ofmethane after nitrogenfertilizer use (Stendler, 1989;Bronson <strong>and</strong> Mosier, 1993cited in Paustian 1995)• Methane emissions related toorganic fertilizer applicationSoil conservationpractices• water pollutionCover Crops• Nitrogen-fixing cropsespecially reducerequirements for fertilizerNo-till• Some species can reducerequirements for pesticides(Pan, 1999)• Reduce emissions ofparticulates by reducingwind erosion• Reduces soil erosion• Reduces fertilizerconsumption• Reduces fossil fuelemissions from tractors• May reduce nitrous oxideemissions (Li, et al., 1996)• May reduce <strong>the</strong> rate ofmethane consumption (Coleet al., 1993)• Increased herbicide use• May increase nitrous oxideemissions (Cole et al., 1993)
S.Subak – Addressing COP6 Decisions on Agricultural Soil Carbon 131. Additionality: Can Business-as-Usual tons be identified?A. In excess of 1990 sequestrationB. In excess of 1990-2008 trendC. Best practices applied to any activityD. Best practices defined as certain activities (e.g. cover crops)US additionality test in <strong>the</strong> CDM (September 2000):“<strong>the</strong> project activity achieve a level of performance…that is significantly better than average compared withrecently undertaken activities or facilities”<strong>L<strong>and</strong></strong>s under no-till in <strong>the</strong> USA increased by more than four-fold between 1989 <strong>and</strong> 1997Carbon Uptake in Agricultural Soils: Recent EstimatesUSA 9 MT (net) 1998 US Inventory (Eve et al., 2000)9 - 24 MT C/yr (net) 2008-2012 Business as Usual: August 1, 2000 submission~ 50 MT C/yr potential Donigian et al., 1994~ 30 MT C/yr recent extr. Buyanovsky <strong>and</strong> Wagner, 1998Europe --------- 2008-2012 August 1, 2000 submission43 MT C/yr potential Smith et al., 1998FSU 340 MT C/yr potential Kolchugina et al., 1995
14 <strong>IEA</strong> <strong>Bioenergy</strong> <strong>Task</strong> 25 Workshop, Joensuu, Finl<strong>and</strong>: LULUCF: The Road to COP62. Verifiability: Will <strong>the</strong> uncertainties be manageable?MonitoringA. Site (farm) specific sampling <strong>and</strong> verification?B. Model-based analysis with some samplingFarms in USATotal Cropl<strong>and</strong>Sampling frequency in 1990sRecommended frequency for basic soil tests~ 2 million~100 millionhectares1 in 60 hectares1 in 2-8 hectaresEstimated % of farms survey in <strong>the</strong> 1990s < 10%% of farmers now taking own samples 1-2%Estimated cost per sample $50-$75Cost for sampling every 10 hectares in 2008, 2012Cost per tonne sequestered assuming 30 MT Caccumulation>$1 billion$33/tonne
S.Subak – Addressing COP6 Decisions on Agricultural Soil Carbon 153. Reversibility: Approaches for addressing reversal of soil sequestrationA. Expiring TonsB. Stock <strong>Change</strong> - Liability, with insuranceC. Ton-Year AccountingProbably <strong>the</strong> same considerations exist as for forests: Liability, availability <strong>and</strong> rates of insurance,uncertainties for future CER prices.4. Indirect Effects: Can human induced effects be separated from natural effects?A. Control plots to sitesB. Adjustments based on model factors, i.e. crop type, regional climatePossible that adjustments for indirect effects exclude agricultural crops because of minor implicationsfor total uptake termRecommendations for Fur<strong>the</strong>r Research1. Better research on residue yields needed2. Research on <strong>the</strong> non-carbon impacts of agricultural soil activities3. Continued research on indirect effects (temperature, CO 2 fertilization etc.)Components of an Incentive Program1. Include farms that are not considered “highly erodible”2. Provide incentives for increasing residue, ra<strong>the</strong>r than crop yields3. Encourage long-term, ra<strong>the</strong>r than short-term, activities4. Provide incentives for establishing <strong>and</strong> maintaining cover crops5. Continue programs to encourage conservation tillage
A.Cowie <strong>and</strong> K.Lamb – Measuring <strong>and</strong> marketing carbon sequestration in planted forests 17Measuring <strong>and</strong> marketing carbon sequestration in plantedforests in New South Wales, AustraliaAnnette Cowie <strong>and</strong> Keith LambState Forests of New South Wales, Australia.ABSTRACTThe Kyoto Protocol to <strong>the</strong> Framework Convention on Climate <strong>Change</strong> has established carbon as a tradeablecommodity, offering financial returns from “carbon credits” to increase management flexibility <strong>and</strong>profitability of forestry. Australia has large areas of agricultural l<strong>and</strong> suitable for developing Kyotocompliant plantations, where reforestation can provide multiple environmental <strong>and</strong> social benefits includingamelioration of dryl<strong>and</strong> salinity, biodiversity enhancement <strong>and</strong> diversification of rural incomes.Consequently, <strong>the</strong> NSW State Government has taken action to facilitate <strong>the</strong> expansion of planted forests,including legislative reforms to support bilateral contractual carbon trades <strong>and</strong> a proposed derivatives marketfor trading carbon credits.State Forests of NSW, a government-owned trading enterprise, has attracted new investment in Kyotocompliant forests from companies wishing to take early action in anticipation of enforcement of emissionscontrols. Investors retain <strong>the</strong> rights to <strong>the</strong> wood <strong>and</strong> carbon arising from <strong>the</strong> new forests <strong>and</strong> hedge <strong>the</strong>speculative carbon right against <strong>the</strong> conventional wood-based returns from existing industry.To support carbon trading, State Forests has developed a draft Carbon Accounting St<strong>and</strong>ard that allowscarbon credits to be quantified in a transparent <strong>and</strong> verifiable manner. The draft St<strong>and</strong>ard takes a qualitativesystems approach to limit <strong>the</strong> exposure of growers to <strong>the</strong> risk of overselling, specifying three levels ofcertification to reflect different levels of sophistication <strong>and</strong> investment in carbon accounting. Fur<strong>the</strong>rdevelopments will see <strong>the</strong> st<strong>and</strong>ardisation of procedures for quantitatively appraising uncertainty inforecasts.Verification <strong>and</strong> certification of tradeable carbon will <strong>the</strong>n be appraised on growers’ managementcompetence <strong>and</strong> risk h<strong>and</strong>ling procedures.State Forests’ carbon accounting system for hardwood (eucalypt) plantations is based on conventionalinventory <strong>and</strong> modelling systems for wood production, <strong>and</strong> tracks <strong>the</strong> carbon stocks in above <strong>and</strong> belowgroundtree biomass, understorey, litter <strong>and</strong> soil pools. Current research is focussed on efficient derivation ofbiomass allometrics, soil carbon dynamics under afforestation <strong>and</strong> management of forests for joint carbonwoodproduction.Financial modelling reveals that incorporating a market price for carbon into <strong>the</strong> joint carbon-woodproduction possibility frontier increases NPV. Forward selling will alleviate early negative cash flow,although <strong>the</strong> buy price is likely to include a discount for <strong>the</strong> cost of long term capital investment (up to2012), <strong>and</strong> <strong>the</strong> risk of non-ratification by Annexe B countries. Profits will be higher for those who c<strong>and</strong>istribute <strong>the</strong> growing costs between wood <strong>and</strong> carbon, however growers will face <strong>the</strong> risk of adversemovements in <strong>the</strong> carbon-wood price ratio.A key issue is <strong>the</strong> h<strong>and</strong>ling of risk <strong>and</strong> uncertainty as <strong>the</strong> greenhouse policy agenda evolves. <strong>Forestry</strong> is lowriskfinancially efficient option for directing greenhouse-related investment until <strong>the</strong> accounting rules areagreed <strong>and</strong> <strong>the</strong> Kyoto Protocol enters into force. Success of <strong>the</strong> carbon trading market will depend onconfidence in <strong>the</strong> product that is underpinned by a sound knowledge of forest carbon dynamics, defendablecarbon accounting procedures <strong>and</strong> competent forest management.
Measuring <strong>and</strong> marketingcarbon sequestration in plantedforestsNew South Wales, AustraliaAnnette CowieKeith LambState Forests of NSW, CRC Greenhouse AccountingContent• Carbon trading in NSW• Carbon accounting - project scale– monitoring carbon sequestration in NSWplantations• Creating a carbon credit product– Carbon accounting st<strong>and</strong>ard• Marketing sequestered carbon• Managing for carbon <strong>and</strong> woodproductionAustralia's Greenhouse GasEmissions 1996Fugitive7%Transport16%Agriculture19%Waste4%Total 419 Mt CO 2 - 23t per capitaIndustrialprocesses2%1Stationaryenergy52%(Australian Greenhouse Office)3Opportunities for <strong>Forestry</strong>• Carbon trading from conventionalplanted forests• Environmental, rehabilitation planting• Timber as a greenhouse-friendlybuilding product• Biomass for bioenergy,substituting for fossil fuels24 .
20 <strong>IEA</strong> <strong>Bioenergy</strong> <strong>Task</strong> 25 Workshop, Joensuu, Finl<strong>and</strong>: LULUCF: The Road to COP6<strong>Bioenergy</strong> options forforest biomass• st<strong>and</strong>-alone• co-firing with coal• supplementing bagasse• ethanol• charcoal for metallurgicalprocessesNational• National Greenhouse Strategy• Australian Greenhouse Office– National Carbon Accounting System– Determining 1990 baseline emissions• Renewables legislation56NSW - State ForestsCarbon Trading Activities• Carbon Rights Legislation Amendment Act 1998– legal recognition of ownership <strong>and</strong> trade ofcarbon rights• First Australian carbon trades– Pacific Power, Delta Electricity• Carbon trade with Tokyo Electric Power Co• Sydney Futures Exchange– Carbon Accounting St<strong>and</strong>ardLitterSoilorganicmatterAtmosphereAbovegroundbiomassBelow -groundbiomassCarbon Accounting SystemsWood products7Measuring Carbon Sequestration in Forests8 .
Measuring CarbonSequestration in Forests• measuring <strong>and</strong> modelling procedureslinked to existing wood productionmanagement systems• expansion factors for o<strong>the</strong>r majorcarbon pools• new approaches using process-basedmodelsKey features of a carbonaccounting system:• robust <strong>and</strong> cost effective• transparent• compatibleCarbon accounting systems will bescrutinised.910Components of a Carbon Accounting SystemData InputsReviewSimulationAssumptionsOutput DataMonitoring& Reporting11Biomass measurement in E. dunnii plantationAim: To develop allometric equation relating biomass tost<strong>and</strong>ard inventory measurements. 12 .
22 <strong>IEA</strong> <strong>Bioenergy</strong> <strong>Task</strong> 25 Workshop, Joensuu, Finl<strong>and</strong>: LULUCF: The Road to COP6Biomass kg/treeMeasuring Carbon Sequestration in Forests504030201002 year old Eucalyptus dunniiy = 0.0023x 2.06R 2 = 0.960 20 40 60 80 100 120dbhob (mm)Carbon sequestration over 2 years ofplantation growth:Net increase of 6 t/ha (3 t carbon/ha)Biomass(t DM / ha)302520151050Baseline 1 year 2 yearsTreeUnderstorey +litterFine rootsWeighing E. pilularis, using 2.5 t load cell, Ourimbah State Forest.1314Blackbutt biomass (above- <strong>and</strong> below-ground) forsampled trees at Ourimbah (native forest) <strong>and</strong> Heaton(plantation)10.09.08.0OurimbahHeaton15ln Biomass7.0 Linear6.05.04.03.02.01.00.04.0 4.5 5.0 5.5 6.0 6.5 7.0ln DBH16
Remote-sensing tools to estimate carbon1. Coarse sievesurface soil(23%)• species recognition• area estimation(planted - harvested)• direct biomassestimation• height measurementsEfficient techniques:Ground penetrating radar?173. Soil cores to fine sieve- backfill soil (13%)- deep soil (22%)2. Extract stump(42%)Mean proportion ofroot biomass bysampling method,P.pinaster, WAP. Ritson, CRCGreenhouseAccounting 18Ground Penetrating Radar1920 .
24 <strong>IEA</strong> <strong>Bioenergy</strong> <strong>Task</strong> 25 Workshop, Joensuu, Finl<strong>and</strong>: LULUCF: The Road to COP6Ground Penetrating RadarTree Root Volume ComputationCarbon pools: 2 year old E. dunnii plantation3.2 2.2 2.6103tonnes carbon per haTreeUnderstoreyFine rootSoil2122Plant C Soil C Net CState Forests NSW Carbon Bank Annual Balance Sheet.Carbon sequestration PERIOD: Sequestered AvalailableBalanceCarbon (t/ha)12080400-40-800 10 20 30 40 50 60 70 80Time (years)Management Verification Location Crop Crop Modelling DetailsSt<strong>and</strong>ing C02(t) Sequestered CO2 (t)Planted Forests Carbon TableSt<strong>and</strong>ing C02(t) Liabilities30 year rotation, thinned twice23softwoodshardwoodstotal24 .
Creating a Carbon CreditProductRequirements:• a st<strong>and</strong>ardised tradeable carbon mass• a rigorous carbon trading systemRequirements of Carbon Accounting St<strong>and</strong>ard• open to all on a merit basis• ensure market confidence• practical <strong>and</strong> acceptable to forestmanagersCarbon Accounting St<strong>and</strong>ard• appraisal of carbon accounting systemsby independent verifier• certification of tradeable carbon mass2526Creating a Carbon Credit ProductCertificationSystemFrameworkSTANDARDComplianceRequirementsAccountingSystemSystemImprovementVERIFICATIONAppraisalIndependentVerifierCreation ofCertificateCertificationCarbonSequestrationCredit• By independent verifier• Three levels available:• 1. Easily achieved at low cost, usingdefault accounting assumptions: 40%tradeable• 2. Some site specific data <strong>and</strong> models:60% tradeable• 3. Best practice carbon accounting:80% tradeable2728 .
26 <strong>IEA</strong> <strong>Bioenergy</strong> <strong>Task</strong> 25 Workshop, Joensuu, Finl<strong>and</strong>: LULUCF: The Road to COP6Emissions Trading• model developed with Sydney FuturesExchange, market based on Article 3.3 KyotoProtocol• trading model linking growers to market viapool structure• tradeable carbon certified under <strong>the</strong> CarbonAccounting St<strong>and</strong>ardEmissions TradingLinkages with National Reporting Requirements (NCAS)National Reporting<strong>Forestry</strong> Carbon LedgerNational AgencyEmissions TradingTrading HousesCarbon Pool ManagersR & D AgenciesCertified carbonInvestorsAccredited AgentAccreditationForest Growers2930GrowersState Forestso<strong>the</strong>rgrowerso<strong>the</strong>rgrowerso<strong>the</strong>rgrowersEmissions Trading - Proposed ModelAppraisalof system viast<strong>and</strong>ardPoolManagersStateForestscarbon poolo<strong>the</strong>rcarbon poolsSFE ContractualrequirementsEmissionsMarketSydneyFuturesExchangeo<strong>the</strong>r marketsCarbon pool• Access to market at minimum cost• Efficient risk management, carbonaccounting <strong>and</strong> certification• Harvest losses balanced across <strong>the</strong>poolCertification of carbonby independent verifierO<strong>the</strong>r Marketsrequirements3132
Annual increment <strong>and</strong> cumulative CO2 . Moderate Site Quality Eucalyptus pilularis500Annual Increment CO2Net Cumulative CO2 - stock change approach45,000Net carbon dioxide sequestered by 32 age classes of 100 ha.Moderate productivity Eucalyptus pilularis plantationSpatialsequestration40040,00030035,00030,000Carbon Dioxide (t/ha)20010001 3 5 7 9 11 13 15 17 19 21 23 25 27 29 31 33 35 37 39 41 43 45 47 49Carbon dioxide (t)25,00020,00015,00010,000-1005,0000-200First rotationSecond rotation1999 2003 2007 2011 2015 2019 2023 2027 2031 2035 2039 2043 2047 2051 2055 2059 2063 2067YearTemporal sequestration-300Age (yrs)3334Total pool carbon sequestration from32 age classes of 100 ha eachCumulative net cash flowunder a range of carbon prices700,000Pool Increment600,000500,000Pooled Net CumulativeCarbon dioxideSteadyStateCarbon dioxide (t)400,000300,000200,000IncrementZoneCash Flow $/haWood Revenue R2100,000Wood Revenue R101 3 5 7 9 11 13 15 17 19 21 23 25 27 29 31 33 35 37 39 41 43 45 47 491 4 7 10 13 16 19 22 25 28 31 34 37 40 43 46 49 52 55 58 61 64 67 70 73 76 79 82 85 88 91First Rotation Second Rotation Third Rotation-100,000Year35Year36
28 <strong>IEA</strong> <strong>Bioenergy</strong> <strong>Task</strong> 25 Workshop, Joensuu, Finl<strong>and</strong>: LULUCF: The Road to COP6$25,000$20,000$15,000Comparison of cumulative cash flow under four trading strategiesfor forests planted in 1999wood onlyannual carbon with woodcarbon futures with woodcarbon futures no woodCP1120,000100,00080,000Investment Profile for property on north coast of NSWEstate-level carbon dioxide sequestrationEarly thinningprior to KP1Thinnings <strong>and</strong> harvest afterKP1 dependent on relativeprice of carbon <strong>and</strong> wood$/ha$10,000$5,000carbon dioxide (t)60,00040,000KP1 First Kyotocomittment period$02000 2002 2004 2006 2008 2010 2012 2014 2016 2018 2020 2022 2024 2026 2028 203020,000-$5,000years01999 2001 2003 2005 2007 2009 2011 2013 2015 2017 2019 2021 2023 2025 2027year3738Carbon (t/ha)12080400-40-80Plant C Soil C Net C0 10 20 30 40 50 60 70 80Time (years)30 year rotation, thinnedtwiceAverage sequestration inplant biomass over60years is 44 t/haAverage net sequestrationis 36 t/haState Forests’ Carbon Management Strategies• conventional objectives to optimise return fromwood production• judicial timing of thinning <strong>and</strong> harvest tooptimise return from carbon <strong>and</strong> woodCarbon (t/ha)12080400-40-800 10 20 30 40 50 60 70 8015 year rotation,unthinned.Average sequestration inplant biomass over60years is 32 t/haAverage netsequestration is 3 t/ha• carbon losses at thinning <strong>and</strong> harvest offsetacross pool• large corporate buffer to offset unexpectedlosses, poor growth performance, uncertainty inmodelsTime (years)Plant C Soil C Net C3940
Carbon trading:• New business opportunity for forestry:carbon sequestration services• Carbon Accounting St<strong>and</strong>ard creates ast<strong>and</strong>ard carbon sequestration productfor trading• Grower chooses level of investment incarbon accounting• Carbon pool allows participation ofsmall <strong>and</strong> large growersChallenge: integratedmanagement for carbon <strong>and</strong>timber productionMore information:• www.forest.nsw.gov.au4142