Weir Group 2013 Interim Report (PDF, 0.59 MB) - The Weir Group
Weir Group 2013 Interim Report (PDF, 0.59 MB) - The Weir Group
Weir Group 2013 Interim Report (PDF, 0.59 MB) - The Weir Group
- No tags were found...

Create successful ePaper yourself
Turn your PDF publications into a flip-book with our unique Google optimized e-Paper software.
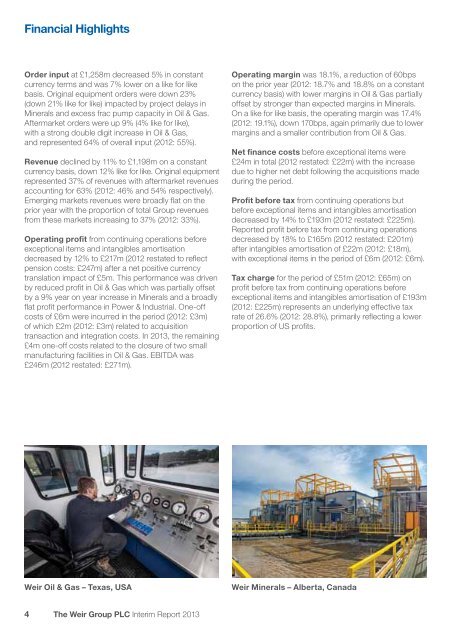
Financial HighlightsOrder input at £1,258m decreased 5% in constantcurrency terms and was 7% lower on a like for likebasis. Original equipment orders were down 23%(down 21% like for like) impacted by project delays inMinerals and excess frac pump capacity in Oil & Gas.Aftermarket orders were up 9% (4% like for like),with a strong double digit increase in Oil & Gas,and represented 64% of overall input (2012: 55%).Revenue declined by 11% to £1,198m on a constantcurrency basis, down 12% like for like. Original equipmentrepresented 37% of revenues with aftermarket revenuesaccounting for 63% (2012: 46% and 54% respectively).Emerging markets revenues were broadly flat on theprior year with the proportion of total <strong>Group</strong> revenuesfrom these markets increasing to 37% (2012: 33%).Operating profit from continuing operations beforeexceptional items and intangibles amortisationdecreased by 12% to £217m (2012 restated to reflectpension costs: £247m) after a net positive currencytranslation impact of £5m. This performance was drivenby reduced profit in Oil & Gas which was partially offsetby a 9% year on year increase in Minerals and a broadlyflat profit performance in Power & Industrial. One-offcosts of £6m were incurred in the period (2012: £3m)of which £2m (2012: £3m) related to acquisitiontransaction and integration costs. In <strong>2013</strong>, the remaining£4m one-off costs related to the closure of two smallmanufacturing facilities in Oil & Gas. EBITDA was£246m (2012 restated: £271m).Operating margin was 18.1%, a reduction of 60bpson the prior year (2012: 18.7% and 18.8% on a constantcurrency basis) with lower margins in Oil & Gas partiallyoffset by stronger than expected margins in Minerals.On a like for like basis, the operating margin was 17.4%(2012: 19.1%), down 170bps, again primarily due to lowermargins and a smaller contribution from Oil & Gas.Net finance costs before exceptional items were£24m in total (2012 restated: £22m) with the increasedue to higher net debt following the acquisitions madeduring the period.Profit before tax from continuing operations butbefore exceptional items and intangibles amortisationdecreased by 14% to £193m (2012 restated: £225m).<strong>Report</strong>ed profit before tax from continuing operationsdecreased by 18% to £165m (2012 restated: £201m)after intangibles amortisation of £22m (2012: £18m),with exceptional items in the period of £6m (2012: £6m).Tax charge for the period of £51m (2012: £65m) onprofit before tax from continuing operations beforeexceptional items and intangibles amortisation of £193m(2012: £225m) represents an underlying effective taxrate of 26.6% (2012: 28.8%), primarily reflecting a lowerproportion of US profits.<strong>Weir</strong> Oil & Gas – Texas, USA<strong>Weir</strong> Minerals – Alberta, Canada4 <strong>The</strong> <strong>Weir</strong> <strong>Group</strong> PLC <strong>Interim</strong> <strong>Report</strong> <strong>2013</strong>