East-West Center Annual Report 2001
East-West Center Annual Report 2001
East-West Center Annual Report 2001
- No tags were found...

You also want an ePaper? Increase the reach of your titles
YUMPU automatically turns print PDFs into web optimized ePapers that Google loves.
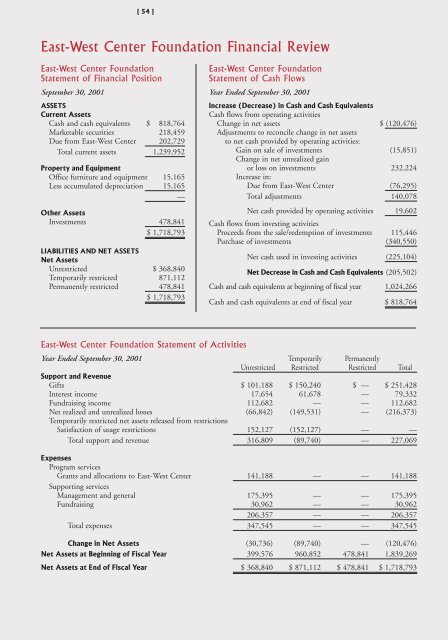
[ 54 ]<strong>East</strong>-<strong>West</strong> <strong>Center</strong> Foundation Financial Review<strong>East</strong>-<strong>West</strong> <strong>Center</strong> FoundationStatement of Financial PositionSeptember 30, <strong>2001</strong>ASSETSCurrent AssetsCash and cash equivalents $ 818,764Marketable securities 218,459Due from <strong>East</strong>-<strong>West</strong> <strong>Center</strong> 202,729Total current assets 1,239,952Property and EquipmentOffice furniture and equipment 15,165Less accumulated depreciation 15,165—Other AssetsInvestments 478,841$ 1,718,793LIABILITIES AND NET ASSETSNet AssetsUnrestricted $ 368,840Temporarily restricted 871,112Permanently restricted 478,841$ 1,718,793<strong>East</strong>-<strong>West</strong> <strong>Center</strong> FoundationStatement of Cash FlowsYear Ended September 30, <strong>2001</strong>Increase (Decrease) in Cash and Cash EquivalentsCash flows from operating activitiesChange in net assets $ (120,476)Adjustments to reconcile change in net assetsto net cash provided by operating activities:Gain on sale of investments (15,851)Change in net unrealized gainor loss on investments 232,224Increase in:Due from <strong>East</strong>-<strong>West</strong> <strong>Center</strong> (76,295)Total adjustments 140,078Net cash provided by operating activities 19,602Cash flows from investing activitiesProceeds from the sale/redemption of investments 115,446Purchase of investments (340,550)Net cash used in investing activities (225,104)Net Decrease in Cash and Cash Equivalents (205,502)Cash and cash equivalents at beginning of fiscal year 1,024,266Cash and cash equivalents at end of fiscal year $ 818,764<strong>East</strong>-<strong>West</strong> <strong>Center</strong> Foundation Statement of ActivitiesYear Ended September 30, <strong>2001</strong> Temporarily PermanentlyUnrestricted Restricted Restricted TotalSupport and RevenueGifts $ 101,188 $ 150,240 $ — $ 251,428Interest income 17,654 61,678 — 79,332Fundraising income 112,682 — — 112,682Net realized and unrealized losses (66,842) (149,531) — (216,373)Temporarily restricted net assets released from restrictionsSatisfaction of usage restrictions 152,127 (152,127) — —Total support and revenue 316,809 (89,740) — 227,069ExpensesProgram servicesGrants and allocations to <strong>East</strong>-<strong>West</strong> <strong>Center</strong> 141,188 — — 141,188Supporting servicesManagement and general 175,395 — — 175,395Fundraising 30,962 — — 30,962206,357 — — 206,357Total expenses 347,545 — — 347,545Change in Net Assets (30,736) (89,740) — (120,476)Net Assets at Beginning of Fiscal Year 399,576 960,852 478,841 1,839,269Net Assets at End of Fiscal Year $ 368,840 $ 871,112 $ 478,841 $ 1,718,793