Demography and epidemiology: Practical use of the Lexis diagram ...
Demography and epidemiology: Practical use of the Lexis diagram ...
Demography and epidemiology: Practical use of the Lexis diagram ...

You also want an ePaper? Increase the reach of your titles
YUMPU automatically turns print PDFs into web optimized ePapers that Google loves.
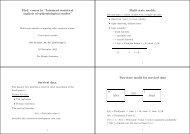
10 Example: Renal failure data.<br />
Th phrase “age (at entry) is controlled for” in a Cox model <strong>of</strong>ten means that <strong>the</strong><br />
(log)linear effect <strong>of</strong> age (at entry or current) is included along with an arbitrary effect <strong>of</strong><br />
time since entry. No consideration nei<strong>the</strong>r qualitatively nor quantitatively has been given<br />
to whea<strong>the</strong>r a non-linear effect <strong>of</strong> age at entry <strong>and</strong>/or current age would be reasonable.<br />
If “controlling for age at entry” is done by entering age at entry as a categorized<br />
covariate or parametric function <strong>of</strong> some sort, <strong>the</strong> effect <strong>of</strong> current age is still assumed<br />
only linear on <strong>the</strong> log-rate scale. Introducing a non-linear effect for <strong>the</strong> last time-scale<br />
will open <strong>the</strong> well known can <strong>of</strong> worms: The age-period-cohort parametrization<br />
problems, as mentioned above.<br />
Example: Renal failure data.<br />
As an example we shall consider an extension <strong>of</strong> <strong>the</strong> analysis <strong>of</strong> time to death among<br />
diabetic patients with nephrotic range albuminuria (NRA), i.e. a U-albumin excretion<br />
exceeding 300 mg/24h, as reported in [3].<br />
The data base for this analysis is illustrated in <strong>the</strong> <strong>Lexis</strong> <strong>diagram</strong>s in figure 3. The<br />
results from <strong>the</strong> paper’s table 3 are shown here in table 1.<br />
There is clearly a linear effect <strong>of</strong> age at entry (or current age), but <strong>the</strong> analysis<br />
presented does not address <strong>the</strong> question <strong>of</strong> whe<strong>the</strong>r <strong>the</strong>re are non-linear effects <strong>of</strong> <strong>the</strong><br />
two time-scales.<br />
Table 1: Results from a traditional Cox-analysis with remission as time-dependent covariate,<br />
as reported in Hovind et al. (2004), table 4.<br />
Remission<br />
Total Yes No<br />
No. patients 125 32 93<br />
No. events 77 8 69<br />
Follow-up time (years) 1084.7 259.9 824.8<br />
Cox-model:<br />
time-scale: Time since nephrotic range albuminuria (NRA)<br />
Entry: 2.5 years <strong>of</strong> GFR-measurements after NRA<br />
Outcome: ESRD or Death<br />
Estimates: RR 95% c.i. p<br />
Fixed covariates:<br />
Sex (F vs. M): 0.92 (0.53,1.57) 0.740<br />
Age at NRA (per 10 years): 1.42 (1.08,1.87) 0.011<br />
Time-dependent covariate:<br />
Obtained remission: 0.28 (0.13,0.59) 0.001