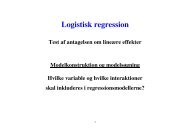
Demography and epidemiology: Practical use of the Lexis diagram ...
Demography and epidemiology: Practical use of the Lexis diagram ...
Demography and epidemiology: Practical use of the Lexis diagram ...

You also want an ePaper? Increase the reach of your titles
YUMPU automatically turns print PDFs into web optimized ePapers that Google loves.
18 9 Programs <strong>use</strong>d<br />
9 Programs <strong>use</strong>d<br />
lung-ex.R<br />
Program that takes <strong>the</strong> Mayo clinic lung cancer survival data, <strong>and</strong> analyses it both by<br />
<strong>the</strong> Cox-model <strong>and</strong> by <strong>the</strong> Poisson-model for split follow-up data.<br />
Illustrates that <strong>the</strong> Cox-likelihood <strong>and</strong> <strong>the</strong> Poisson-approach gives exactly <strong>the</strong> same<br />
results whereas <strong>the</strong> approaches smoothing <strong>the</strong> underlying hazard gives almost <strong>the</strong> same.<br />
Also illustrates how to compute <strong>the</strong> survival function with confidence limits using<br />
<strong>the</strong> Poisson-approach with smooth underlying hazard.<br />
R 1.9.0<br />
---------------------------------------------<br />
Program: lung-ex.R<br />
Folder: C:\Bendix\Artikler\WntCma\R<br />
Started: tirsdag 10. august 2004, 14:29:38<br />
---------------------------------------------<br />
> library( splines )<br />
> library( <strong>Lexis</strong> )<br />
Attaching package '<strong>Lexis</strong>':<br />
The following object(s) are masked from package:Useful :<br />
ci.lin steplines<br />
The following object(s) are masked from package:Epi :<br />
interp lines.est nice plot.est points.est print.floated ROC ROC.tic steplines tabplot twoby2 weeks<br />
> library( survival )<br />
> data( lung )<br />
> str( lung )<br />
`data.frame': 228 obs. <strong>of</strong> 10 variables:<br />
$ inst : num 3 3 3 5 1 12 7 11 1 7 ...<br />
$ time : num 306 455 1010 210 883 ...<br />
$ status : num 2 2 1 2 2 1 2 2 2 2 ...<br />
$ age : num 74 68 56 57 60 74 68 71 53 61 ...<br />
$ sex : num 1 1 1 1 1 1 2 2 1 1 ...<br />
$ ph.ecog : num 1 0 0 1 0 1 2 2 1 2 ...<br />
$ ph.karno : num 90 90 90 90 100 50 70 60 70 70 ...<br />
$ pat.karno: num 100 90 90 60 90 80 60 80 80 70 ...<br />
$ meal.cal : num 1175 1225 NA 1150 NA ...<br />
$ wt.loss : num NA 15 15 11 0 0 10 1 16 34 ...<br />
><br />
> table( lung$status )<br />
1 2<br />
63 165<br />
> table( table( lung$time ) )<br />
1 2 3<br />
146 38 2<br />
><br />
> system.time(<br />
+ c.res summary( c.res )<br />
Call:<br />
coxph(formula = Surv(time, status == 2) ~ age + factor(sex),<br />
data = lung, method = "breslow", eps = 10^-8, iter.max = 25)<br />
n= 228<br />
coef exp(coef) se(coef) z p<br />
age 0.017 1.017 0.00922 1.84 0.0650<br />
factor(sex)2 -0.513 0.599 0.16746 -3.06 0.0022<br />
exp(coef) exp(-coef) lower .95 upper .95<br />
age 1.017 0.983 0.999 1.036<br />
factor(sex)2 0.599 1.670 0.431 0.832<br />
Rsquare= 0.06 (max possible= 0.999 )