Discount Rate for Health Benefits and the Value of Life in India
Discount Rate for Health Benefits and the Value of Life in India
Discount Rate for Health Benefits and the Value of Life in India

You also want an ePaper? Increase the reach of your titles
YUMPU automatically turns print PDFs into web optimized ePapers that Google loves.
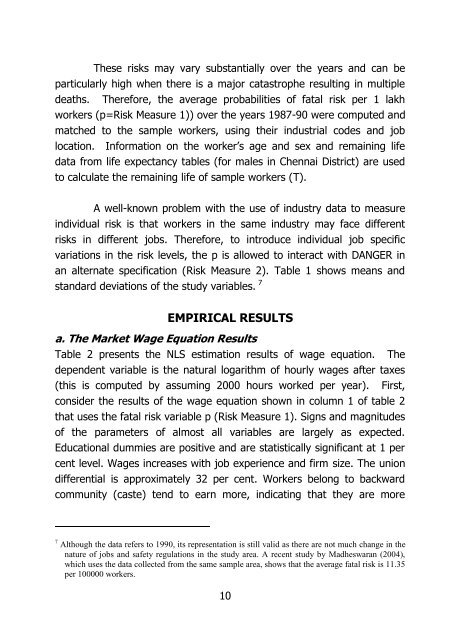
These risks may vary substantially over <strong>the</strong> years <strong>and</strong> can be<br />
particularly high when <strong>the</strong>re is a major catastrophe result<strong>in</strong>g <strong>in</strong> multiple<br />
deaths. There<strong>for</strong>e, <strong>the</strong> average probabilities <strong>of</strong> fatal risk per 1 lakh<br />
workers (p=Risk Measure 1)) over <strong>the</strong> years 1987-90 were computed <strong>and</strong><br />
matched to <strong>the</strong> sample workers, us<strong>in</strong>g <strong>the</strong>ir <strong>in</strong>dustrial codes <strong>and</strong> job<br />
location. In<strong>for</strong>mation on <strong>the</strong> worker’s age <strong>and</strong> sex <strong>and</strong> rema<strong>in</strong><strong>in</strong>g life<br />
data from life expectancy tables (<strong>for</strong> males <strong>in</strong> Chennai District) are used<br />
to calculate <strong>the</strong> rema<strong>in</strong><strong>in</strong>g life <strong>of</strong> sample workers (T).<br />
A well-known problem with <strong>the</strong> use <strong>of</strong> <strong>in</strong>dustry data to measure<br />
<strong>in</strong>dividual risk is that workers <strong>in</strong> <strong>the</strong> same <strong>in</strong>dustry may face different<br />
risks <strong>in</strong> different jobs. There<strong>for</strong>e, to <strong>in</strong>troduce <strong>in</strong>dividual job specific<br />
variations <strong>in</strong> <strong>the</strong> risk levels, <strong>the</strong> p is allowed to <strong>in</strong>teract with DANGER <strong>in</strong><br />
an alternate specification (Risk Measure 2). Table 1 shows means <strong>and</strong><br />
st<strong>and</strong>ard deviations <strong>of</strong> <strong>the</strong> study variables. 7<br />
EMPIRICAL RESULTS<br />
a. The Market Wage Equation Results<br />
Table 2 presents <strong>the</strong> NLS estimation results <strong>of</strong> wage equation. The<br />
dependent variable is <strong>the</strong> natural logarithm <strong>of</strong> hourly wages after taxes<br />
(this is computed by assum<strong>in</strong>g 2000 hours worked per year). First,<br />
consider <strong>the</strong> results <strong>of</strong> <strong>the</strong> wage equation shown <strong>in</strong> column 1 <strong>of</strong> table 2<br />
that uses <strong>the</strong> fatal risk variable p (Risk Measure 1). Signs <strong>and</strong> magnitudes<br />
<strong>of</strong> <strong>the</strong> parameters <strong>of</strong> almost all variables are largely as expected.<br />
Educational dummies are positive <strong>and</strong> are statistically significant at 1 per<br />
cent level. Wages <strong>in</strong>creases with job experience <strong>and</strong> firm size. The union<br />
differential is approximately 32 per cent. Workers belong to backward<br />
community (caste) tend to earn more, <strong>in</strong>dicat<strong>in</strong>g that <strong>the</strong>y are more<br />
7 Although <strong>the</strong> data refers to 1990, its representation is still valid as <strong>the</strong>re are not much change <strong>in</strong> <strong>the</strong><br />
nature <strong>of</strong> jobs <strong>and</strong> safety regulations <strong>in</strong> <strong>the</strong> study area. A recent study by Madheswaran (2004),<br />
which uses <strong>the</strong> data collected from <strong>the</strong> same sample area, shows that <strong>the</strong> average fatal risk is 11.35<br />
per 100000 workers.<br />
10

![Curriculum Vitae [pdf] - Madras School of Economics](https://img.yumpu.com/49878970/1/190x245/curriculum-vitae-pdf-madras-school-of-economics.jpg?quality=85)
![Curriculum Vitae [pdf] - Madras School of Economics](https://img.yumpu.com/48715201/1/184x260/curriculum-vitae-pdf-madras-school-of-economics.jpg?quality=85)