Discount Rate for Health Benefits and the Value of Life in India
Discount Rate for Health Benefits and the Value of Life in India
Discount Rate for Health Benefits and the Value of Life in India

You also want an ePaper? Increase the reach of your titles
YUMPU automatically turns print PDFs into web optimized ePapers that Google loves.
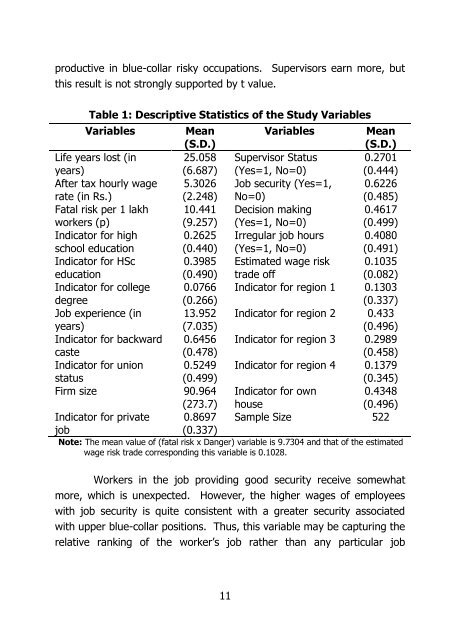
productive <strong>in</strong> blue-collar risky occupations. Supervisors earn more, but<br />
this result is not strongly supported by t value.<br />
Table 1: Descriptive Statistics <strong>of</strong> <strong>the</strong> Study Variables<br />
Variables Mean Variables Mean<br />
(S.D.)<br />
(S.D.)<br />
<strong>Life</strong> years lost (<strong>in</strong> 25.058 Supervisor Status 0.2701<br />
years)<br />
(6.687) (Yes=1, No=0)<br />
(0.444)<br />
After tax hourly wage 5.3026 Job security (Yes=1, 0.6226<br />
rate (<strong>in</strong> Rs.)<br />
(2.248) No=0)<br />
(0.485)<br />
Fatal risk per 1 lakh 10.441 Decision mak<strong>in</strong>g 0.4617<br />
workers (p)<br />
(9.257) (Yes=1, No=0)<br />
(0.499)<br />
Indicator <strong>for</strong> high 0.2625 Irregular job hours 0.4080<br />
school education (0.440) (Yes=1, No=0)<br />
(0.491)<br />
Indicator <strong>for</strong> HSc 0.3985 Estimated wage risk 0.1035<br />
education<br />
(0.490) trade <strong>of</strong>f<br />
(0.082)<br />
Indicator <strong>for</strong> college 0.0766 Indicator <strong>for</strong> region 1 0.1303<br />
degree<br />
(0.266)<br />
(0.337)<br />
Job experience (<strong>in</strong> 13.952 Indicator <strong>for</strong> region 2 0.433<br />
years)<br />
(7.035)<br />
(0.496)<br />
Indicator <strong>for</strong> backward 0.6456 Indicator <strong>for</strong> region 3 0.2989<br />
caste<br />
(0.478)<br />
(0.458)<br />
Indicator <strong>for</strong> union 0.5249 Indicator <strong>for</strong> region 4 0.1379<br />
status<br />
(0.499)<br />
(0.345)<br />
Firm size 90.964 Indicator <strong>for</strong> own 0.4348<br />
(273.7) house<br />
(0.496)<br />
Indicator <strong>for</strong> private 0.8697 Sample Size 522<br />
job<br />
(0.337)<br />
Note: The mean value <strong>of</strong> (fatal risk x Danger) variable is 9.7304 <strong>and</strong> that <strong>of</strong> <strong>the</strong> estimated<br />
wage risk trade correspond<strong>in</strong>g this variable is 0.1028.<br />
Workers <strong>in</strong> <strong>the</strong> job provid<strong>in</strong>g good security receive somewhat<br />
more, which is unexpected. However, <strong>the</strong> higher wages <strong>of</strong> employees<br />
with job security is quite consistent with a greater security associated<br />
with upper blue-collar positions. Thus, this variable may be captur<strong>in</strong>g <strong>the</strong><br />
relative rank<strong>in</strong>g <strong>of</strong> <strong>the</strong> worker’s job ra<strong>the</strong>r than any particular job<br />
11


![Curriculum Vitae [pdf] - Madras School of Economics](https://img.yumpu.com/49878970/1/190x245/curriculum-vitae-pdf-madras-school-of-economics.jpg?quality=85)


![Curriculum Vitae [pdf] - Madras School of Economics](https://img.yumpu.com/48715201/1/184x260/curriculum-vitae-pdf-madras-school-of-economics.jpg?quality=85)