P. ADHIPATHI et al.,(w/v) agarose gel in Tris-acetate-EDTA (TAE) buffer (0.04 MTris-acetate, 0.001 M EDTA, pH 8.0). A 100- base pair (bp)ladder (Bangalore Genei Pvt Ltd, Banglore, India) was used asa size st<strong>and</strong>ard. To visualise DNA, gels were stained withethidium bromide (0.1mg L –1 ) <strong>and</strong> then photographed undertransmitted ultraviolet light, using an AlphaImager 2000 (AlphaInnotech, San Le<strong>and</strong>ro, CA, USA). All RAPD analyses wererepeated at least three times for each isolate only the RAPDb<strong>and</strong>s which appeared consistently were evaluated forpolymorphism (Madhavan et al., 2010).RESULTSExamination of cultural <strong>and</strong> morphological characteristicsThe isolates of Colletotrichum spp. were identified based onsize <strong>and</strong> shape of the conidia <strong>and</strong> confirmed as a C. capsici.Twenty isolates were assigned to seven morphological groups(CC-I to CC-VII) based on the differences in morphologicalcharacteristics (colony color, colony diameter <strong>and</strong> conidialshape <strong>and</strong> size). Various isolates produced zigzag cottony,ring or circular like with zigzag zonation colonies on PDAwith a color of greyish-white to dark grey or light brown on theventral surface whereas the reverse of the colonies was mainlyblack. The colony diameter of different groups ranged from67 to 87 mm after 12 days incubation. The colonies of groupCC-I produced zigzag cottony, smooth surface with grey togrey colonies, CC-II produced circular cottony colonies withwhite to grey colour, whereas the isolate in group CC-III <strong>and</strong>CC-VII possessed ring like or circular growth with zigzagzonation of colonies. The conidia shape of the different groupswas fusiform with both their ends are curved <strong>and</strong> pointed.Average length <strong>and</strong> width of conidia varied between 19.36 to28.53 μm <strong>and</strong> 3.25 to 4.65 μm, respectively. Twenty isolateswere grouped into two groups large (24.25 to 28.53 μm ×4.00 to 4.65 μm) <strong>and</strong> medium (19.36 to 24.25 μm × 3.25 to4.00 μm) based on the length <strong>and</strong> width of the conidiarespectively (Table 2).Effect of propiconazole on mycelial growth:The isolates were classified into four groups based on theirreaction to propiconazole fungicide. The first group werehighly resistant (
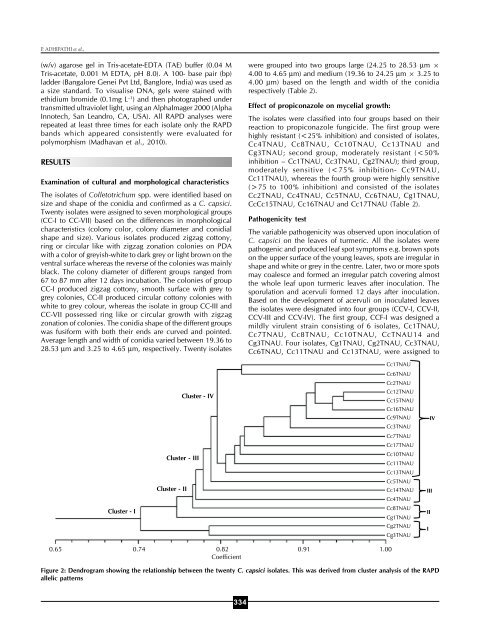
MORPHOLOGICAL CHARACTERIZATION AND MOLECULAR PHYLOGENYTable 3: Genetic similarity coefficient matrix for Colletotrichum capsici isolates from turmeric based on RAPD profileIsolates Cc1 Cc2 Cg1 Cc3 Cc4 Cc5 Cc6 Cg2 Cc7 Cg3 Cc8 Cc9 Cc10 Cc11 Cc12 Cc13 Cc14 Cc15 Cc16 Cc17TNAU TNAU TNAU TNAU TNAU TNAU TNAU TNAU TNAU TNAU TNAU TNAU TNAU TNAU TNAU TNAU TNAU TNAU TNAU TNAUCc1TNAU 1Cc2TNAU 0.82 1Cg1TNAU 0.72 0.79 1Cc3TNAU 0.81 0.91 0.79 1Cc4TNAU 0.77 0.82 0.77 0.80 1Cc5TNAU 0.80 0.85 0.77 0.83 0.76 1Cc6TNAU 0.84 0.85 0.78 0.83 0.78 0.81 1Cg2TNAU 0.74 0.77 0.68 0.77 0.70 0.69 0.77 1Cc7TNAU 0.77 0.88 0.78 0.84 0.79 0.81 0.80 0.75 1Cg3TNAU 0.69 0.76 0.68 0.76 0.69 0.70 0.77 0.81 0.74 1Cc8TNAU 0.77 0.82 0.75 0.81 0.75 0.78 0.82 0.70 0.77 0.73 1Cc9TNAU 0.85 0.92 0.80 0.87 0.82 0.84 0.84 0.76 0.85 0.75 0.82 1Cc10TNAU 0.79 0.86 0.75 0.82 0.79 0.76 0.80 0.73 0.84 0.71 0.75 0.83 1Cc11TNAU 0.77 0.86 0.75 0.82 0.79 0.78 0.78 0.74 0.85 0.71 0.77 0.84 0.81 1Cc12TNAU 0.83 0.92 0.83 0.89 0.83 0.86 0.86 0.83 0.87 0.81 0.83 0.91 0.85 0.85 1Cc13TNAU 0.78 0.85 0.74 0.80 0.82 0.75 0.79 0.73 0.80 0.70 0.76 0.84 0.80 0.78 0.86 1Cc14TNAU 0.79 0.82 0.77 0.79 0.73 0.78 0.78 0.70 0.77 0.67 0.77 0.82 0.77 0.77 0.83 0.76 1Cc15TNAU 0.85 0.94 0.83 0.92 0.85 0.86 0.88 0.81 0.89 0.79 0.85 0.93 0.87 0.87 0.95 0.88 0.87 1Cc16TNAU 0.82 0.91 0.82 0.88 0.82 0.83 0.85 0.79 0.86 0.78 0.82 0.89 0.86 0.84 0.94 0.83 0.86 0.94 1Cc17TNAU 0.83 0.86 0.77 0.82 0.77 0.78 0.78 0.71 0.79 0.71 0.79 0.87 0.81 0.81 0.85 0.82 0.84 0.89 0.84 1group CCF-II (moderately virulence), with the remaining isolatesassigned to group CCF-III <strong>and</strong> CCF-IV (Cc2TNAU, Cc4TNAU,Cc5TNAU, Cc9TNAU, Cc12TNAU, Cc15TNAU, Cc16TNAU,Cc17TNAU- severely virulent isolates) (Table 2).Molecular detection of C.capsici using 5.8 ITS rDNA regionThe DNAs of all the 20 isolates of C. capsici were used in PCRwith the general primers ITS1 <strong>and</strong> ITS4 for the amplification ofthe rDNA region comprising the two noncoding internaltranscribed spacers ITS1 <strong>and</strong> ITS2 <strong>and</strong> the 5.8S rRNA gene.All isolates amplified a PCR product of approximately 590 bpof 5.8S rDNA region which depicts <strong>molecular</strong> basedconfirmation of C. capsici.R<strong>and</strong>om amplified polymorphic DNA (RAPD) analysis:A total of 20 isolates of C. capsici were tested for their geneticvariability by RAPD analysis, using 18 r<strong>and</strong>om primers. Ofthese, 10 r<strong>and</strong>om primers viz., OPA-01, OPA-02, OPA-03,OPA-05, OPA-09, OPA-13, OPA-15, OPF-01, OPF-07 <strong>and</strong>OPF-10 produce easily scorable <strong>and</strong> consistent b<strong>and</strong>ingpatterns, which were used for RAPD analysis of test isolates.The generated fingerprints were evaluated for overall clearnessof the b<strong>and</strong>ing pattern. The primers showed polymorphism<strong>and</strong> consistently produced 5 to 9 b<strong>and</strong>s of 0.3-2.4 kb, althoughmajority was below 1.2 kb. The RAPD profiles produced withthe primers OPA-02, OPA-09, OPA-13 <strong>and</strong> OPF-01 are shownin Fig. 1.The RAPD scores were used to create a data matrix to analyzegenetic relationship using the NTSYS-pc program version 2.02(Exeter Software, New York, USA) described by Rohlf (1993).A dendrogram was constructed based on Jaccard’s similaritycoefficient using the marker data from Colletotrichum isolateswith UPGMA. Analysis of the genetic coefficient matrix (Table3), derived from the scores of RAPD profile, showed thatminimum <strong>and</strong> maximum % similarities among the C. capsiciisolates were in the range of 70 to 96%, respectively. Clusteranalysis, using UPGMA, clearly separated the isolates into 4clusters (I, II, III <strong>and</strong> IV) confirming some level of genetic diversityamong the isolates of C. capsici from turmeric (Fig. 2). ClusterI consisted of only two isolates (Cg2TNAU <strong>and</strong> Cg3TNAU)with similarity coefficient of 0.69 <strong>and</strong> cluster II consisted of 2isolates (Cg1TNAU <strong>and</strong> Cc8TNAU) with the similaritycoefficient of 0.78; Cluster III consists of Cc5TNAU <strong>and</strong>Cc14TNAU with the similarity coefficient of 0.84. All theremaining isolates belonged to cluster IV, with similaritycoefficient ranges from 0.87 to 0.96. However, 30.1%polymorphism was found, indicating that all isolates used inthis study have approximately similar genetic identity. In thepresent study RAPD data failed to reveal a relationship betweenclustering in the dendrogram <strong>and</strong> in pathogenicity but all theisolates from Kerala <strong>and</strong> Karnataka were clustered into clusterIV group shows close genetic identity. However other isolateswere genetically varied with respect geographical distribution.DISCUSSIONColletotrichum capsici causing leaf spot disease of turmeric isresponsible for major economic losses in turmeric productionin India. In this study, the pathogenicity test confirmed that thespecies C. capsici was responsible for leaf spot disease ofturmeric in India. The expression of disease symptoms was335