The Unscented Kalman Filter Code
The Unscented Kalman Filter Code
The Unscented Kalman Filter Code
- No tags were found...

Create successful ePaper yourself
Turn your PDF publications into a flip-book with our unique Google optimized e-Paper software.
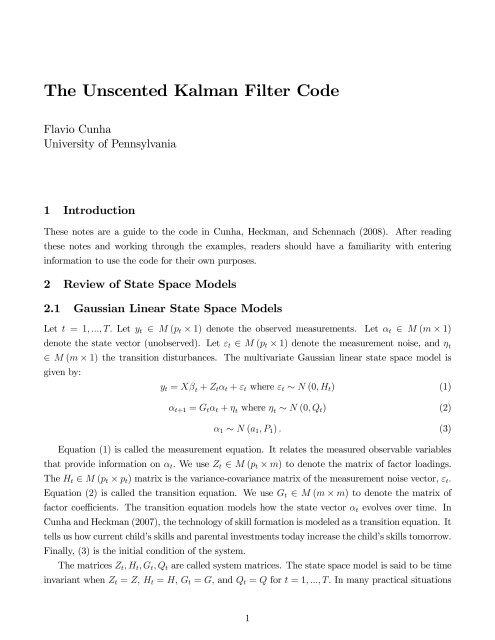
<strong>The</strong> <strong>Unscented</strong> <strong>Kalman</strong> <strong>Filter</strong> <strong>Code</strong>Flavio CunhaUniversity of Pennsylvania1 Introduction<strong>The</strong>se notes are a guide to the code in Cunha, Heckman, and Schennach (2008). After readingthese notes and working through the examples, readers should have a familiarity with enteringinformation to use the code for their own purposes.2 Review of State Space Models2.1 Gaussian Linear State Space ModelsLet t =1, ..., T. Let y t ∈ M (p t × 1) denote the observed measurements. Let α t ∈ M (m × 1)denote the state vector (unobserved). Let ε t ∈ M (p t × 1) denote the measurement noise, and η t∈ M (m × 1) the transition disturbances. <strong>The</strong> multivariate Gaussian linear state space model isgiven by:y t = Xβ t + Z t α t + ε t where ε t ∼ N (0,H t ) (1)α t+1 = G t α t + η t where η t ∼ N (0,Q t ) (2)α 1 ∼ N (a 1 ,P 1 ) . (3)Equation (1) is called the measurement equation. It relates the measured observable variablesthat provide information on α t . We use Z t ∈ M (p t × m) to denote the matrix of factor loadings.<strong>The</strong> H t ∈ M (p t × p t ) matrix is the variance-covariance matrix of the measurement noise vector, ε t .Equation (2) is called the transition equation. We use G t ∈ M (m × m) to denote the matrix offactor coefficients. <strong>The</strong> transition equation models how the state vector α t evolves over time. InCunha and Heckman (2007), the technology of skill formation is modeled as a transition equation. Ittells us how current child’s skills and parental investments today increase the child’s skills tomorrow.Finally, (3) is the initial condition of the system.<strong>The</strong> matrices Z t ,H t ,G t ,Q t are called system matrices. <strong>The</strong> state space model is said to be timeinvariant when Z t = Z, H t = H, G t = G, and Q t = Q for t =1, ..., T. In many practical situations1
the state space model can be set up as time invariant.2.2 <strong>The</strong> <strong>Kalman</strong> <strong>Filter</strong>Let p (y) =p (y 1 , ..., y T ) denote the likelihood of the model (1),(2), and (3). It is possible to estimatethe matrices Z t ,H t ,G t ,Q t by maximizing this likelihood. However, it is easier to work with theconditional likelihood:TYp (y) =p (y 1 ) p (y t | y t−1 ,...,y 1 ) . (4)t=2One can obtain the conditional likelihood by using the <strong>Kalman</strong> <strong>Filter</strong>. <strong>The</strong> idea is that, becauseof the linearity and normality of the model we are using, the likelihood p (y) is the likelihood of anormal random vector. Consequently, each term p (y t | y t−1 , ..., y 1 ) is also the likelihood of a normalrandom variable. So, to obtain this function we only need to characterize its mean and variance.<strong>The</strong> <strong>Kalman</strong> filter generates a set of recursions that given the mean and variance of y t |y t−1 , ..., y 1we obtain the mean and variance of y t+1 |y t, ..., y 1 .Definea t+1 = E [α t+1 | Y t ]P t+1 = Var[α t+1 | Y t ]Note thatE [y t+1 | X, Y t ]=Xβ t + Z t a tVar[y t+1 | X, Y t ]=Z t P t+1 Z 0 t + H t .<strong>The</strong> <strong>Kalman</strong> filter for the state space model (1)-(3) can be written in the form (Harvey, 1989):v t = y t − Z t a tF t = Z t P t Zt 0 + H tK t = P t Zt0 (5)¡ ¢a t+1 = G t at + K t Ft −1 v t¡ ¢P t+1 = G t Pt − K t Ft−1 G0t + Q t2.3 Mixture of Gaussian Nonlinear State Space ModelsMore generally, consider the model:K 0 ty t = g (X, α t )+ε t where ε t ∼ N (0,H t ) (6)α t+1 = f (α t )+η t where η t ∼ N (0,Q t ) (7)2
α 1 ∼ N (a 1 ,P 1 ) . (8)<strong>The</strong> conceptual solution of the nonlinear filtering is simple. We break the problem into aprediction and update step and then proceed recursively. <strong>The</strong> prediction step generates p (α t | y t−1 )given knowledge of p (α t−1 | y t−1 ) . This is accomplished by applying the Chapman-Kolmogorovequation:p ¡ α t | y t−1¢ Z= p (α t | α t−1 ) p ¡ α t−1 | y t−1¢ dα t−1 .where p (α t | α t−1 ) is the density of α t conditional on α t−1 . <strong>The</strong>updatestepcomputesp (α t | y t ) givenp (α t | y t−1 ) via the Bayes’ rule:p ¡ α t | y t¢ = p (y t| α t ) p (α t | y t−1 ).p (y t | y t−1 )A simple solution to the filtering problem exists when the functions g and f are linear andseparable in each of their arguments, the unobserved state α t is Gaussian, and the noise terms ε t , η tare Gaussian, independent random variables. In this case, one can use the <strong>Kalman</strong> <strong>Filter</strong> to derivethe equations used in the prediction and update steps analytically. However, simple departures ofthis framework (e.g. f is nonlinear) makes the <strong>Kalman</strong> <strong>Filter</strong> unsuitable. It is possible to adapt thisapproach by considering the first-order Taylor series approximation of the function f and then applythe standard <strong>Kalman</strong> <strong>Filter</strong> prediction and update rules. This is known in the filtering literatureas the Extended <strong>Kalman</strong> <strong>Filter</strong> (EKF). <strong>The</strong> problem with this approach is that the EKF generallygenerates biased expressions for means and variances.More recently, researchers have used general Particle <strong>Filter</strong>ing techniques. 1 However, in thecontext of panel data with a large cross-section dimension, the Particle <strong>Filter</strong> can be computationallycostly. Furthermore, the Particle <strong>Filter</strong> may not be a good tool if the goal of the researcher is toestimate the (parameters of the) functions f or g especially when these functions are time invariant.Another approach is to consider the <strong>Unscented</strong> <strong>Kalman</strong> <strong>Filter</strong> (UKF). <strong>The</strong> crucial assumption inthis algorithm is that both p (α t | y t ) and p (α t+1 | y t ) can be accurately approximated by the densityof a normal random variable with mean:a t+k,t = E ¡ α t+k | y t¢and varianceP t+k,t = Var ¡ α t+k | y t¢for k ∈ {0, 1}. Because of this assumption, the only objects that have to undergo the predictionand update steps are the means and variances of the approximating normal distribution, just as inthe standard <strong>Kalman</strong> <strong>Filter</strong> algorithm.Obviously, in some situations the normal approximation may not be a good one. It is possi-1 See, for example, [?]; [?]3
le that nonlinear functions of normally distributed random variables generate random variablesthat have densities are not symmetric around their means or with many modes, which would beinconsistent with a normal approximation. We introduce a more flexible approach which considersapproximations that use mixture of normals:p ¡ α t+k | y t¢ 'LXτ l,t φ (α t ; a l,t+k,t ,P l,t+k,t )l=1where φ (α t ; a l,t+k,t ,P l,t+k,t ) is the probability density function of a normal random variable withmean a l,t+k,t and variance P l,t+k,t , for k ∈ {0, 1}. <strong>The</strong> weights τ l,t are such that τ l,t ∈ [0, 1] andP Llτ l,t =1. Under this formulation, withineachstage,webreakthefiltering problem into parallelproblems and obtain the finalresultattheend.2.4 <strong>The</strong> Update StepIf the measurement equations are linear, then the update step is just like in the <strong>Kalman</strong> <strong>Filter</strong>.First, we compute the update density for each element of the mixture. Namely, let ŷ l,t denotethe predicted measurement by the l th element of the mixture:ŷ l,t = E l¡yt | X, Y t−1¢ = E l£g (X, αt )| X, Y t−1¤ + E l£εt | Y t−1¤ = E l£g (X, αt )| X, Y t−1¤ (9)Below, we show how to compute the moment above. For now, consider the following updatingequations:a l,t,t = a l,t,t−1 + K l,t (y t − ŷ l,t )(10a)where:andP l,t,t = P l,t,t−1 − K l,t F l,t K 0 l,tK l,t = Cov £ α t ,y t | X, y t−1¤ F −1l,tF l,t = Var £ g (X, α t )| X, Y t−1¤ + H t .(10b)(10c)(10d)We can then approximate the posterior density p (α t | Y t ) with a linear combination of densitiesφ (α t ; a l,t,t ,P l,t,t ) with weights given by:τ r,t = τ r,t−1φ (y t ;ŷ r,t ,F r,t )P Ll=1 τ ,r∈ {1,...,L} .l,t−1φ (y t ;ŷ l,t ,F l,t ) (10e)2.5 <strong>The</strong> Prediction StepWith knowledge of a good approximation for the density p (α t | Y t ) expressed as the mixture ofnormals and knowledge of the transition equation (??) one can approximately compute the onestep-aheadprediction density p (α t+1 | Y t ) also expressed as a mixture of normals. More precisely,4
let:a l,t+1,t = E l¡αt+1 | Y t¢ = E l¡f (αt )+η t+1¯¯ Y t¢ = E l¡f (αt )| Y t¢ (11)P l,t+1,t = Var l£αt+1 | Y t¤ = Var ¡ f (α t )+η t+1¯¯ Y t¢ = Var ¡ f (α t )| Y t¢ + Q t+1 (12)<strong>The</strong>n, an approximation to p (α t+1 | Y t ) is given by:p ¡ α t+1 | Y t¢ ≈LXτ l,t φ (y t ; a l,t+1,t ,P l,t+1,t ) .l=12.6 <strong>Unscented</strong> TransformAdifficulty arises in the implementation of the filtering because in the prediction and updatestages one has to compute integrals that involve nonlinear transformations of random variableswhose distributions are approximated by mixtures of normals. <strong>The</strong> <strong>Unscented</strong> Transform (UT)is a convenient tool to compute the mean and variance of a random variable that undergoes anonlinear transformation. For example, consider computing the expressions (11) and (12). <strong>The</strong>n,by definition:Za l,t+1,t = f (α t ) φ (α t ; a l,t,t ,P l,t,t ) dα t (13)ZP l,t+1,t = (f (α t ) − a l,t+1,t )(f (α t ) − a l,t+1,t ) 0 φ (α t ; a l,t,t ,P l,t,t ) dα t−1 + Q t+1 (14)<strong>The</strong> expressions (13) and (14) involve the computation of m integrals. One way to proceed is toconsider the product of quadrature rules. <strong>The</strong> difficulty with this approach is that as m becomeslarger, the number of evaluations increases exponentially.Another approach, as discussed in ([?]), is to consider monomial rules. <strong>The</strong> <strong>Unscented</strong> Transformproposed by [?] is a monomial rule that approximates the expressions (13) and (14). To do so, onepicks deterministically 2m +1points ᾱ N,l,t,t and corresponding weights w N,l,t ,n=0, 1, ..., 2m. LetP l,t,t (n, :) denote the n th row of the (m × m) matrix P l,t,t . Let κ ∈ R such that κ + m 6= 0. <strong>The</strong> UTproposes the following points x N,l,t,t :ᾱ N,l,t,t = a l,t,t for n =0.ᾱ N,l,t,t = a l,t,t + p (N α + κ) P l,t,t (n, :) for n =1, ..., m.ᾱ N,l,t,t = a l,t,t − p (N α + κ) P l,t,t (n, :) for n = N α +1, ..., 2m.(15)and the following weights w N,l,t :w l,N,t = κm+κfor n =0.w l,N,t = 12(m+κ)for n =1, ..., m.w l,N,t = 1 2(m+κ) α +1, ..., 2m.5
We approximate E l [f (α t )| Y t ] and Var l [f (α t )| Y t ] by computing:£a l,t+1,t = E l f (αt )| Y t¤ ≈and2mXn=0w l,N,t f (ᾱ N,l,t,t )P l,t,t = Var £ f (α t )| Y t¤ X2N α+ Q t ≈ w N,l,t [f (ᾱ N,l,t,t ) − a l,t+1,t ][f (ᾱ N,l,t,t ) − a l,t+1,t ] 0 + Q tn=02.7 Implementation of Nonlinear <strong>Filter</strong>ingLet p (y) denote the likelihood (4):TYp (y) =p (y 1 ) p ¡ y t | y t−1¢ . (16)t=2<strong>The</strong>ideaistousethenonlinearfiltering to obtain a recursive algorithm which we can use tocalculate p (y t+1 | y t ). To see how, note that we assume thatp (α 1 ) ≈LXτ l,0 φ (α 1 ; a l,1,0 ,P l,1,0 )l=1It follows that:LXp (y 1 ) ≈ τ l,0 φ (y 1 ;ŷ 1 ,F l,1 )l=1where ŷ 1 and F l,1 are defined in (9) and (10d). Now, by applying (10a), (10b), (10c), and (10e)allow us to obtain a l,1,1 , P l,1,1 , and τ l,1 which is really helpful because now we can characterize theposterior density as:LXp (α 1 | Y 1 ) ≈ τ l,1 φ (α 1 ; a l,1,1 ,P l,1,1 ) .l=1We then apply the prediction steps to obtain a l,2,1 and Σ l,2,1 . With knowledge of these quantities,we can approximate the predicted density as:p (α 2 | Y 1 ) ≈LXτ l,1 φ (α 2 ; a l,2,1 ,P l,2,1 ) .l=1And now we complete the cycle, because by using (9)-(10d) we can compute ŷ 2 and F l,2 , with whichwe can compute:LXp (y 2 | y 1 ) ≈ τ l,1 φ (y 2 ;ŷ 2 ,F l,2 ) .l=16
Furthermore, we use (10e) to update the weights τ l,2 . By proceeding in a recursive manner, we canconstruct the right-hand side of (16), which is just equal to the likelihood.3 <strong>Code</strong> Instructions<strong>The</strong>codeiswritteninFortran/90.Itcontainsthefollowingroutines:NameFunctionglobvar.f90 Here you define the basics of the model: Number of periods, individuals, etc...initialize.f90 Here you describe the organization of the data set you want to estimate.mappings.f90Hereyouinformthelikelihoodtheparameterstobeestimated.stdeviation.f90This routine computes standard errors.utilities.f90 This module has the UT Algorithm and specification of the functions f and gwrite_results.f90Routine that prints out estimates and standard errors.likelihood.f90It contains the routine that will call the likelihood.like_aux.f90Here you find the recursions of the <strong>Kalman</strong> <strong>Filter</strong>.matrix.f90Auxiliary routine: Matrix Inversion, etc...minimization.f90Routine that minimizes the negative of the likelihood.probability.f90 Routine that is used to evaluate the density function of the normal random variable.statistics.f90Routine that computes means, standard errors, etc...main.f90"<strong>The</strong> <strong>Code</strong>"3.1 <strong>The</strong> Module globvar.f90<strong>The</strong> globvar.f90 routine has the information you need to enter. You will say the number of individuals(nind), the number of time periods (ntime), the number of factors (nfac), the number ofmeasurement equations (nmea), the dimension of X t (nx) 2 ,andthenumberofstagesthatyouwantto estimate (nstage). <strong>The</strong> matrices G and Q can vary over time, t. If you prefer some periods tohave the same matrix G, then you can set those to be the same stages. <strong>The</strong> remaining objects inthis routine should not be changed.2 <strong>The</strong> number of observable variables in each equation at each time period can change. Here you have to informthe maximum number of observable equations you will have. For example, if you have two measurement equations,the first has 4 observable variables and the second has 5 observable variables, you should set nx =5.7
3.2 <strong>The</strong> Module initialize.f903.2.1 Reading the data set for the estimationThis routine is used to inform the code how your data is organized. However, it is important thatyou supply the data to the code in the following "long" format:person id period y 1,t x 3,t y 2,t ... y n,t dy 1,t dy 2,t ... dy n,t1 1 12 1 1 5 1 1 11 2 −100 1 1 7 0 1 11 3 11 2 −100 15 1 0 11 4 14 3 3 12 1 1 12 1 −100 4 2 9 0 1 12 2 12 3 2 12 1 1 12 3 13 3 −100 22 1 0 12 4 −100 5 0 8 0 1 1You supply that total number of variables in your data set (including the variable person id andperiod)innvar.Thisisthetotalnumberofcolumnsinyourdataset.<strong>The</strong>nameofthedatasetissupplied in "character(len=100) :: datafile=filename.raw".Next, you supply the number of measurement equation per period. This is done so becausesome measurements may be available at some periods, but not at others. In the example thatcomes ready with the code, there are six equations at each period. <strong>The</strong>n, you inform the stagenumber at each period. Here we have only one stage, which is the same for all periods.<strong>The</strong> information for the code to find the location of each measurement variable, that is, thevector y t in (1) should be entered in the vector ly, which has dimension nmea. <strong>The</strong> vector ldy hasthe location of the dy variables, which inform the code whether the value for y t for a given personis missing (in which case dy =0)ornot(dy =1).<strong>The</strong> integer-valued matrix eqindex (t, nequation(t)) informs the code the measurement equationsyou want to estimate in period t. Thisinformationmaychangewithtimeperiods,soyoushouldadjust it accordingly.<strong>The</strong> integer-valued matrix mx (t, nequation(t)) informs the code the number of explanatoryvariables that you want to include in period t and equation nequation(t). <strong>The</strong> tensor lx(t, j, mx (t, j))informs the location of each explanatory variable you want to include in period t, equation j, variablemx (t, j) .3.2.2 Imposing the normalizations in the parameter vector<strong>The</strong> second part of the routine is devoted to initializing the parameters and imposing the normalizationsyou may wish. It is here that you will specify which factor loadings (elements of the matrixZ t )thatwillbenormalized.8
Tip: When you are running a large model, it is usually a good idea to constrain thefactor loadings you want to estimate, Z t , the elements of the transition matrix, G t , andthe initial variance matrix, P 0 to some value and let the code find good initial values forthe vector β t . If you start with bad initial values, this may make the code "crash". <strong>The</strong>reason is that the last iteration of the <strong>Kalman</strong> <strong>Filter</strong>:P t+1 = G t¡Pt − K t F −1t K 0 t¢G0t + Q t<strong>The</strong> object on the left-hand side is the variance matrix (or, if it is scalar, a variance,which is a positive scalar). On the RHS, you have a subtraction. <strong>The</strong>re is no guaranteethat the resulting number will be positive. This is very likely to occur when you havebad initial values. This should not happen when you have good values for β t .3.3 <strong>The</strong> Modules mappings.f90 and stdeviation.f90<strong>The</strong>re are two routines in this module. <strong>The</strong> first one, whose name is dimtheta, simply counts thenumber of parameters to be estimated. It then informs the code the number dimtheta which is thedimension of the parameter vector theta to be estimated.<strong>The</strong> second routine, called getpar, is the routine that transforms the vector theta in the parametersas written in (1),(2), and (3), that is, the elements of the system matrices β t ,Z t ,H t ,G t ,Q t .<strong>The</strong> stdeviation.f90 module is very parallel to the mappings.f90. <strong>The</strong> difference is that mappings.f90is used for the point estimates, while the stdeviation.f90 is used, obviously, for the computationof standard errors. <strong>The</strong>re are two routines here. <strong>The</strong> first is called bootstrap and it storesthe bootstrap simulation results. <strong>The</strong> second is called standard_error and computes the standarderror of the point estimates.4 Examples4.1 Example 1To show how to use the code, consider the following example. Suppose that there are two factors,so m =2. Assume that there are two independent variables x 1 and x 2 . At each period t there arethree measures exclusively on factor α 1t :y k,t = β k,1 x 1 + β k,2 x 2 + Z k,t,1 ln α 1,t + ε k,t for k =1, 2, 3 (17)At each period t there are three measures exclusively on factor α 2t :y k,t = β k,1 x 1 + β k,2 x 2 + Z k,t,2 ln α 2,t + ε k,t for k =4, 5, 6. (18)9
As in Cunha, Heckman, and Schennach (2008) we assume that factor one needs an anchor. Let Q 1denote such anchor:Q 1 = δ 1 x 1 + δ 2 x 2 + λ 1 α 1,T + ν 1Factor one involves according to a nonlinear function:ln α 1,t+1 = 1φλ 1ln © γ 1,1 e φλ 1 ln α 1,t+ γ 1,2 e φ ln α 2,t ª + η 1,t+1 ,subject to γ 1,1 ,γ 1,2 ≥ 0 and γ 1,1 + γ 1,2 =1.Factor two involves according to a linear function:ln α 2,t+1 = γ 2,2 ln α 2,t + η 2,t+1 .This model is implemented in three folders. We generate fake data using the STATA filedata.do. <strong>The</strong> reader can read that file to see the true parameters used for the model above. Folder"LinearAnchor-V0" applies the algorithm above as stated with one exception: <strong>The</strong> anchoring parameter,λ 1 , is set at is true value. As the reader can see, the algorithm recovers the true parametersrelatively well. Folder "LinearAnchor-V1" estimates λ 1 . <strong>The</strong> fact that λ 1 is estimated has a smalleffect on the estimated parameters of the technology, both point estimates as well as standarderrors. Folder "LinearAnchor-V2" implements the algorithm above without computing the squareroot of the variance-covariance matrix, which is computationally intensive. As the reader can see,there is little effect on the estimates of the technology as well as standard errors.4.2 Example 2To show how to use the code, consider the following example. Suppose that there are three factors,so m =3, which follow exactly the equations (17) and (18) in Example 1. Factor 3 is a static one (asparental skills in Cunha, Heckman, and Schennach, 2008). We assume that there are measurementsforfactor3,α 3 , only in period one:y k,1 = β k,1 x 1 + β k,2 x 2 + Z k,1 ln α 3 + ε k,1 for k =1, 2, 3As in Cunha, Heckman, and Schennach (2008) we assume that factor one needs an anchor. Let Q 1denote such anchor:Q 1 = δ 1 x 1 + δ 2 x 2 + λ 1 α 1,T + ν 1Factor one evolves according to a nonlinear function:ln α 1,t+1 = 1φλ 1ln © γ 1,1 e φλ 1 ln α 1,t+ γ 1,2 e φ ln α 2,t+ γ 1,3 e φ ln α 3 ª + η 1,t+1 ,subject to γ 1,k ≥ 0 for k =1, 2, 3 and P 3k=1 γ 1,k =1.10
Factor two evolves according to a linear function:ln α 2,t+1 = γ 2,2 ln α 2,t + η 2,t+1 .Since Factor 3 is static, it evolves according to:α 3,t+1 = α 3,t11