the case of iganga district - Economic Policy Research Centre
the case of iganga district - Economic Policy Research Centre
the case of iganga district - Economic Policy Research Centre
- No tags were found...
You also want an ePaper? Increase the reach of your titles
YUMPU automatically turns print PDFs into web optimized ePapers that Google loves.
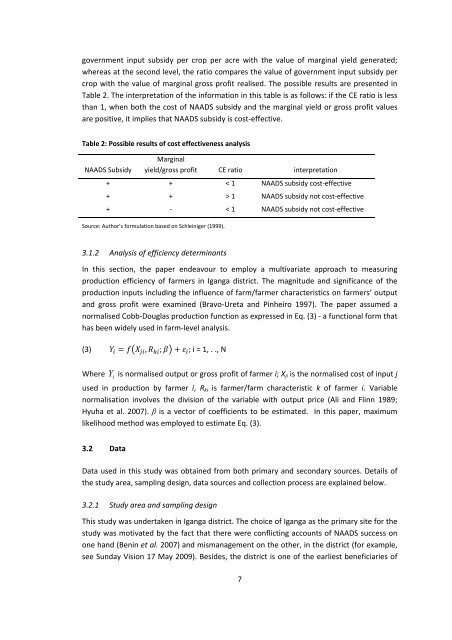
government input subsidy per crop per acre with <strong>the</strong> value <strong>of</strong> marginal yield generated;whereas at <strong>the</strong> second level, <strong>the</strong> ratio compares <strong>the</strong> value <strong>of</strong> government input subsidy percrop with <strong>the</strong> value <strong>of</strong> marginal gross pr<strong>of</strong>it realised. The possible results are presented inTable 2. The interpretation <strong>of</strong> <strong>the</strong> information in this table is as follows: if <strong>the</strong> CE ratio is lessthan 1, when both <strong>the</strong> cost <strong>of</strong> NAADS subsidy and <strong>the</strong> marginal yield or gross pr<strong>of</strong>it valuesare positive, it implies that NAADS subsidy is cost‐effective.Table 2: Possible results <strong>of</strong> cost effectiveness analysisNAADS SubsidyMarginalyield/gross pr<strong>of</strong>it CE ratio interpretation+ + < 1 NAADS subsidy cost‐effective+ + > 1 NAADS subsidy not cost‐effective+ ‐ < 1 NAADS subsidy not cost‐effectiveSource: Author’s formulation based on Schleiniger (1999).3.1.2 Analysis <strong>of</strong> efficiency determinantsIn this section, <strong>the</strong> paper endeavour to employ a multivariate approach to measuringproduction efficiency <strong>of</strong> farmers in Iganga <strong>district</strong>. The magnitude and significance <strong>of</strong> <strong>the</strong>production inputs including <strong>the</strong> influence <strong>of</strong> farm/farmer characteristics on farmers’ outputand gross pr<strong>of</strong>it were examined (Bravo‐Ureta and Pinheiro 1997). The paper assumed anormalised Cobb‐Douglas production function as expressed in Eq. (3) ‐ a functional form thathas been widely used in farm‐level analysis.(3) , ; ; i = 1, . ., NWhere Yiis normalised output or gross pr<strong>of</strong>it <strong>of</strong> farmer i; X ji is <strong>the</strong> normalised cost <strong>of</strong> input jused in production by farmer i, R ki is farmer/farm characteristic k <strong>of</strong> farmer i. Variablenormalisation involves <strong>the</strong> division <strong>of</strong> <strong>the</strong> variable with output price (Ali and Flinn 1989;Hyuha et al. 2007). β is a vector <strong>of</strong> coefficients to be estimated. In this paper, maximumlikelihood method was employed to estimate Eq. (3).3.2 DataData used in this study was obtained from both primary and secondary sources. Details <strong>of</strong><strong>the</strong> study area, sampling design, data sources and collection process are explained below.3.2.1 Study area and sampling designThis study was undertaken in Iganga <strong>district</strong>. The choice <strong>of</strong> Iganga as <strong>the</strong> primary site for <strong>the</strong>study was motivated by <strong>the</strong> fact that <strong>the</strong>re were conflicting accounts <strong>of</strong> NAADS success onone hand (Benin et al. 2007) and mismanagement on <strong>the</strong> o<strong>the</strong>r, in <strong>the</strong> <strong>district</strong> (for example,see Sunday Vision 17 May 2009). Besides, <strong>the</strong> <strong>district</strong> is one <strong>of</strong> <strong>the</strong> earliest beneficiaries <strong>of</strong>7


