the case of iganga district - Economic Policy Research Centre
the case of iganga district - Economic Policy Research Centre
the case of iganga district - Economic Policy Research Centre
- No tags were found...

Create successful ePaper yourself
Turn your PDF publications into a flip-book with our unique Google optimized e-Paper software.
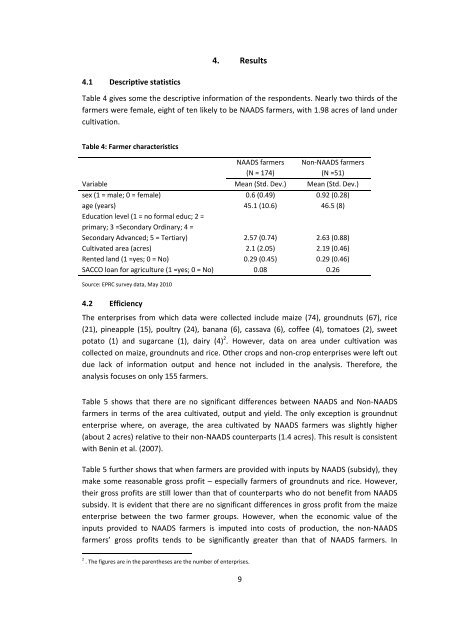
4. Results4.1 Descriptive statisticsTable 4 gives some <strong>the</strong> descriptive information <strong>of</strong> <strong>the</strong> respondents. Nearly two thirds <strong>of</strong> <strong>the</strong>farmers were female, eight <strong>of</strong> ten likely to be NAADS farmers, with 1.98 acres <strong>of</strong> land undercultivation.Table 4: Farmer characteristicsNAADS farmers(N = 174)Non‐NAADS farmers(N =51)Variable Mean (Std. Dev.) Mean (Std. Dev.)sex (1 = male; 0 = female) 0.6 (0.49) 0.92 (0.28)age (years) 45.1 (10.6) 46.5 (8)Education level (1 = no formal educ; 2 =primary; 3 =Secondary Ordinary; 4 =Secondary Advanced; 5 = Tertiary) 2.57 (0.74) 2.63 (0.88)Cultivated area (acres) 2.1 (2.05) 2.19 (0.46)Rented land (1 =yes; 0 = No) 0.29 (0.45) 0.29 (0.46)SACCO loan for agriculture (1 =yes; 0 = No) 0.08 0.26Source: EPRC survey data, May 20104.2 EfficiencyThe enterprises from which data were collected include maize (74), groundnuts (67), rice(21), pineapple (15), poultry (24), banana (6), cassava (6), c<strong>of</strong>fee (4), tomatoes (2), sweetpotato (1) and sugarcane (1), dairy (4) 2 . However, data on area under cultivation wascollected on maize, groundnuts and rice. O<strong>the</strong>r crops and non‐crop enterprises were left outdue lack <strong>of</strong> information output and hence not included in <strong>the</strong> analysis. Therefore, <strong>the</strong>analysis focuses on only 155 farmers.Table 5 shows that <strong>the</strong>re are no significant differences between NAADS and Non‐NAADSfarmers in terms <strong>of</strong> <strong>the</strong> area cultivated, output and yield. The only exception is groundnutenterprise where, on average, <strong>the</strong> area cultivated by NAADS farmers was slightly higher(about 2 acres) relative to <strong>the</strong>ir non‐NAADS counterparts (1.4 acres). This result is consistentwith Benin et al. (2007).Table 5 fur<strong>the</strong>r shows that when farmers are provided with inputs by NAADS (subsidy), <strong>the</strong>ymake some reasonable gross pr<strong>of</strong>it – especially farmers <strong>of</strong> groundnuts and rice. However,<strong>the</strong>ir gross pr<strong>of</strong>its are still lower than that <strong>of</strong> counterparts who do not benefit from NAADSsubsidy. It is evident that <strong>the</strong>re are no significant differences in gross pr<strong>of</strong>it from <strong>the</strong> maizeenterprise between <strong>the</strong> two farmer groups. However, when <strong>the</strong> economic value <strong>of</strong> <strong>the</strong>inputs provided to NAADS farmers is imputed into costs <strong>of</strong> production, <strong>the</strong> non‐NAADSfarmers’ gross pr<strong>of</strong>its tends to be significantly greater than that <strong>of</strong> NAADS farmers. In2. The figures are in <strong>the</strong> paren<strong>the</strong>ses are <strong>the</strong> number <strong>of</strong> enterprises.9