the case of iganga district - Economic Policy Research Centre
the case of iganga district - Economic Policy Research Centre
the case of iganga district - Economic Policy Research Centre
- No tags were found...

Create successful ePaper yourself
Turn your PDF publications into a flip-book with our unique Google optimized e-Paper software.
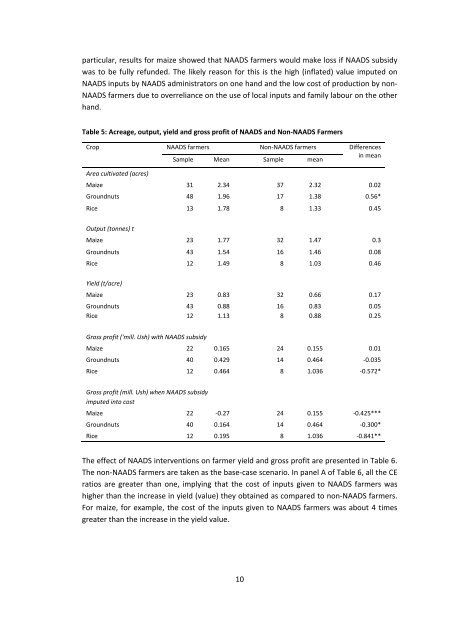
particular, results for maize showed that NAADS farmers would make loss if NAADS subsidywas to be fully refunded. The likely reason for this is <strong>the</strong> high (inflated) value imputed onNAADS inputs by NAADS administrators on one hand and <strong>the</strong> low cost <strong>of</strong> production by non‐NAADS farmers due to overreliance on <strong>the</strong> use <strong>of</strong> local inputs and family labour on <strong>the</strong> o<strong>the</strong>rhand.Table 5: Acreage, output, yield and gross pr<strong>of</strong>it <strong>of</strong> NAADS and Non‐NAADS FarmersCrop NAADS farmers Non‐NAADS farmers Differencesin meanSample Mean Sample meanArea cultivated (acres)Maize 31 2.34 37 2.32 0.02Groundnuts 48 1.96 17 1.38 0.56*Rice 13 1.78 8 1.33 0.45Output (tonnes) tMaize 23 1.77 32 1.47 0.3Groundnuts 43 1.54 16 1.46 0.08Rice 12 1.49 8 1.03 0.46Yield (t/acre)Maize 23 0.83 32 0.66 0.17Groundnuts 43 0.88 16 0.83 0.05Rice 12 1.13 8 0.88 0.25Gross pr<strong>of</strong>it ('mill. Ush) with NAADS subsidyMaize 22 0.165 24 0.155 0.01Groundnuts 40 0.429 14 0.464 ‐0.035Rice 12 0.464 8 1.036 ‐0.572*Gross pr<strong>of</strong>it (mill. Ush) when NAADS subsidyimputed into costMaize 22 ‐0.27 24 0.155 ‐0.425***Groundnuts 40 0.164 14 0.464 ‐0.300*Rice 12 0.195 8 1.036 ‐0.841**The effect <strong>of</strong> NAADS interventions on farmer yield and gross pr<strong>of</strong>it are presented in Table 6.The non‐NAADS farmers are taken as <strong>the</strong> base‐<strong>case</strong> scenario. In panel A <strong>of</strong> Table 6, all <strong>the</strong> CEratios are greater than one, implying that <strong>the</strong> cost <strong>of</strong> inputs given to NAADS farmers washigher than <strong>the</strong> increase in yield (value) <strong>the</strong>y obtained as compared to non‐NAADS farmers.For maize, for example, <strong>the</strong> cost <strong>of</strong> <strong>the</strong> inputs given to NAADS farmers was about 4 timesgreater than <strong>the</strong> increase in <strong>the</strong> yield value.10