STA 3024 Exam 1 Sample Questions
STA 3024 Exam 1 Sample Questions
STA 3024 Exam 1 Sample Questions
- No tags were found...
Create successful ePaper yourself
Turn your PDF publications into a flip-book with our unique Google optimized e-Paper software.
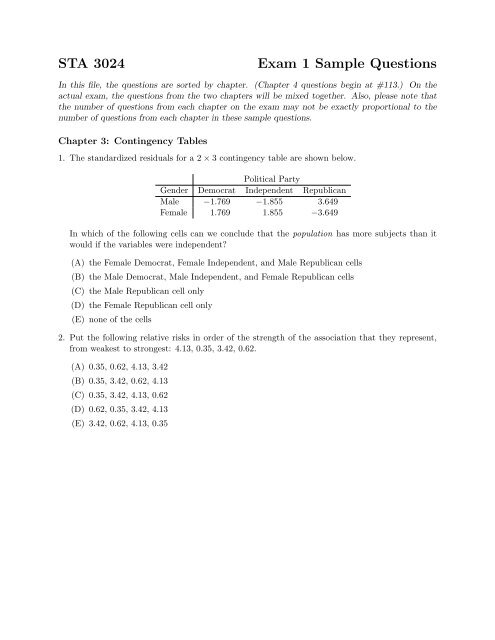
<strong>STA</strong> <strong>3024</strong><strong>Exam</strong> 1 <strong>Sample</strong> <strong>Questions</strong>In this file, the questions are sorted by chapter. (Chapter 4 questions begin at #113.) On theactual exam, the questions from the two chapters will be mixed together. Also, please note thatthe number of questions from each chapter on the exam may not be exactly proportional to thenumber of questions from each chapter in these sample questions.Chapter 3: Contingency Tables1. The standardized residuals for a 2 × 3 contingency table are shown below.Political PartyGender Democrat Independent RepublicanMale −1.769 −1.855 3.649Female 1.769 1.855 −3.649In which of the following cells can we conclude that the population has more subjects than itwould if the variables were independent?(A) the Female Democrat, Female Independent, and Male Republican cells(B) the Male Democrat, Male Independent, and Female Republican cells(C) the Male Republican cell only(D) the Female Republican cell only(E) none of the cells2. Put the following relative risks in order of the strength of the association that they represent,from weakest to strongest: 4.13, 0.35, 3.42, 0.62.(A) 0.35, 0.62, 4.13, 3.42(B) 0.35, 3.42, 0.62, 4.13(C) 0.35, 3.42, 4.13, 0.62(D) 0.62, 0.35, 3.42, 4.13(E) 3.42, 0.62, 4.13, 0.35
3. Consider the data shown in the following contingency table.Which of the following statements is true?AnswerGender Yes NoFemale 47 090Male 42 105(A) This data should be analyzed using Fisher’s exact test instead of a chi-squared test becauseFisher’s exact test is computationally easier.(B) This data should be analyzed using the test for comparing two proportions from Stats 1instead of a chi-squared test because the test for comparing two proportions will make fewertype II errors.(C) both (A) and (B)(D) neither (A) nor (B)4. When doing a chi-squared test for a contingency table with four rows, three columns, and asample size of 537, we should compare our X 2 value to a chi-squared distribution with howmany degrees of freedom?(A) 1(B) 2(C) 3(D) 4(E) 65. Which of the following is an assumption of the chi-squared test?(A) The response variable comes from a normal distribution.(B) Each cell’s observed count is at least 5.(C) both (A) and (B)(D) neither (A) nor (B)6. For the “Group I, Choice D” cell of the contingency table shown below, calculate the expectedcount that we would use when doing a chi-squared test.(A) 12.332(B) 15.598(C) 18.915(D) 22.960(E) 23.282ChoiceGroup Choice A Choice B Choice C Choice D TotalGroup I 24 27 27 19 97Group II 26 25 32 20 103Total 50 52 59 39 200
7. In a chi-squared test, which of the following directly affects the shape of the chi-squared distributionto which we compare the test statistic?(A) the number of subjects in the sample(B) the number of columns in the contingency table(C) the value of the largest expected count(D) the value of the largest standardized residual(E) the value of the largest row total8. Suppose we calculate conditional proportions for a contingency table with R rows and C columnsby dividing each cell’s observed count by its row total (i.e., what we usually do). If we add theseconditional proportions across each row, then each row sums to 1. If we instead add theseconditional proportions down each column, then(A) each column sums to something less than 1.(B) each column sums to something greater than 1.(C) each column sums to something less than 1 if R < C, sums to something greater than 1 ifR > C, and sums to 1 if R = C.(D) we can’t say anything about what each column sums to without seeing the data.9. Contingency tables are used for displaying data consisting of(A) a categorical response variable and a categorical explanatory variable.(B) a categorical response variable and a quantitative explanatory variable.(C) a quantitative response variable and a categorical explanatory variable.(D) a quantitative response variable and a quantitative explanatory variable.10. The table below shows the conditional distribution of eye color given hair color for a randomsample of 304 people.Eye ColorHair Color Brown BlueBrown 0.586 0.414Blond 0.069 0.931Calculate the sample odds ratio of brown eyes for brown-haired people vs. blond-haired people.(A) 00.517(B) 01.415(C) 03.141(D) 08.493(E) 19.098
11. The chi-squared test can provide information about(A) confidence intervals for the sample relative risk.(B) confidence intervals for the sample difference between conditional proportions.(C) the strength of the evidence of an association between two variables.(D) evidence of the strength of an association between two variables.12. In a chi-squared test with df = 6, a test statistic value of X 2 = 17.72 corresponds to a p-value(A) smaller than 0.001.(B) between 0.001 and 0.005.(C) between 0.005 and 0.010.(D) between 0.010 and 0.025.(E) between 0.025 and 0.050.13. For the contingency table shown below, calculate the difference between conditional proportionsof adults and children who answered “Agree.”(A) 0.060(B) 0.118(C) 0.159(D) 0.172(E) 0.301AnswerGroup Agree DisagreeAdults 106 150Children 57 10414. In a chi-squared test, which of the following would we usually have if the value of the test statisticX 2 is large?(A) a small p-value(B) variables that are independent(C) both (A) and (B)(D) neither (A) nor (B)15. Recall that in a contingency table, each cell’s standardized residual consists of its residual dividedby that residual’s standard error. Which of the following gives us enough information to calculatethe standard error of a cell’s residual?(A) the value of the chi-squared test statistic and the corresponding p-value(B) that cell’s observed and expected counts(C) the sample relative risk and the sample odds ratio(D) the overall total sample size and the row and column totals for that cell(E) none of the above
16. For the contingency table below, calculate the sample odds ratio of complications during surgeryfor Procedure A patients vs. Procedure B patients.(A) 0.369(B) 0.920(C) 1.033(D) 1.147(E) 1.898Surgery OutcomeProcedure Complications No Complications TotalProcedure A 8 307 315Procedure B 6 264 27017. A pizza delivery chain wants to see if there is a relationship between order type (delivery orcarryout) and the size of the pizza that is ordered. A random sample of 201 pizzas orderedyields the following contingency table:Order TypePizza Size Delivery CarryoutMedium 56 35Large 88 22In the sample, the percentage of large pizzas that were ordered for carryout is(A) 10.9%(B) 12.3%(C) 13.9%(D) 20.0%(E) 25.0%18. For the “Group III, Yes” cell of the contingency table shown below, calculate the expected countthat we would use when doing a chi-squared test.(A) 07.1(B) 12.3(C) 17.3(D) 27.5(E) 30.1ResponseGroup Yes No TotalI 19 9 28II 19 9 28III 27 20 47Total 66 37 103
19. Suppose the expected counts in Contingency Table A are identical to the expected counts inContingency Table B. The data in Table A yields a sample relative risk of 3.6, while the datain Table B yields a sample relative risk of 6.2 (calculated the same way as for Table A). Whichtable would give a larger value of the test statistic X 2 in the chi-squared test?(A) Table A(B) Table B(C) The two tables would yield the same value of X 2 .20. Which of the following data sets would be most immediately suitable for representation as acontingency table?(A)Age Cola Preference(Explanatory) (Response)39 Pepsi48 Pepsi70 Coke(B)Age Cola Consumption(Explanatory) (Response)19 42 ounces/day58 0 ounces/day51 15 ounces/day..62 Coke..26 20 ounces/day(C)Time Zone(Explanatory)CentralEasternPacificCola Preference(Response)PepsiPepsiCoke(D)Time Zone(Explanatory)CentralPacificEasternCola Consumption(Response)4 ounces/day0 ounces/day15 ounces/day.Eastern.Coke.Eastern.10 ounces/day21. A random sample of Americans is asked whether they approve or disapprove of the performanceof the President. The data is recorded in a contingency table with approve/disapprove as theresponse variable and gender as the explanatory variable. A chi-squared test on the data yieldsa p-value of 0.00004. From this, we can conclude that the percentage of all American men whoapprove(A) differs greatly from the percentage of all American women who approve.(B) differs from the percentage of all American women who approve, but we can’t concludeanything about how big the difference is.(C) differs greatly from the percentage of all American men who disapprove.(D) differs from the percentage of all American men who disapprove, but we can’t concludeanything about how big the difference is.
22. In a chi-squared test with df = 2, a test statistic value of X 2 = 4.59 corresponds to a p-value(A) between 0.010 and 0.025.(B) between 0.025 and 0.050.(C) between 0.050 and 0.100.(D) between 0.100 and 0.250.(E) larger than 0.250.23. We perform a chi-squared test with df = 3 and find a test statistic value of X 2 = 12.5. Thep-value of the test is the probability, calculated as if H 0 were true, of getting a X 2 value that is(A) greater than or equal to 12.5.(B) less than or equal to 12.5.(C) equal to 12.5.(D) between −12.5 and 12.5.(E) equal to either −12.5 or 12.5.24. A chi-squared test is conducted to determine if esophageal cancer is associated with proteinintake. The test yields a p-value of 0.37. Using a significance level of α = 0.10, we(A) reject H 0 , so we conclude that esophageal cancer depends on protein intake.(B) reject H 0 , so we conclude that it’s reasonable that esophageal cancer does not depend onprotein intake.(C) fail to reject H 0 , so we conclude that esophageal cancer depends on protein intake.(D) fail to reject H 0 , so we conclude that it’s reasonable that esophageal cancer does not dependon protein intake.25. When analyzing the strength of an association in a contingency table, a relative risk of 1.0(A) represents a stronger association than a relative risk of 0.5.(B) represents a stronger association than a relative risk of 1.7.(C) represents the same strength of association as a relative risk of 1.7.(D) corresponds to the variables being independent.(E) is impossible.26. In a chi-squared test, which of the following corresponds to a large p-value?(A) a large value of the X 2 test statistic(B) data that agrees with the null hypothesis(C) both (A) and (B)(D) neither (A) nor (B)
27. Suppose we take a random sample from some population and record the values of two variablesin a 2×2 contingency table. If the two variables are actually independent, which of the followingwill be true?(A) The observed count in the top-left cell will probably be close, but not exactly equal, to theobserved count in the top-right cell.(B) The observed count in the top-left cell will probably be close, but not exactly equal, to theobserved count in the bottom-left cell.(C) both (A) and (B)(D) neither (A) nor (B)28. When doing a chi-squared test for a 2 × 2 contingency table, we should compare our observedX 2 value to a chi-squared distribution with how many degrees of freedom?(A) 01(B) 02(C) 03(D) 04(E) 0529. We want to test for independence of the two variables in the following table:Which of the following is true?ResponseGroup Yes NoA 4 9B 9 4(A) Either the chi-squared test or Fisher’s exact test would be okay, but we would usually dothe chi-squared test since it’s computationally easier.(B) Either the chi-squared test or Fisher’s exact test would be okay, but we would usually doFisher’s exact test since it’s computationally easier.(C) The chi-squared test would be okay, but Fisher’s exact test would not.(D) Fisher’s exact test would be okay, but the chi-squared test would not.(E) Neither the chi-squared test nor Fisher’s exact test would be okay.
30. A researcher is conducting a chi-squared test with α = 0.05 to see if happiness (not happy, prettyhappy, or very happy) depends on level of income (low, medium, or high). She surveys a randomsample of 2859 people, creates a 3 × 3 contingency table, and calculates a test statistic value ofX 2 = 61.2. (Assume she has done everything correctly up to this point.) She then comparesher observed test statistic value to a chi-squared distribution with df = 4, and she determinesthat her p-value is smaller than 0.001. Since her p-value is extremely small, she concludes thatthere is a strong association between income and happiness. How did she make a mistake?(A) She should have used a smaller df when calculating the p-value.(B) She should have used a larger df when calculating the p-value.(C) She cannot necessarily conclude that the p-value is smaller than 0.001.(D) She cannot necessarily conclude that there is a strong association.(E) She did not make a mistake.31. A gas station offers three grades of gasoline: regular, plus, and premium. Plus is better thanregular, and premium is better than plus. As defined here, grade of gasoline is(A) a nominal variable.(B) an ordinal variable.32. Contingency tables are used when(A) both the explanatory and response variables are quantitative.(B) the response variable is quantitative, but the explanatory variable is categorical.(C) both the explanatory and response variables are categorical.(D) the response variable is categorical, but the explanatory variable is quantitative.33. When analyzing the strength of an association, which of the following values for the differencebetween proportions represents the same strength of association as a difference betweenproportions of −0.40?(A) −2.50(B) −0.40(C) −0.60(D) −1.40(E) none of the above34. In a chi-squared test for a contingency table with three rows and two columns, a test statisticvalue of X 2 = 9.67 corresponds to a p-value(A) smaller than 0.001.(B) between 0.001 and 0.005.(C) between 0.005 and 0.010.(D) between 0.010 and 0.025.(E) between 0.025 and 0.050.
35. In a chi-squared test, if df = 3, then a test statistic value of X 2 = 20.95 corresponds to a p-value(A) smaller than 0.001.(B) between 0.001 and 0.005.(C) between 0.005 and 0.010.(D) between 0.010 and 0.025.(E) between 0.025 and 0.050.36. A large company is performing random drug testing of its employees, and it wants to see ifthere is a difference in the frequency of drug use between supervisors and lower-level workers.A random sample of 4963 employees yields the following contingency table:Drug Test ResultsEmployee Type Passed Failed TotalSupervisors 265 2 267Lower-Level Workers 4456 240 4696Total 4721 242 4963The percentage of supervisors who failed the drug test is(A) 0.75%.(B) 0.83%.(C) 1.59%.(D) 4.88%.(E) 5.38%.37. A researcher has just used a contingency table to perform a chi-squared test, during which shecalculated a test statistic value of X 2 = 3.110. Later, she decides to be a bad researcher, andshe starts making things up. She decides to say that each subject in her sample was really 10subjects, so she makes a new contingency table that is the same as her original one, but withall the observed counts multiplied by 10. (Clearly this is completely inappropriate, but she doesit anyway.) She then redoes her entire chi-squared test from scratch using this new contingencytable. What will the value of the X 2 test statistic be when she redoes the test?(A) 3.110(B) 31.10(C) 311.0(D) none of the above38. In a chi-squared test, which of the following has a standard normal distribution when H 0 is true?(A) the observed counts(B) the expected counts(C) the row and column totals(D) the relative risk(E) the standardized residuals
39. How does Fisher’s exact test differ from the chi-squared test?(A) Fisher’s exact test is computationally easier.(B) Fisher’s exact test is used for quantitative variables instead of categorical variables.(C) both (A) and (B)(D) neither (A) nor (B)40. In a chi-squared test, when some of the observed counts differ greatly from their correspondingexpected counts, the value of the X 2 test statistic will be(A) small.(B) large.41. When doing a chi-squared test for a contingency table with three rows and four columns, weshould compare our observed X 2 value to a chi-squared distribution with how many degrees offreedom?(A) 11(B) 15(C) 16(D) 18(E) 1242. In a chi-squared test, which of the following corresponds to having data that agrees with H 0 ?(A) a large value of the X 2 test statistic(B) a small p-value(C) both (A) and (B)(D) neither (A) or (B)43. When analyzing the strength of an association, a relative risk of −0.83(A) represents a weaker association than a relative risk of −0.50.(B) represents the same strength of association as a relative risk of 0.83.(C) is close to what we would expect if the variables were independent.(D) is impossible.
44. Which of the following datasets would be most immediately suitable for representation as acontingency table?(A)Employment(Explanatory)UnemployedEmployedEmployedWeight(Response)135 pounds201 pounds345 pounds(B)Employment(Explanatory)EmployedEmployedUnemployedInsomnia(Response)NoNoYes.Employed.120 pounds.Employed.No(C)Caloric Intake Weight(Explanatory) (Response)4199 279 pounds1528 160 pounds2824 173 pounds(D)Caloric Intake Insomnia(Explanatory) (Response)1866 Yes2819 No3086 No..2437 165 pounds..2086 No45. A pizza delivery chain wants to see if there is a relationship between order type (delivery or carryout)and what type of crust people order for their pizza. Suppose that 55% of carryout ordersare for hand-tossed crust. If order type and crust type are independent, then the percentage ofdelivery orders that are for hand-tossed crust should be about(A) 25%.(B) 38%.(C) 45%.(D) 50%.(E) 55%.46. A chi-squared test is conducted to determine whether or not a person’s degree of pain reliefdepends on what dosage they take of the pain reliever naproxen. The test yields a decision toreject H 0 . Then we should(A) conclude that degree of pain relief depends on naproxen dosage.(B) conclude that it’s reasonable that naproxen dosage and degree of pain relief are independent.
47. A company is investigating the satisfaction of its customers regarding service calls that weresplit between two different call centers. A random sample of 395 calls yields the following data:Customer SatisfactionCall Center Satisfied Not Satisfied TotalSan Jose 120 19 139Toronto 241 15 256Total 361 34 395Calculate the relative risk of a customer not being satisfied with a call answered by the San Josecenter compared to the Toronto center.(A) 11.27(B) 12.33(C) 16.32(D) 11.96(E) 13.6748. Which of the following does the chi-squared test assume?(A) Each cell’s observed count is at least 5.(B) The response variable has a normal distribution.(C) both (A) and (B)(D) neither (A) nor (B)49. An Algebra 2 teacher is investigating students’ answers to a particular multiple-choice quizquestion. Specifically, she wants to see if students’ answers on this question are affected bywhich teacher they had for Algebra 1. Unfortunately, she kept sloppy records, and all theinformation available is shown in the table below, along with one additional fact: The expectedcount for the “Kemp, C” cell was 130.7.AnswerAlgebra 1 Teacher A B C D E TotalKemp 169Walton 56Total 225Calculate the expected count for the “Walton, C” cell.(A) 043.3(B) 058.5(C) 098.2(D) 112.6(E) We do not have enough information to calculate this.
50. In a chi-squared test for a contingency table, which of the following corresponds to having littleor no evidence that the response variable depends on the explanatory variable?(A) a small value of the X 2 test statistic(B) a small p-value(C) both (A) and (B)(D) neither (A) nor (B)51. Suppose we’re comparing the effectiveness of three different pain medications (aspirin, ibuprofen,and naproxen) for relieving headaches. A random sample of 204 subjects is summarized by thefollowing contingency table:ReliefMedication Yes No TotalAspirin 29 30 59Ibuprofen 86 17 103Naproxen 33 9 42Total 148 56 204Calculate the residual (not the standardized residual) for the “Aspirin, No” cell.(A) −16.2(B) −13.8(C) −11.0(D) −13.8(E) −16.252. For the data shown in the following contingency table, what is the sample difference betweenconditional proportions of seniors and juniors who passed the exam?(A) 0.39(B) 0.47(C) 0.50(D) 0.58(E) 0.82<strong>Exam</strong> ResultClass Year Pass FailSenior 99 10Junior 36 33
53. Consider the conditional distribution in the following contingency table:ResultMedication Cured Not cured TotalMedication I 74% 26% 100%Medication II 60% 40% 100%True or false: In this sample, 74% of patients who were cured took Medication I.(A) True(B) False54. Which of the following data sets would be most immediately suitable for representation as acontingency table?(A)Surgery(Explanatory)Procedure BProcedure BProcedure CRecovery Time(Response)5 days11 days4 days(B)Surgery(Explanatory)Procedure AProcedure AProcedure BAnesthesia(Response)LocalGeneralGeneral.Procedure A.11 days.Procedure A.Local(C)Age of Patient Recovery Time(Explanatory) (Response)61 17 days31 19 days56 23 days(D)Age of Patient Anesthesia(Explanatory) (Response)67 Local55 General21 Local..21 12 days..27 Local
55. We are investigating whether the presence of a certain disease is related to blood type. Supposewe could calculate the conditional distribution of disease status given blood type for the entirepopulation. In which of the following two situations would the population conditional distributionindicate that disease status and blood type are independent?Disease StatusBlood Type Present AbsentAB 3% 97%A 2% 98%B 2% 98%O 1% 99%Situation IDisease StatusBlood Type Present AbsentAB 50% 50%A 0% 100%B 50% 50%O 0% 100%Situation II(A) Situation I only(B) Situation II only(C) both Situation I and Situation II(D) neither Situation I nor Situation II56. Which of the following contingency tables would yield a larger value of the X 2 test statistic?(Note: In both tables, the expected count for each cell is 8.)ResponseGender Yes NoMale 10 6Female 6 10Table IResponseGender Yes NoMale 6 10Female 10 6Table II(A) Table I(B) Table II(C) Both tables would yield the same value of X 2 .(D) We do not have enough information to answer this question.57. A contingency table for a rather large random sample is shown below, along with the conditionaldistribution of the response variable given the explanatory variable.<strong>Exam</strong> ResultBreakfast Pass FailYes 6,410 (73%) 2,324 (27%)No 2,306 (71%) 951 (29%)A chi-squared test yields a test statistic value of X 2 = 8.02 and a p-value of 0.005. Which ofthe following is true?(A) There is evidence of a strong association between exam result and breakfast.(B) There is strong evidence of an association between exam result and breakfast.(C) both (A) and (B)(D) neither (A) nor (B)
58. A researcher conducts a chi-squared test for a contingency table with three rows. (She forgetsto tell us how many columns.) She reports a test statistic value of X 2 = 15.31 and a p-value of0.053. How many columns were in her contingency table?(A) 2(B) 3(C) 4(D) 5(E) We do not have enough information to answer this question.59. What value of the relative risk would represent the same strength of association as a relativerisk of 2.20?(A) −2.20(B) −1.20(C) −0.22(D) −0.33(E) −0.4560. A chi-squared test for a contingency table yields a p-value of 0.013. Using α = 0.05, we(A) reject H 0 , and we conclude that the variables are dependent.(B) reject H 0 , and we conclude that it’s reasonable that the variables are independent.(C) fail to reject H 0 , and we conclude that the variables are dependent.(D) fail to reject H 0 , and we conclude that it’s reasonable that the variables are independent.61. A chi-squared test for a contingency table with two rows and two columns yields a test statisticvalue of X 2 = 8.86. The p-value of the test is(A) less than 0.001.(B) between 0.001 and 0.005.(C) between 0.005 and 0.010.(D) between 0.010 and 0.025.(E) between 0.025 and 0.050.62. Suppose we intend to collect data for a 3 × 3 contingency table by taking a random sample of30 subjects. Which of the following is true?(A) The chi-squared test assumes each cell’s observed count is at least 5.(B) Even before seeing the data, we already know that this sample will be too small to satisfythe assumptions of the chi-squared test.(C) both (A) and (B)(D) neither (A) nor (B)
63. A random sample of Americans is asked whether they approve or disapprove of the performanceof the President. If people’s opinions about the President’s performance are independent ofgender, which of the following best describes what we should see in the sample?(A) The percentage of men who answer “Approve” should be close, but probably not exactlyequal, to the percentage of women who answer “Approve.”(B) The percentage of men who answer “Approve” should be exactly equal to the percentageof women who answer “Approve.”(C) The percentage of men who answer “Approve” should be close, but probably not exactlyequal, to the percentage of men who answer “Disapprove.”(D) The percentage of men who answer “Approve” should be exactly equal to the percentageof men who answer “Disapprove.”64. A pizza delivery chain wants to investigate the relationship between order type (delivery orcarryout) and order method (online or by phone). A random sample of 1201 orders nationwideis summarized by the following contingency table:Order MethodOrder Type Online Phone TotalDelivery 198 673 871Carryout 37 293 330Total 235 966 1201Calculate the percentage of carryout orders that were placed online.(A) 13.1%(B) 15.4%(C) 11.2%(D) 12.6%(E) 15.7%65. We take a random sample of 50 UF students, ask them a survey question with two responses,and record whether they are male or female. Our sample contains 22 males and 28 females, andthe conditional distributions of response given gender are shown below.Gender Response A Response B TotalMale 41% 59% 100%Female 29% 71% 100%For the “Male, Response A” cell, calculate the expected count that we would use when doing achi-squared test.(A) 7.5(B) 9.0(C) 11.0(D) 20.5
66. A previous study reported that the relative risk of complications for one surgical procedurecompared to another was 0.2. You repeat the study with the same two surgical procedures andrecord the following table of observed cell counts:Procedure Complications None TotalProcedure 1 4 76 80Procedure 2 x 160What would x need to be for our study to report a relative risk corresponding to the samestrength of association as the relative risk in the previous study?(A) 20(B) 32(C) 40(D) None of these numbers would yield a relative risk corresponding to the same strength ofassociation as the relative risk in the previous study.67. Suppose the conditional distribution of belief in life after death, given gender, for the entirepopulation looks like this:Which of the following statements is true?BeliefGender Yes No TotalFemale 81% 19% 100%Male 81% 19% 100%(A) If we took a sample from the population and did a chi-squared test, it would be impossibleto reject H 0 .(B) Gender and belief in life after death are independent.(C) It would have made more sense to instead calculate the conditional distribution of gendergiven belief in life after death.(D) None of these statements are true.68. For a table with two rows and four columns, we calculate a chi-squared test statistic value ofX 2 = 8.71. Which of the following statements about the p-value of the chi-squared test is true?(A) The p-value is less than 0.025.(B) The p-value is between 0.025 and 0.050.(C) The p-value is between 0.050 and 0.100.(D) The p-value is greater than 0.100.
69. Which of the following statements about the chi-squared test statistic, X 2 , is true?(A) Larger values of X 2 correspond to larger p-values.(B) Larger values of X 2 mean less evidence against H 0 .(C) Larger values of X 2 mean more evidence that the variables are independent.(D) If some observed counts differ greatly from their expected counts, the value of X 2 will belarge.70. A survey is conducted to investigate whether opinion on banning mandatory prayer in publicschools depends on highest level of education. A chi-squared test is performed, and thestandardized residuals for the different cells are shown below:Ban Prayer?Education Yes NoHS Dropout −6.55 6.55High School −2.99 2.99Some College 0.47 −0.47Bachelor’s Degree 6.15 −6.15Graduate Degree 7.32 −7.32Which of the following statements about these standardized residuals are true?Statement I: These standardized residuals were calculated by subtracting each cell’sexpected count from its observed count, squaring the result, and dividing by thestandard error.Statement II: In our sample, more people with graduate degrees supported banningmandatory prayer than we would have expected if the variables were independent.(A) Both Statement I and Statement II are true.(B) Statement I is true; Statement II is false.(C) Statement I is false; Statement II is true.(D) Both Statement I and Statement II are false.71. Which of the following statements about assumptions for the chi-squared test are true?Statement I: Both variables must be quantitative with a normal distribution.Statement II: Each cell’s observed count must be at least 5.(A) Both Statement I and Statement II are true.(B) Statement I is true; Statement II is false.(C) Statement I is false; Statement II is true.(D) Both Statement I and Statement II are false.
72. Suppose we want to test for independence of the two variables in the following table:Which of the following statements are true?ResponseGroup Yes NoA 10 4B 3 9Statement I: It would be okay to perform a chi-squared test with this data.Statement II: It would be okay to perform Fisher’s exact test with this data.(A) Both Statement I and Statement II are true.(B) Statement I is true; Statement II is false.(C) Statement I is false; Statement II is true.(D) Both Statement I and Statement II are false.73. Which of the following statements about the relative risk is true?(A) A relative risk of zero means that the observed cell counts for the variable values beingcompared are the same.(B) A relative risk of zero means that the conditional distributions being compared are thesame.(C) The relative risk is usually more informative than the difference between proportions if theproportions being compared are very small.(D) The relative risk can take any value between −1 and 1.74. A study is conducted to investigate the effectiveness of a new anti-nausea drug for chemotherapypatients. 30 chemotherapy patients suffering from severe nausea are divided evenly among threetreatment groups: a high dose of the drug, a low dose of the drug, or a placebo. The results areshown below.Which of the following statements are true?NauseaTreatment Yes No TotalHigh dose 4 6 10Low dose 5 5 10Placebo 6 4 10Statement I: In our sample, 40% of patients who experienced nausea had received ahigh dose of the drug.Statement II: Since these conditional distributions are different, we can conclude that,for the population, nausea relief is dependent on treatment.(A) Both Statement I and Statement II are true.(B) Statement I is true; Statement II is false.(C) Statement I is false; Statement II is true.(D) Both Statement I and Statement II are false.
75. A study is conducted to investigate whether a diet including a particular food leads to increasedincidence of cancer. The results are as follows:CancerFood Yes No TotalYes 48 752 800No x 100Suppose we calculate, for the sample, the relative risk of cancer for people who eat the foodversus people who don’t. Which of the following values of x would yield a relative risk of atleast 2?(A) 2(B) 5(C) 8(D) all of the above76. Which of the following statements about a X 2 value of zero is true?(A) A X 2 value of zero means the population conditional distributions are the same.(B) A X 2 value of zero is very unlikely, even if the variables are independent.(C) A X 2 value of zero occurs if a cell has an observed count of zero.(D) A X 2 value of zero represents very strong evidence against H 0 .77. A chi-squared test for a table with two rows and three columns yields a test statistic value ofX 2 = 24.5. Which of the following statements are true?Statement I: This X 2 value represents evidence of a very strong association betweenthe two variables.Statement II: A X 2 value this large would be very unusual if the variables are independent.(A) Both Statement I and Statement II are true.(B) Statement I is true; Statement II is false.(C) Statement I is false; Statement II is true.(D) Both Statement I and Statement II are false.
78. Suppose for simplicity that 50% of Americans are male and 50% are female, and that 40% classifythemselves as Republicans, 40% classify themselves as Democrats, and 20% classify themselves asOther. If gender and political identification are dependent, which one of the following statementsdo we know to be true?(A) 20% of Americans are male Republicans.(B) If we randomly select one American male, the probability that he will be a Republican is40%.(C) If we randomly select one American, the conditional probability that he will be a Republicangiven that he is a male is equal to the proportion of Americans who are male Republicansdivided by the proportion of Americans who are males.(D) We do not know that any of these statements is true if the variables are dependent.79. A survey with two choices is administered to a random sample of people, and the results bygender are shown below.Gender Response A Response B TotalFemale 15 35 50Male 35 15 50Total 50 50 100Calculate the value of the chi-squared test statistic. Hint: Notice that many of your steps willgive the same result for all four cells.(A) 0.64(B) 1.60(C) 4.00(D) 16.0080. In a chi-squared test, which of the following two statements are true?Statement I: If H 0 is false, the observed counts are more likely to be close to theirexpected counts than they would be if H 0 were true.Statement II: Smaller values of X 2 correspond to more evidence that the variables aredependent.(A) Both Statement I and Statement II are true.(B) Statement I is true; Statement II is false.(C) Statement I is false; Statement II is true,(D) Both Statement I and Statement II are false.
81. A survey is conducted to investigate the relationship between two variables: whether peopleclassify themselves politically as extremely liberal, moderate, or extremely conservative, andwhether they would vote for a female president. The results are shown below.Political views Would vote for female Would not TotalExtremely liberal 42 2 44Moderate 594 35 629Extremely conservative 35 10 45Total 671 47 718Calculate the residual (not the standardized residual) for the “Extremely conservative, Wouldvote for female” cell.(A) −7.05(B) −0.18(C) 0.78(D) 3.5082. For a chi-squared test on a table with six rows and three columns, what test statistic value wouldyield a p-value of exactly 0.025?(A) 20.48(B) 23.34(C) 27.49(D) 31.5383. Which one of the following statements about the chi-squared test is true?(A) The chi-squared test does not depend on which variable we call the explanatory variableand which variable we call the response variable.(B) The chi-squared test statistic has a chi-squared distribution if the alternative hypothesis istrue.(C) A large value of the chi-squared test statistic is evidence of a strong association betweenthe two variables.(D) All of these statements are true.84. Suppose that, for the whole American population, the relative risk of cancer for people who drinkcoffee compared to people who don’t drink coffee is 1.0. Which one of the following statementsis true?(A) This represents a stronger association than a relative risk of 0.5 would.(B) The number of American coffee drinkers with cancer equals the number of Americans withcancer who don’t drink coffee.(C) The number of American coffee drinkers with cancer equals the number of American coffeedrinkers without cancer.(D) Cancer and drinking coffee are independent.
85. Suppose we’re investigating the association between whether a UF student is in state or out ofstate and whether the student graduates in four years or less. We construct a 2 × 2 table thatlooks like this (with cell counts filled in):Residency Graduates in ≤ 4 years Doesn’tIn stateOut of stateNow suppose we want to use this table to show the conditional distribution of whether a studentgraduates in four years or less, given residency. Which of the following statements do we knowwill be true about this table of conditional percentages?(A) In each row, the two percentages will add up to 100%.(B) In each row, the two percentages will be equal.(C) In each column, the two percentages will add up to 100%.(D) In each column, the two percentages will be equal.86. Which of the the following two statements about relative risks are correct?Statement I: A relative risk of 0.1 represents a stronger association than a relative riskof 0.4 does.Statement II: A relative risk of 9.0 represents a stronger association than a relativerisk of 2.5 does.(A) Both Statement I and Statement II are true.(B) Statement I is true; Statement II is false.(C) Statement I is false; Statement II is true.(D) Both Statement I and Statement II are false.87. Which one of the following statements of the hypotheses for the chi-squared test is correct?(A) H 0 : Each observed count equals its expected count. H a : At least one observed count doesnot equal its expected count.(B) H 0 : At least one observed count does not equal its expected count. H a : Each observedcount equals its expected count.(C) H 0 : The variables are dependent. H a : The variables are independent.(D) H 0 : The variables are independent. H a : The variables are dependent.
88. A medicine for a certain disease can be administered in two ways: by pill or by injection. Weplan to conduct a study with two large groups of patients. Group A will receive the medicineby pill, and Group B will receive it by injection. Suppose that we actually know that whetheror not the medicine cures the disease is independent of how it is administered. Which of thefollowing statements are true?Statement I: The difference between the proportion of Group A patients who are curedand the proportion of Group A patients who are not cured will probably be close tozero.Statement II: The difference between the proportion of Group A patients who arecured and the proportion of Group B patients who are cured will probably be close tozero.(A) Both Statement I and Statement II are true.(B) Statement I is true; Statement II is false.(C) Statement I is false; Statement II is true.(D) Both Statement I and Statement II are false.89. Suppose gender and whether people think the federal income tax is too high are independent.Which one of the following statements is true for the population?(A) The percentage of males who think the tax is too high is equal to the percentage of femaleswho think the tax is too high.(B) The percentage of males who think the tax is too high is equal to the percentage of maleswho don’t think the tax is too high.(C) The percentage of males who think the tax is too high is equal to the percentage of femaleswho don’t think the tax is too high.(D) The percentage of males who don’t think the tax is too high is equal to the percentage offemales who think the tax is too high.90. One of the variables in a chi-squared test is students’ grades, represented simply by letter (A,B, C, D, or F). Which of the following statements are true?Statement I: The chi-squared test uses all the available information about this variable.Statement II: There exist alternative tests that might work better for this data.(A) Both Statement I and Statement II are true.(B) Statement I is true; Statement II is false.(C) Statement I is false; Statement II is true.(D) Both Statement I and Statement II are false.
91. A study is conducted in which headache sufferers are randomly given either aspirin or ibuprofen,and one hour later they are asked whether their pain was relieved. The results are shown in thefollowing table (some items are missing):Drug Pain relieved Pain not relieved TotalAspirin 30 86Ibuprofen 221Total 190 117 307Calculate the conditional percentage of people whose pain was relieved, given that they tookibuprofen.(A) 44%(B) 61%(C) 71%(D) We do not have enough information to calculate this conditional percentage.92. Suppose that for the entire population, 50% of women believe that the death penalty shouldbe given to everyone convicted of murder, and 50% of women do not. Which of the followingstatements do we know to be true?(A) The percentages mentioned above represent the conditional distribution of gender givendeath penalty opinion.(B) Death penalty opinion and gender are independent.(C) If we took a random sample and did a chi-squared test, all the observed counts would equaltheir expected counts.(D) None of these statements are true.93. Which of the following statements about the chi-squared test are true?Statement I: A small value of the chi-squared test statistic represents strong evidenceagainst H 0 .Statement II: If there is a strong association between the two variables, then we expectthe observed counts to be close to their expected counts.(A) Both Statement I and Statement II are true.(B) Statement I is true; Statement II is false.(C) Statement I is false; Statement II is true.(D) Both Statement I and Statement II are false.
94. Which of the following statements about Fisher’s exact test are true?Statement I: The only assumption needed for Fisher’s exact test is that the data comesfrom a random sample.Statement II: The null hypothesis for Fisher’s exact test is that the variables areindependent.(A) Both Statement I and Statement II are true.(B) Statement I is true; Statement II is false.(C) Statement I is false; Statement II is true.(D) Both Statement I and Statement II are false.95. A sample of people is asked a multiple-choice survey question. People’s responses are recordedin a table with two rows (female, male) and a column for each answer choice for the question.A chi-squared test yields a test statistic value of 14.7 and a p-value of 0.002. How many answerchoices were there for the survey question?(A) 2(B) 3(C) 4(D) 596. A chi-squared test for a table with four rows and two columns yields a test statistic value of56.9. Which of the following conclusions should we reach, and why?(A) We should conclude that the variables are independent, because there is strong evidenceagainst H 0 .(B) We should conclude that the variables are independent, because there is little evidenceagainst H 0 .(C) We should conclude that the variables are dependent, because there is strong evidenceagainst H 0 .(D) We should conclude that the variables are dependent, because there is little evidence againstH 0 .
97. Suppose we want to test for independence of the two variables in the following table:Which one of the following statments is true?AnswerGroup Yes NoA 2 10B 5 3(A) It would be okay to perform either Fisher’s exact test or a chi-squared test with this data,but we would prefer Fisher’s exact test because it is easier to compute.(B) It would be okay to perform either Fisher’s exact test or a chi-squared test with this data,but a we would prefer a chi-squared test because it is easier to compute.(C) It would be okay to perform Fisher’s exact test with this data, but not a chi-squared test.(D) It would not be okay to perform either of these two tests with this data.98. To compare the effectiveness of two medicines, a researcher takes a random sample and recordsthe subjects in the following contingency table (the counts are intentionally missing):EffectivenessMedicine Cured Not curedMedicine 1Medicine 2The researcher means to calculate the conditional distribution of effectiveness given medicine, butinstead she accidentally calculates the conditional distribution of medicine given effectiveness,as shown below:EffectivenessMedicine Cured Not curedMedicine 1 56% 59%Medicine 2 44% 41%Correct her mistake and find the conditional distribution of effectiveness given medicine. Whatis the conditional percentage of patients who were cured, given that they took Medicine 1?(A) 28%(B) 49%(C) 56%(D) 77%(E) We do not have enough information to answer this question.
99. An exit poll for the 2004 presidential election asked a sample of 345 voters whether they weremarried and which candidate they voted for. There were 127 married Bush voters, 51 unmarriedBush voters, 93 married Kerry voters, and 74 unmarried Kerry voters. (No voters in our samplevoted for any candidate other than Bush or Kerry.) For our sample, what is the conditionalpercentage of people who voted for Kerry, given that they were unmarried?(A) 42%(B) 44%(C) 59%(D) 63%(E) We do not have enough information to answer this question.100. Consider the question of whether gender is independent of voters’ decisions on whether to votefor Candidate A or Candidate B in a particular election. (No other candidates are running.) Ifthese variables are independent, then for the population of all voters, which of the following mustbe true? (Note: The population does not necessarily have equal numbers of men and women.)(A) The percentage of Candidate A voters who were men equals the percentage of CandidateA voters who were women.(B) The percentage of all voters who were men equals the percentage of all voters who votedfor Candidate A.(C) The percentage of all voters who voted for Candidate A equals the percentage of all voterswho voted for Candidate B.(D) The percentage of men who voted for Candidate A equals the percentage of men who votedfor Candidate B.(E) The percentage of men who voted for Candidate A equals the percentage of women whovoted for Candidate A.101. A study is conducted to investigate the effectiveness of a new anti-nausea drug for chemotherapypatients. A sample of 30 chemotherapy patients suffering from severe nausea is divided evenlyamong three treatment groups: a high dose of the drug, a low dose of the drug, or a placebo.The results are shown below.Which of the following is true?NauseaTreatment Yes No TotalHigh dose 4 6 10Low dose 5 5 10Placebo 6 4 10(A) Since the number of patients in the sample whose nausea was relieved is different fordifferent treatments, we can conclude that nausea relief depends on treatment.(B) Since the sample conditional percentages of nausea relief given treatment are different fordifferent treatments, we can conclude that nausea relief depends on treatment.(C) both (A) and (B)(D) neither (A) nor (B)
102. Which of the following two contingency tables provides enough information to calculate thechi-squared test statistic? (Note: There is no need to actually calculate its value.)ResponseGroup Yes No TotalGroup I 30 67 97Group IITotal 69 145ResponseGroup Yes No TotalGroup I 108Group II 8 47Total 111 155(A) the table on the left(B) the table on the right(C) both (A) and (B)(D) neither (A) nor (B)103. A random sample yields the following contingency table:ResponseGroup Yes No TotalGroup I 20 30 50Group II 90 60 150Total 110 90 200For a chi-squared test, what is the expected count for the “Group II, No” cell?(A) 56.25(B) 60.00(C) 67.50(D) 78.75(E) We do not have enough information to answer this question.104. A chi-squared test for a 2 × 2 contingency table yields a test statistic value of X 2 = 10.91. Thep-value of the test is(A) smaller than 0.001.(B) between 0.001 and 0.005.(C) between 0.005 and 0.010.(D) between 0.010 and 0.025.(E) between 0.025 and 0.050.105. A chi-squared test for a 4 × 4 contingency table yields a test statistic value of X 2 = 5.80. Whichof the following is true?(A) The p-value will be small (compared to common α levels).(B) We will reject H 0 (for common α levels).(C) The data presents strong evidence of an association between the two variables.(D) A X 2 value this larger or larger is unlikely if the variables are independent.(E) none of the above
106. A chi-squared test for a contingency table with three rows and four columns yields a p-value of0.099. Using α = 0.05, which of the following is true?(A) We reject H 0 .(B) We conclude that it is reasonable that the variables are independent.(C) both (A) and (B)(D) neither (A) nor (B)107. Assuming that both were constructed from random samples, for which of the following twocontingency tables would it be okay to perform a chi-squared test?ResponseGroup Yes No TotalGroup I 10 4 14Group II 5 11 16Total 15 15 30ResponseGroup Yes No TotalGroup I 8 2 10Group II 3 17 20Total 11 19 30(A) the table on the left(B) the table on the right(C) both (A) and (B)(D) neither (A) nor (B)108. Which of the following data sets would be most immediately suitable for representation as acontingency table?(A)Subject # Age Hair color1 22 Black2 35 Red3 26 Brown(B)Subject # Eye color Hair color1 Brown Black2 Green Red3 Brown Brown. . .n 23 Blonde...n Blue Blonde(C)Subject # Age Income1 22 $37,0002 35 $56,0003 26 $7,300(D)Subject # Eye color Income1 Brown $37,0002 Green $56,0003 Brown $7,300. . .n 23 $10,000.. .n Blue $10,000
109. For the data shown in the following contingency table, what is the sample difference betweenconditional proportions of Group I and Group II subjects whose response was Yes?(A) 0.48(B) 0.63(C) 0.69(D) 0.85ResponseGroup Yes NoGroup I 89 45Group II 20 88(E) We do not have enough information to answer this question.110. A contingency table for a rather large sample is shown below:ResponseGroup Yes No TotalGroup I 1,744 6,996 8,740Group II 1,353 4,870 6,223Total 3,097 11,866 14,963A chi-squared test yields a test statistic value of X 2 = 7.08 and a p-value of 0.008.True or false: There is strong evidence of an association between the two variables.(A) True(B) False
111. The 2000 General Social Survey collected data on people’s happiness and how often they attendedreligious services. The sample data is shown in the following contingency table:HappinessAttend Religious Services Not happy Pretty happy Very happyLess than once per month 189 908 382One to three times per month 53 311 180At least once per week 46 335 294The standardized residuals are shown in the following table:HappinessAttend Religious Services Not happy Pretty happy Very happyLess than once per month 3.899 4.393 −7.252One to three times per month −0.788 −0.227 0.763At least once per week −3.750 −4.838 7.625Identify all the cells that show evidence that the population has fewer subjects in that cell thanit would if the variables were independent.(A) At least once per week, Very happy; Less than once per month, Pretty happy; Less thanonce per month, Not happy(B) At least once per week, Very happy; Less than once per month, Pretty happy; Less thanonce per month, Not happy; One to three times per month, Very happy(C) Less than once per month, Very happy; At least once per week, Pretty happy; At leastonce per week, Not happy(D) Less than once per month, Very happy; At least once per week, Pretty happy; At leastonce per week, Not happy; One to three times per month, Not happy; One to three timesper month, Pretty happy(E) One to three times per month, Not happpy; One to three times per month, Pretty happy;One to three times per month, Very happy112. Fisher’s exact test is mainly used when sample sizes are small to examine(A) the pattern of an association.(B) confidence intervals for the relative risk.(C) whether variables are independent.(D) type I and II errors of the chi-squared test.(E) strength of an association.
Chapter 4: Nonparametric Methods113. Which of the following is an advantage of nonparametric methods over traditional methods?(A) Nonparametric methods do not assume a normal distribution for the response variable.(B) Nonparametric methods can be used when the data consists only of ranks.(C) both (A) and (B)(D) neither (A) nor (B)114. Calculate the value of the Mann-Whitney U test statistic for the data shown below.(A) 0(B) 1(C) 2(D) 3(E) 4ScoresGroup 1 13 78 009Group 2 50 29 143115. In a Mann-Whitney U test, suppose that an observation in Group 1 and an observation inGroup 2 both have a value of 12.84. We break this tie using the midrank method and calculatethe value of the test statistic U. Later, we realize that our data had actually been measured tothree decimal places instead of two, and that the previous numbers had been rounded off. Thetied observation in Group 1 actually had a value of 12.836, while the one in Group 2 actuallyhad a value of 12.837. If we recalculate our test statistic U using these more precise numbers,then our new value of U will be(A) smaller than the old value of U.(B) larger than the old value of U.(C) different from the old value of U, but we can’t say whether it would be smaller or largerwithout more information.(D) equal to the old value of U.
116. Suppose we’re doing a Mann-Whitney U test using α = 0.01 (not 0.05) for data with fourobservations in each group, and we choose a one-sided alternative hypothesis where larger teststatistic values are more supportive of the alternative. The distribution of the test statistic Ufor this case is shown below.0 2 4 6 8 10 12 14 16Our data yields a test statistic value of U = 15 and a p-value of 0.0286, so we fail to rejectH 0 . But consider what might happen with different data for this test. Which of the followingstatements is true?(A) It would be impossible for us to get data that would lead to us rejecting H 0 in this testusing α = 0.01.(B) If our data had instead yielded U = 16, the p-value still would have been 0.0286.(C) both (A) and (B)(D) neither (A) nor (B)117. Suppose we measure some quantitative response variable for a random sample of subjects in twogroups, and the data for each group contains no outliers and clearly comes from an approximatelynormal distribution. Which of the following is true?(A) We could analyze this data using the two-sample t test from Stats 1 but not the Mann-Whitney U test.(B) We could analyze this data using the Mann-Whitney U test but not the two-sample t testfrom Stats 1.(C) We could analyze this data using either the two-sample t test from Stats 1 or the Mann-Whitney U test, but we should probably choose the two-sample t test.(D) We could analyze this data using either the two-sample t test from Stats 1 or the Mann-Whitney U test, but we should probably choose the Mann-Whitney U test.118. Which of the following statements about the Mann-Whitney U test is true?(A) It assumes that we have dependent random samples from the two groups.(B) It makes fewer assumptions than the two-sample t test.(C) both (A) and (B)(D) neither (A) nor (B)
119. A Mann-Whitney U test with a two-sided alternative hypothesis yields a p-value of 0.139. Usinga significance level of α = 0.10, we(A) reject H 0 , so we conclude that the population distribution of the response variable is differentfor each group.(B) reject H 0 , so we conclude that it’s reasonable that the population distribution of the responsevariable is the same for both groups.(C) fail to reject H 0 , so we conclude that the population distribution of the response variableis different for each group.(D) fail to reject H 0 , so we conclude that it’s reasonable that the population distribution of theresponse variable is the same for both groups.120. Nonparametric tests(A) are greatly affected by outliers.(B) do not make type II errors.(C) can be used when the data consists of only rankings.(D) usually require a normal distribution.(E) do not have hypotheses.121. We want to perform the Mann-Whitney U test on the data shown below.Group 1 21 24 26 27Group 2 13 28 29 23What rank should be assigned to the observation “26” in Group 1?(A) 5(B) 6(C) 7(D) 8(E) 9122. We want to perform the Mann-Whitney U test on the data shown below.Group 1 47 47 37 36Group 2 42 43 43 43Using the midrank method, what rank should be assigned to each of the three tied observationsin Group 2?(A) 4.5(B) 5(C) 5.5(D) 5.67(E) 6
123. The measurements of some quantitative variable for random samples from two independentgroups are as follows:Group 1 42 9 38 46 37 16 39 11 11Group 2 17 13 18 31 21 22 32 26 21We want to decide whether to analyze this data using a two-sample t test, which assumes thatthe data for each group comes from a normal distribution, or the Mann-Whitney U test. Whichtest would probably be a better choice for this data?(A) the two sample t test(B) the Mann-Whitney U test124. The distribution of the test statistic U under H 0 for a certain Mann-Whitney U test is shownbelow.0 2 4 6 8 10 12 14 16The test has a one-sided alternative hypothesis, and for this particular data, larger values of thetest statistic U are more supportive of the alternative. Which of the following is true about thep-value corresponding to an observed test statistic value of U = 16?(A) It would be greater than the p-value corresponding to U = 1.(B) It would be equal to the p-value corresponding to U = 15.(C) both (A) and (B)(D) neither (A) nor (B)125. Calculate the value of the Mann-Whitney U test statistic for the data shown below. (Group 1has five observations, while Group 2 has only four.)(A) 02(B) 13(C) 17(D) 22(E) 32Group 1 7 49 56 14 21Group 2 1 37 5 3
126. Which of the following statements about nonparametric hypothesis tests is true?(A) They make slightly fewer type II errors than corresponding traditional tests when theassumptions for the traditional test are met.(B) They do not have a test statistic.(C) They do not have hypotheses.(D) They are less affected by outliers than traditional methods are.(E) In general, people are more familiar with them than with traditional tests.127. Two possible arrangements of ranks for a Mann-Whitney U test are shown below. If the nullhypothesis is true, which of these two arrangements is more likely to occur?Group 1 5 3 2Group 2 6 4 1Arrangement IGroup 1 6 2 1Group 2 5 3 4Arrangement II(A) Arrangement I is more likely.(B) Arrangement II is more likely.(C) Arrangement I and Arrangement II are equally likely.128. In circumstances where all the assumptions for traditional methods are met, which means thateither traditional or nonparametric methods could be used, which of the following is true?(A) People are more familiar with nonparametric methods than with traditional methods.(B) Nonparametric confidence interval procedures are fairly simple, but nonparametric hypothesistesting is more complicated.(C) Nonparametric hypothesis tests usually make slightly more type I errors than the correspondingtraditional hypothesis tests do.(D) Nonparametric hypothesis tests usually make slightly more type II errors than the correspondingtraditional hypothesis tests do.129. Suppose we want to use the Mann-Whitney U test to compare two groups. The response variablevalues are shown below.Group 1 13 6 7 14 18Group 2 1 3 9 19 15Calculate the value of the Mann-Whitney U test statistic. (For the step in the calculation whereyou can use either group, use Group 1.)(A) 14(B) 25(C) 29(D) 40(E) 43
130. Suppose that, in ranking observations for the Mann-Whitney U test, there is a three-way tie forthe smallest observation. According to the method recommended in class (the midrank method),what ranks should we assign to those three observations?(A) 1, 1, 1(B) 1, 1.5, 2(C) 1.5, 1.5, 1.5(D) 2, 2, 2131. Which one of the following statements about nonparametric methods is true?(A) They are not reliable when the response variable has a skewed distribution.(B) They should be avoided when the data contains outliers.(C) They are most useful when the response variable has a normal distribution.(D) They can be used when the data consists of only rankings.132. Which of the following statements about the Mann-Whitney U test is true?(A) The null hypothesis is just that the two groups have the same mean, not necessarily thesame distribution.(B) The null hypothesis is that the two groups have the same distribution.(C) It assumes a random sample and just that each group has a symmetric distribution, notnecessarily a normal distribution.(D) It assumes a random sample and that each group has a normal distribution.133. Suppose that in conducting a Mann-Whitney U test, two observations are tied for third-smallest.According to the method recommended in class (the midrank method), what ranks should beassigned to those two observations?(A) 3.5, 3.5(B) 4, 4(C) 3, 3.5(D) 3.5, 4134. Which of the following does the Mann-Whitney U test actually test?(A) whether a population has a normal distribution(B) whether two groups have the same distribution or different distributions(C) whether a population has a median of zero(D) whether the distribution of the difference scores of matched pairs data has a median of zero
135. The distribution of the test statistic U under H 0 for a certain Mann-Whitney U test is shownbelow.0 2 4 6 8 10 12 14 16The test has a one-sided alternative hypothesis, and for this particular data, larger values of thetest statistic U are more supportive of the alternative. True or false: The solid-colored regionof the distribution represents the p-value corresponding to U = 6.(A) True(B) False


