STA 3024 Practice Exam 1
STA 3024 Practice Exam 1
STA 3024 Practice Exam 1

Create successful ePaper yourself
Turn your PDF publications into a flip-book with our unique Google optimized e-Paper software.
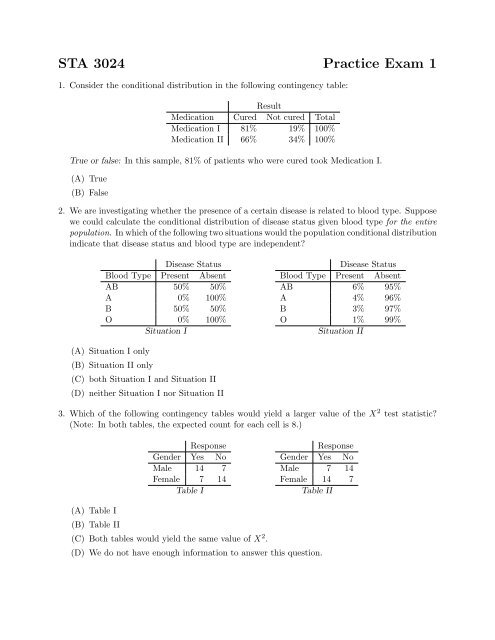
<strong>STA</strong> <strong>3024</strong> <strong>Practice</strong> <strong>Exam</strong> 11. Consider the conditional distribution in the following contingency table:ResultMedication Cured Not cured TotalMedication I 81% 19% 100%Medication II 66% 34% 100%True or false: In this sample, 81% of patients who were cured took Medication I.(A) True(B) False2. We are investigating whether the presence of a certain disease is related to blood type. Supposewe could calculate the conditional distribution of disease status given blood type for the entirepopulation. In which of the following two situations would the population conditional distributionindicate that disease status and blood type are independent?Disease StatusBlood Type Present AbsentAB 50% 50%A 0% 100%B 50% 50%O 0% 100%Situation IDisease StatusBlood Type Present AbsentAB 6% 95%A 4% 96%B 3% 97%O 1% 99%Situation II(A) Situation I only(B) Situation II only(C) both Situation I and Situation II(D) neither Situation I nor Situation II3. Which of the following contingency tables would yield a larger value of the X 2 test statistic?(Note: In both tables, the expected count for each cell is 8.)ResponseGender Yes NoMale 14 7Female 7 14Table IResponseGender Yes NoMale 7 14Female 14 7Table II(A) Table I(B) Table II(C) Both tables would yield the same value of X 2 .(D) We do not have enough information to answer this question.
4. A researcher conducts a chi-squared test for a contingency table with three rows. (She forgetsto tell us how many columns.) She reports a test statistic value of X 2 = 15.31 and a p-value of0.053. How many columns were in her contingency table?(A) 2(B) 3(C) 4(D) 5(E) We do not have enough information to answer this question.5. What value of the relative risk would represent the same strength of association as a relativerisk of 4.0?(A) −4.0(B) −3.0(C) −0.25(D) −0.25(E) −0.456. A chi-squared test for a contingency table with two rows and two columns yields a test statisticvalue of X 2 = 9.45. The p-value of the test is(A) less than 0.001.(B) between 0.001 and 0.005.(C) between 0.005 and 0.010.(D) between 0.010 and 0.025.(E) between 0.025 and 0.050.7. A pizza delivery chain wants to investigate the relationship between order type (delivery orcarryout) and order method (online or by phone). A random sample of 1201 orders nationwideis summarized by the following contingency table:Order MethodOrder Type Online Phone TotalDelivery 200 671 871Carryout 35 295 330Total 235 966 1201Calculate the percentage of carryout orders that were placed online.(A) 13.1%(B) 15.4%(C) 10.6%(D) 19.6%(E) 27.5%
8. We take a random sample of 50 UF students, ask them a survey question with two responses,and record whether they are male or female. Our sample contains 22 males and 28 females, andthe conditional distributions of response given gender are shown below.Gender Response A Response B TotalMale 41% 59% 100%Female 29% 71% 100%For the “Male, Response A” cell, calculate the expected count that we would use when doing achi-squared test.(A) 7.5(B) 9.0(C) 11.0(D) 20.59. Which of the following statements about p-values are true?Statement I: The p-value is the probability of getting a test statistic value at least asextreme as the one observed, if the null hypothesis is true.Statement II: Larger p-values indicate more evidence against the null hypothesis.(A) Both Statement I and Statement II are true.(B) Statement I is true; Statement II is false.(C) Statement I is false; Statement II is true.(D) Both Statement I and Statement II are false.10. Which of the following statements about the chi-squared test statistic, X 2 , is true?(A) Larger values of X 2 correspond to larger p-values.(B) Larger values of X 2 mean less evidence against H 0 .(C) Larger values of X 2 mean more evidence that the variables are independent.(D) If some observed counts differ greatly from their expected counts, the value of X 2 will belarge.11. A chi-squared test for a table with two rows and three columns yields a test statistic value ofX 2 = 24.5. Which of the following statements are true?Statement I: This X 2 value represents evidence of a very strong association betweenthe two variables.Statement II: A X 2 value this large would be very unusual if the variables are independent.(A) Both Statement I and Statement II are true.(B) Statement I is true; Statement II is false.(C) Statement I is false; Statement II is true.(D) Both Statement I and Statement II are false.
12. In a chi-squared test, which of the following two statements are true?Statement I: If H 0 is false, the observed counts are more likely to be close to theirexpected counts than they would be if H 0 were true.Statement II: Smaller values of X 2 correspond to more evidence that the variables aredependent.(A) Both Statement I and Statement II are true.(B) Statement I is true; Statement II is false.(C) Statement I is false; Statement II is true,(D) Both Statement I and Statement II are false.13. A survey is conducted to investigate the relationship between two variables: whether peopleclassify themselves politically as extremely liberal, moderate, or extremely conservative, andwhether they would vote for a female president. The results are shown below.Political views Would vote for female Would not TotalExtremely liberal 42 2 44Moderate 594 35 629Extremely conservative 35 10 45Total 671 47 718Calculate the residual for the “Extremely conservative, Would vote for female” cell.(A) −7.05(B) −0.18(C) 0.78(D) 3.5014. Which of the the following two statements about relative risks are correct?Statement I: A relative risk of 0.1 represents a stronger association than a relative riskof 0.4 does.Statement II: A relative risk of 9.0 represents a stronger association than a relativerisk of 2.5 does.(A) Both Statement I and Statement II are true.(B) Statement I is true; Statement II is false.(C) Statement I is false; Statement II is true.(D) Both Statement I and Statement II are false.
15. One of the variables in a chi-squared test is students’ grades, represented simply by letter (A,B, C, D, or F). Which of the following statements are true?Statement I: The chi-squared test uses all the available information about this variable.Statement II: There exist alternative tests that might work better for this data.(A) Both Statement I and Statement II are true.(B) Statement I is true; Statement II is false.(C) Statement I is false; Statement II is true.(D) Both Statement I and Statement II are false.16. A chi-squared test for a table with four rows and two columns yields a test statistic value of56.9. Which of the following conclusions should we reach, and why?(A) We should conclude that the variables are independent, because there is strong evidenceagainst H 0 .(B) We should conclude that the variables are independent, because there is little evidenceagainst H 0 .(C) We should conclude that the variables are dependent, because there is strong evidenceagainst H 0 .(D) We should conclude that the variables are dependent, because there is little evidence againstH 0 .17. For the data shown in the following contingency table, what is the sample difference betweenproportions of Group I and Group II subjects whose response was Yes?(A) 0.48(B) 0.63(C) 0.69(D) 0.85ResponseGroup Yes NoGroup I 89 45Group II 20 88(E) We do not have enough information to answer this question.18. A chi-squared test for a 2 × 2 contingency table yields a test statistic value of X 2 = 10.91. Thep-value of the test is(A) smaller than 0.001.(B) between 0.001 and 0.005.(C) between 0.005 and 0.010.(D) between 0.010 and 0.025.(E) between 0.025 and 0.050.
19. Which of the following data sets would be most immediately suitable for representation as acontingency table?(A)Subject # Age Hair color1 22 Black2 35 Red3 26 Brown(B)Subject # Eye color Hair color1 Brown Black2 Green Red3 Brown Brown. . .n 23 Blonde...n Blue Blonde(C)Subject # Age Income1 22 $37,0002 35 $56,0003 26 $7,300(D)Subject # Eye color Income1 Brown $37,0002 Green $56,0003 Brown $7,300. . .n 23 $10,000.. .n Blue $10,00020. A contingency table for a rather large sample is shown below:ResponseGroup Yes No TotalGroup I 1,744 6,996 8,740Group II 1,353 4,870 6,223Total 3,097 11,866 14,963A chi-squared test yields a test statistic value of X 2 = 7.08 and a p-value of 0.008.True or false: There is strong evidence of an association between the two variables.(A) True(B) False