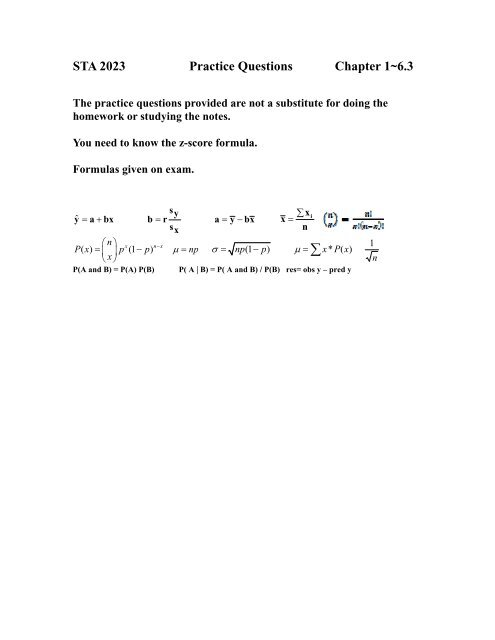
STA 2023 Practice Questions Chapter 1~6.3 - Department of ...
STA 2023 Practice Questions Chapter 1~6.3 - Department of ...
STA 2023 Practice Questions Chapter 1~6.3 - Department of ...

You also want an ePaper? Increase the reach of your titles
YUMPU automatically turns print PDFs into web optimized ePapers that Google loves.
<strong>STA</strong> <strong>2023</strong> <strong>Practice</strong> <strong>Questions</strong> <strong>Chapter</strong> <strong>1~6.3</strong>The practice questions provided are not a substitute for doing thehomework or studying the notes.You need to know the z-score formula.Formulas given on exam.s yxiyˆ a bx b r a y bx x s xnnx nx1Px ( ) p(1 p) np np(1 p) x* Px ( )xnP(A and B) = P(A) P(B) P( A | B) = P( A and B) / P(B) res= obs y – pred y
Here is a stemplot <strong>of</strong> the scores <strong>of</strong> Bob the Bowler’s last 18 bowling games, made byMinitab. Use this graph for questions 1-3Stem-and-leaf <strong>of</strong> Bowling N = 18Leaf Unit = 1.01 9 41 101 112 12 84 13 127 14 346(6) 15 1477995 16 014451. What is the best description for the shape <strong>of</strong> this graph?a) Bell/Mound-shapedb) Skewed to the leftc) Skewed to the rightd) Uniform2. Where is the center <strong>of</strong> this graph?a) Around 105b) Around 135c) Around 155d) Around 1653. Does this graph have any outliers?a) Yes, 94 is an outlierb) Yes, 165 is an outlierc) No, the numbers are too close togetherd) No, N is too small to have outliersOne semester, the TA for a math class decided to time how long it took her students to
finish their Final Exam. Below is a histogram <strong>of</strong> the results. Use this graph forquestions 4-65040Frequency30201000 15 30 45 60 75 90 105 120TestTime4. About how many students took longer than 90 minutes to finish their test?a) About 5b) About 10c) About 20d) About 1055. Where is the center <strong>of</strong> this graph?a) Between 15 and 30 minutesb) Between 45 and 60 minutesc) Between 75 and 90 minutesd) Between 105 and 120 minutes6. How will the mean and median <strong>of</strong> these test times relate, based on the graph?a) The mean will be slightly larger than the medianb) The mean will be slightly smaller than the medianc) The mean and median will be exactly equal.d) It is impossible to tell from this graphThe Gators’ Woman Basketball team has played 19 games as <strong>of</strong> 1/25/02. Here is a
<strong>Questions</strong> 21-23 use the following informationSuppose you operate a diamond mine in South Africa. The daily production <strong>of</strong> diamondsis approximately normally distributed with a mean <strong>of</strong> 7,500 tons <strong>of</strong> diamonds per daywith a standard deviation <strong>of</strong> 1,500 tons <strong>of</strong> diamonds per day.21. What is the probability that the mine produces more than 9,200 tons <strong>of</strong> diamonds in aday?a) .1292b) .8708c) .5478d) .452222. What is the probability that the mine produces between 5,400 and 8,200 tons <strong>of</strong>diamonds in a day?a) .6808b) .0808c) .60d) .761623. What is the probability that the mine produces between 4,500 and 9,000 tons <strong>of</strong>diamonds in a day?a) 68%b) 95%c) 79%d) 81.5%For questions 24 An orthopedic surgeon treats many women for back pain. Shesuspects that one common carried item, the woman’s purse, might contribute to this,especially if the purse was heavy. She sampled the purses <strong>of</strong> 44 women with back painwho were clients at the clinic and got these statistics:Variable N Mean Median TrMean StDev SE Meanpursepai 48 4485 4000 4143 2958 427Variable Minimum Maximum Q1 Q3pursepai 1500 16000 2900 487524. What can we say about the shape <strong>of</strong> this distribution by looking at the output?a) symmetricb) skewed rightc) skewed leftd) It cannot be determined from the information given.
For questions 25-26 A random sample <strong>of</strong> 40 middle-class parents is asked how muchmoney they spent on the most recent birthday gift (not including parties or celebrations)for one <strong>of</strong> their children. Their answers (in dollars) were as follows:Stem-and-leaf <strong>of</strong> giftspri N = 40Leaf Unit = 1.04 1 588811 2 1112677(10) 3 013333556819 4 1225514 5 14711 6 999 7 2256 8 474 9 03 103 11 72 12 01 13 525. “About how much money do most middle-class American parents spend on birthdaygifts for their children?”To answer this question, we would want to find this sample’s:a) meanb) medianc) varianced) standard deviation26. Which statement about the median is true?a) The median can be found in position # 21 on the stemplot.b) The median is smaller than the mean.c) The median is $36.d) The median is approximately $50.
For questions 27-30 A popular news magazine wants to write an article on how muchAmericans know about geography. They devise a test that lists 100 cities in the US, all<strong>of</strong> them mentioned in the news magazine in the last year. Each respondent must guessthe state in which the city can be found. Some examples were: (Los Angeles, Tuscon,Biloxi.) Each correct answer earns one point, for a maximum <strong>of</strong> 100. The randomsample <strong>of</strong> 5000 people had a distribution <strong>of</strong> scores that was normally distributed withmean 62 and standard deviation 12.27. The central ninety-five percent <strong>of</strong> the people in this sample can identify how manystates correctly?a) 38-86b) 50-86c) 50-74d) 26-9828. What percentage <strong>of</strong> those sampled scored between 50 and 74 points?a) 68%b) 95%c) ~ 90%d) ~ 82%29. What kinds <strong>of</strong> scores will the top 5% <strong>of</strong> people achieve?a) 78 or betterb) 81.74 or betterc) 90.25 or betterd) 98 or better30. Correctly matching 45 <strong>of</strong> 100 cities to states is considered a poor performance. Whatpercentage <strong>of</strong> respondents in this sample scored this low?a) 9.93%b) 7.78%c) 6.55%d) 5%
<strong>Questions</strong> 31-34 use the following scenario:Suppose that you have decided to buy an ice cream truck to go into the ice creambusiness this summer instead <strong>of</strong> getting a summer job. You collected data every day lastsummer while working for an ice cream company about the temperature (in °F) and sales(in dollars) for that day as a way to research for your new business. You decided to fit aregression line and get the following based <strong>of</strong>f <strong>of</strong> your dataSales = -762 + 18.53*Temperature R 2 = 47.1%31. Which <strong>of</strong> the following is the proper interpretation <strong>of</strong> the slope?a) For every one dollar increase in Sales, Temperature will increase on average by18.53 degrees.b) For every one degree increase in Temperature, Sales will increase on average by18.53 dollars.c) When the Temperature is 0 degrees, Sales will be 18.53 dollars, on average.d) When the Sales are 0 dollars, Temperature will be 18.53 degrees, on average.32. What is the correlation between these two variables?a) 0.6862944b) -0.6862944c) 0.221841d) -0.22184133. The range <strong>of</strong> the variable Temperature that you observed was 72°F - 100°F. You heara weather report saying a massive heat wave is coming your way and the high in yourtown will be 120°F tomorrow. You decide that you would like a prediction <strong>of</strong> your salestomorrow since you presume you will make so much money. You use your regressionequation to predict your sales for tomorrow and get a predicted value <strong>of</strong> $1461. Whaterror have you made?a) restricted range problemb) misinterpretation <strong>of</strong> the slope and interceptc) misuse <strong>of</strong> cause and effectd) extrapolation34. Let’s say that on July 4 the temperature outside was 90°F and you sell 1100 dollarsworth <strong>of</strong> ice cream. Which <strong>of</strong> the following is the residual for that day?a) $905.70b) -$194.30c) $194.30d) -$905.70
39. Suppose you are measuring the effect <strong>of</strong> two fertilizers, X and Y. You decide todesign an experiment that involves two plant species, A and B. In your design you decideto make it easy on the lab technician and always give plant species A fertilizer X andplant species B fertilizer Y. Which error have you made in your design?a) Confounding the Variables Effectsb) Undercoveragec) Restricted Rage Problemd) Lack <strong>of</strong> Realism40. You decide to test out a new teaching method by splitting up 10 pairs <strong>of</strong> identicaltwins into two groups, so that one <strong>of</strong> each pair <strong>of</strong> twin is in each group. You then applyyour new teaching method to the first group and the standard teaching method to thesecond group. After a six week period you give both groups a test and compare theresults on the test for each set <strong>of</strong> twins. Which <strong>of</strong> the following best describes the type <strong>of</strong>experiment that you have done?a) Matched Pairs experimentb) Observational studyc) Double Blind studyd) Simple random Sample41. Consider the following scatterplot <strong>of</strong> results <strong>of</strong> the Gator Men’s Basketball gamescores as <strong>of</strong> February 19, 2002 (with Opponent’s scores as x and Florida’s scores as y).How can you best describe the relationship between Florida’s scores and their opponent’sscores?a) There is no real relationship between xand y in this scatterplot.11010090Florida8070605050 60 70 80 90 100Opponentsa) There is no real relationship between x and y in this scatterplot.b) There is a strong, positive linear relationship between x and y.c) There is a strong, negative linear relationship between x and y.d) There is a strong, curved relationship between x and y.
For <strong>Questions</strong> 42-44, consider the following data set.A recent study was done to try to determine if a student’s grade in a class can beused to help predict the evaluation <strong>of</strong> the teacher as given by the student. Ten studentswere randomly selected from a class, and each student’s grade and overall teacherevaluation (both out <strong>of</strong> 100 points) were recorded. Minitab reports that the correlation is0.755. Here is that data:Student 1 2 3 4 5 6 7 8 9 10 mean stdevGrade 94 85 57 78 81 91 62 55 70 74 74.7 13.66Evaluation 91 88 85 77 79 95 66 60 71 72 78.4 11.3542. How would we interpret the correlation <strong>of</strong> this data?a) 75.5% <strong>of</strong> the variability in grades is explained by evaluations.b) 75.5% <strong>of</strong> the variability in evaluations is explained by grades.c) There is a fairly strong, positive linear relationship between evaluations and grades.d) There is a fairly strong, negative linear relationship between evaluations and grades.43. What is the intercept <strong>of</strong> the least squares regression line for this data?a) –0.63b) 16.33c) 31.5d) 57.044. If the data point (57, 85) were removed from the study, what would happen to theleast squares regression line?a) There would be little change since this point falls in line with the others.b) Since this point is an outlier but not influential, it would only strengthen thecorrelation <strong>of</strong> the line.c) Since this point is an outlier but not influential, it would only weaken thecorrelation <strong>of</strong> the lined) Since the point is an influential outlier, it would change the direction <strong>of</strong> theslope <strong>of</strong> the line.
For <strong>Questions</strong> 45-47, consider the following situation:Alcohol abuse researchers wanted to determine if the number <strong>of</strong> alcoholic drinksper week drunk by a successful college student had any impact on his/her studies (and inparticular, on his/her GPA). Sixty graduating seniors were selected at random and askedwhat their GPA was and how many drinks they had, per week, throughout their collegecareer. Here is Minitab’s analysis <strong>of</strong> the least squares regression line for this data:The regression equation isgpa = 3.45140 - 0.0592606 drinksS = 0.386810 R-Sq = 31.8 % R-Sq(adj) = 30.6 %Analysis <strong>of</strong> VarianceSource DF SS MS F PRegression 1 4.0444 4.04439 27.0307 0.000Error 58 8.6781 0.14962Total 59 12.722545. How would we interpret the slope <strong>of</strong> this equation?a) For each one additional drink per week, the student’s GPA should increase by.059 points, on average.b) For each one additional drink per week, the student’s GPA should decrease by.059 points, on average.c) For each 3.45 additional drinks per week, the student’s GPA should decrease by.059 points, on averaged) It is inappropriate to interpret the slope for this equation, since R 2 is so small.46. How would we interpret the intercept <strong>of</strong> this equation?a) If a student did not drink, we expect his/her GPA to be 3.45.b) If a student did not drink, we expect his/her GPA to be .059.c) If a student’s GPA was 0.0, we expect that he/she consumed 3.45 drinks perweek.d) It is inappropriate to interpret the intercept for this equation, since graduatingseniors cannot have a GPA <strong>of</strong> 0.0.47. How would we interpret R 2 for this equation?a) 31.8% <strong>of</strong> the variability in GPA is explained by the number <strong>of</strong> drinks per week.b) 31.8% <strong>of</strong> the variability in the number <strong>of</strong> drinks per week is explained by GPA.c) 31.8% <strong>of</strong> the variability in GPA cannot be explained.d) It is inappropriate to interpret R 2 for this equation, since it is so small.
48. What is the correlation between GPA and number <strong>of</strong> drinks per week?a) 0.318b) 0.564c) –0.564d) It is impossible to determine from the information given.For <strong>Questions</strong> 49-50, consider the following study:A study was conducted several years ago in the military to determine if shavingmen’s heads was effective in decreasing insubordination among new recruits. Twohundred new recruits were randomly selected, and 100 <strong>of</strong> them had their head shaved,while the other 100 were free to choose whichever hairstyle they wanted. Among the100 shaved men, six had disciplinary problems; amongst the 100 unshaved men, therewere 22 with a disciplinary problem.49. What percentage <strong>of</strong> the soldiers had disciplinary problems in this study?a) 6/100 b.) 22/100 c.) 28/200 d) 100/20050. This study is an example <strong>of</strong> a(n):a) experimentb) observational studyc) surveyd) None <strong>of</strong> the above
<strong>Questions</strong> 54-56 EasyCar Used Vehicles is analyzing the effectiveness <strong>of</strong> its advertisingstrategy to see if it can improve car sales. The dealer kept a record <strong>of</strong> how manytelevision ads she placed each week, along with the number <strong>of</strong> cars sold in that sameweek. Below is the fitted line plot <strong>of</strong> the data:Regression PlotY = 12.2197 + 0.711579XR-Sq = 51.6 %40cars sold3020100 10 20 30ads placed54. Which <strong>of</strong> the following are true statements that characterize the unusualobservation(s) in this scatterplot?I.The point at (33, 40) is an influential outlier.II. The observation at (4,32) has a large residual.III. The point at (4, 32) is an outlier.a) only Ib) only IIIc) II and IIId) I, II, and III55. Consider the observation at (4, 32). Which sentence below could be true about thatweek?a) Since so few cars were sold, we might guess that the ads were ineffective.b) The dealer placed many ads that week, so it makes sense that she sold many cars.c) Although few ads were placed that week, sales were highly successful.d) The dealer may have placed the advertisements on the wrong channel that week.56. Which statement describes the overall relationship between these two variables?a) There is a moderate, positive correlation.b) The relationship is strong and negative.c) The relationship is weak but positive.d) There is no linear relationship between these two variables.
57. The time <strong>of</strong> day and the channel <strong>of</strong> broadcast are examples <strong>of</strong>:a) Explanatory variablesb) Lurking variablesc) Response variablesd) Influential variables<strong>Questions</strong> 58-61 A recent news article by the Associated Press reports that, “too littlesleep – or too much – may raise the risk <strong>of</strong> developing heart disease, according to a study<strong>of</strong> nearly 72,000 nurses.” Compared to those who average eight hours <strong>of</strong> sleep a night,women who sleep five or less hours were 39 percent more likely to develop heart disease,while those who sleep nine or more hours had a 37 percent higher risk. “Researcherscould not explain the findings, but suggested those women might have slept morebecause <strong>of</strong> underlying illnesses.”Match each <strong>of</strong> the following with the corresponding elements <strong>of</strong> the study.58. response variable: _____ a) nurses59. explanatory variable: _____ b) average number <strong>of</strong> hours <strong>of</strong> sleep60. lurking variable: _______ c) underlying illnesses61. experimental units: _______ d) risk <strong>of</strong> heart disease62. Based on the information above, we can say that the relationship between theexplanatory and response variables for this data is:a) Weakb) linearc) curvedd) causal<strong>Questions</strong> 63-66 Can aspirin help prevent heart attacks? The Physician’s Health Studyinvolved a group <strong>of</strong> 22,000 male physicians in answering this question. Half <strong>of</strong> thedoctors (11,000) took an aspirin tablet a day, while the rest took a placebo. After 4years, those who received aspirin had significantly fewer heart attacks than those whotook no aspirin.63. What are the experimental units in this scenario?a) Heart attacksb) Aspirin and Placeboc) Yearsd) Doctors
64. How many factors are there?a) one, with two levelsb) two, with one level eachc) 22,000 with two levelsd) 11,000 with one level each65. What are the treatments?a) Heart attacksb) Aspirin and Placeboc) Yearsd) Doctors66. What is the response variable?a) Heart attacksb) Aspirin and Placeboc) Yearsd) Doctors<strong>Questions</strong> 67-70 Rogaine is a pharmaceutical product developed by Upjohn, which isadvertised as "The only product ever proven to regrow hair." Advertisements in nationalmagazines outline the results <strong>of</strong> clinical tests, in which 347 women with diffuse hair losswere randomly assigned to use either Rogaine or a placebo (a similar solution without theactive ingredient.) To avoid biasing the results, patients were not aware <strong>of</strong> which productthey were using. The product was applied by rubbing it into clean, dry scalp twice a day.After 8 months participants reported whether they had experienced moderate, minimal or nohair regrowth. The following table contains the data:67. What are the experimental units?a) womenb) women with hair lossc) men and women with hair lossd) men with hair losse) AmericansRegrowth Moderate Minimal None TotalRogaine 33 70 72 175Placebo 12 57 103 172Total 45 127 175 347
68. If those 347 people were a random sample, we could extend the conclusions <strong>of</strong> this studyto:a) all women with diffuse hair lossb) all adults with hair lossc) all people who participated in the studyd) all people who use Rogaine69. We include a placebo group in this experiment to account for the reported hair regrowththat can be attributed to:a) the physiological effect <strong>of</strong> rubbing your head twice a day, which may stimulate thescalp.b) the psychological effect <strong>of</strong> participating in a study and being more aware <strong>of</strong> smallchanges.c) the desire <strong>of</strong> all participants to see some hair regrowth, whether real or imagined.d) all <strong>of</strong> the above.70. This is an example <strong>of</strong>:a) a blind, controlled experimentb) a stratified, convenience samplec) an biased, observational studyd) a multistage, randomized design<strong>Questions</strong> 71-72 A researcher wishes to study how the average weight Y (in kilograms)<strong>of</strong> children changes during the first year <strong>of</strong> life. He plots these averages versus the age X(in months) and decides to fit a least squares regression line to the data with X as theexplanatory variable and Y as the response variable. He computes the followingquantities.r= 0.9 x 6.5 y 6.6 sx 3.6 sy 1.271. The slope <strong>of</strong> the line isa) 0.30b) 0.88c) 1.01d) 3.072. What is the fraction <strong>of</strong> variation <strong>of</strong> weight <strong>of</strong> children during their first year that isexplained by their age in months?a) 0.33b) 0.81c) 0.90d) 0.95
73. Which <strong>of</strong> the following is a true statement about probabilities?a) A Probability can be negative.b) Probabilities must be less than one halfc) A probability can not be greater than 1.d) You can never have a probability <strong>of</strong> 0.74. Why do we use inferential statistics?a) to help explain the outcomes <strong>of</strong> random phenomenab) to make informed predictions about parameters we don’t knowc) to describe samples that are normal and large enough (n>30)d) to generate samples <strong>of</strong> random data for a more reliable analysis75. Parameters and statistics…a) Are both used to make inferences about xb) Describe the population and the sample, respectively.c) Describe different groups <strong>of</strong> individuals.d) Describe the same group <strong>of</strong> individuals.<strong>Questions</strong> 76-77. The probability that any one <strong>of</strong> the incandescent lights in Norman Hallis not working is 0.10. There are 8 lights in Norman Hall. Assume that the lights areindependent.76. What is the probability that all <strong>of</strong> the lights are working?a.) 0.4305b.) 0.5965c.) 0.00000001d.) 0.999977. What is the probability that at least one <strong>of</strong> the lights is not working?a.) 0.4305b.) 0.5695c.) 0.00000001d.) 0.9999
<strong>Questions</strong> 78-79 Recent studies have shown that 20% <strong>of</strong> Americans are fit the medicaldefinition <strong>of</strong> obese. A nutrition pr<strong>of</strong>essor would like to study the percentage <strong>of</strong> studentson campus that are obese. Suppose that the percentage <strong>of</strong> students that are obese at UF isthe same as the percentage <strong>of</strong> Americans. Let X equal the number <strong>of</strong> students that areobese.78. She takes a random sample <strong>of</strong> 10 teenagers. What is the distribution <strong>of</strong> X?a.) X~Binomial(10, 0.2)b.) X~Normal (10, 0.2)c.) X~Normal (2, 1.27)d.) X~ Normal (0.2, 0.126)79. What is the probability that one <strong>of</strong> the people in her sample <strong>of</strong> 10 is obese?a.) 0b.) 0.10734c.) 0.268435d.) 0.375809Question 80-82 Suppose 20 donors come to a blood drive. Assume that the blood donorsare not related in any way, so that we can consider them independent. The probabilitythat the donor is O- blood is 0.06, which is constant from donor to donor. Let X = thenumber <strong>of</strong> donors that have O- blood.80. What is the distribution <strong>of</strong> X?a.) X~Binomial(20, 0.06)b.) X~Normal (1.2, 1.06)c.) X~Normal (0.06, 0.0531)d.) Can’t be determined81. What is the probability that two donors have type O- blood?a.) 0.225b.) 0.290c.) 0.370d.) 0.88582. What is the probability that 1 or more donors have type O- blood?a.) 0.290b.) 0.370c.) 0.630d.) 0.710
<strong>Questions</strong> 83-86 For a sales promotion the manufacturer places symbols under the caps<strong>of</strong> 10% <strong>of</strong> all Pepsi bottles. You buy 6 random bottles <strong>of</strong> Pepsi. Assume that the bottlesare independent.83. What is the probability that all <strong>of</strong> the bottles have the winning symbols?a.) 0.10 6b.) 0.90 6c.) 1-.90 6d.) 1-.10 684. What is the probability that none <strong>of</strong> the bottles have a winning symbol?a.) 0.10 6b.) 0.90 6c.) 1-.90 6d.) 1-.10 685. What is the probability that at least one <strong>of</strong> the bottles has a winning symbol?a.) 0.10 6b.) 0.90 6c.) 1-.90 6d.) 1-.10 686. What is the probability that at least one <strong>of</strong> the bottles does not have a winningsymbol?a.) 0.10 6b.) 0.90 6c.) 1-.90 6d.) 1-.10 6
<strong>Questions</strong> 87 -90 It is though that the number <strong>of</strong> damaged cans in a boxcar shipment (Y)is a function <strong>of</strong> the speed <strong>of</strong> the boxcar (X) upon impact. The speed <strong>of</strong> the boxcar goesfrom 0 to 16 ft/s. The summary statistics <strong>of</strong> thirteen (13) boxcars appears below.x 4.615, y 71. 8 , S 1. 895, S 42. 9 , r 0. 522xy87. For now let’s say the slope is an arbitrary positive number k. How do we interpret theslope for this regression equation?a) The slope is the number we get from plugging the numbers into the equation.b) For every one unit increase in the speed <strong>of</strong> the boxcars, the number <strong>of</strong> damaged cansdecreases by k.c) For every one unit increase in the speed <strong>of</strong> the boxcars, the number <strong>of</strong> damaged cansincreases by k.d) There is not enough information to answer this question.88. Compute the actual slope.a) 42.9b) 22.6c) 11.8d) 15.6e) -11.889. The y-intercept for this equation is 17.343, can this be interpreted given the context <strong>of</strong>the problem?a) Yes, it turns out that when we have a speed <strong>of</strong> 0 from the boxcar, we have about 17damaged cans.b) Yes, it turns out that when we have a speed <strong>of</strong> 0 from the boxcar, we have about 72damaged cans.c) No, there is no such thing as a speed <strong>of</strong> 0, we cannot interpret the y-intercept.d) There is not enough information to answer this question.90. A different set <strong>of</strong> data was used and they have a different regression equation <strong>of</strong>Yˆ 25.3 12.6X , compute the predicted number <strong>of</strong> damaged cans in the boxcar for aspeed <strong>of</strong> 15.a) 15b) 12.6c) 25.3d) 214.3
<strong>Questions</strong> 91 – 93 A popular fashion magazine has just recently published a poll sayingthat 45% <strong>of</strong> women who, if given the chance, would want to marry their first boyfriend.A random sample <strong>of</strong> 20 women from across the United States was taken. Answer thefollowing questions.91. This is clearly a binomial experiment. Which <strong>of</strong> the following is not a property <strong>of</strong> theBinomial?a) The observation for each woman is independent, since the women were randomlysampled.b) Each woman has the same probability they would like to marry their first boyfriend(45%).c) Each woman in the survey has based their response upon another woman’s response.d) There is not enough information to answer this question.92. What is the probability that half <strong>of</strong> the women sampled would like to marry their firstboyfriend?a) 0.4500b) 0.1593c) 0.5513d) 0.6312e) Not enough information to answer this question.93. Let’s say we increased our sample to 100 women, what is the expected number <strong>of</strong>women in this new sample that would say that they would like to marry their firstboyfriend?a) 45b) 55c) 65d) 75e) 35
<strong>Questions</strong> 94-95 When parking a car in a downtown parking lot, drivers pay according tothe number <strong>of</strong> hours. The probability distribution for the number <strong>of</strong> hours a car is parkedhas been given below:x 1 2 3 4 5 6 7 8P(x) 0.24 0.18 0.13 0.10 0.07 0.04 0.04 0.2094.What is the probability that a car will be parked in this parking lot for at least 6 hours?a) 0.04b) 0.28c) 0.24d) 0.10e) 0.1895.What is the expected number <strong>of</strong> hours a given car will be parked in the parking lot?a) 3.86b) 2.84c) 5.63d) 10.23e) 4.5296.The data set below gives the length <strong>of</strong> a bear in inches and the weight <strong>of</strong> the bear inpounds. Without calculating the value <strong>of</strong> r, what is the linear correlation coefficientbetween length and weight?a) r=.92 poundsb) r=.92 inchesc) r= 9.2d) None <strong>of</strong> the aboveLengthWeight45 6547.5 7057 7497.If we divide the length <strong>of</strong> the bears by 12 so that the length is now in feet, will thelinear correlation coefficient between length and weight change?a) yes, it will changeb) no, it will not changec) not enough informationd) maybe it will change
98.Which <strong>of</strong> these statements is false?a) A parameter, in practice, is an unknown number describing the population.b) A statistic is used to estimate an unknown parameter.c) A parameter is used to estimate an unknown statistic.d) Statistics can change from sample to sample.99.For X~N(1, 12), find the probability P(X=5).a) 0b) .1c) .01d) .98100.The length <strong>of</strong> human pregnancies is approximately normal with mean 266 days andstandard deviation 16 days. How short are the shortest 2.5% <strong>of</strong> all pregnancies?a) less than 234.64b) less than 203.28c) less than 244.4d) less than 255.2101. A player flips two fair coins and counts the number <strong>of</strong> heads. We must find theprobability distribution for X={number <strong>of</strong> heads}. What should the value <strong>of</strong> “Q” be tocomplete the probability distribution?X P(x)0 .251 Q2 .25a) .5 b) .25 c) .05 d) 1102.Which <strong>of</strong> the following is/are true about a skewed right distribution with extremeoutliers?I) The mean is greater than the medianII) The median should be used as the measure <strong>of</strong> center because it is moreresistant to extreme observations than the meanIII) The standard deviation should be used as the measure <strong>of</strong> spreadbecause it is more resistant to extreme observations than the range orinter-quartile rangea) I and II onlyb) I and III onlyc) II onlyd) I, II, and III
103.Suppose a survey <strong>of</strong> US adults reports a correlation <strong>of</strong> r=0.92 between the amount <strong>of</strong>junk food a person consumes and their weight. Which <strong>of</strong> the following can we say aboutthe results?a) III onlyb) I and III onlyc) I and II onlyd) I, II, and IIII) That the junk food causes weight gainII) That the results are from an experimentIII) That there is a strong positive linear relationship between the amount<strong>of</strong> junk food a person consumes and their weight104.A study investigated the relationship between the number <strong>of</strong> hours <strong>of</strong> sleep that aperson got the night before and their response time(in seconds) on a manual dexteritytest. The correlation coefficient was equal to 0.7183 and the least squares regressionequation was response time=12.22+0.71hours. What <strong>of</strong> the statements below is a truestatement?a) That 71.1579% <strong>of</strong> the variability in the number <strong>of</strong> hours slept is explained byresponse timeb) That 71.1579% <strong>of</strong> the variability in response time is explained by the number <strong>of</strong>hours sleptc) That 51.6% <strong>of</strong> the variability in the number <strong>of</strong> hours slept is explained by responsetimed) That 51.6% <strong>of</strong> the variability in response time is explained by the number <strong>of</strong> hoursslept105.Which <strong>of</strong> the following is/are true about a normal distribution?a) If the same area is shaded in the lower tail and in the upper tail, the probabilities<strong>of</strong> the lower and upper tail are equal.b) The mean is equal to the medianc) It is a continuous distributiond) All <strong>of</strong> the above are true
110.Phlebotomists(those who draw blood for analysis) at the NW 12 Street blood plasmadonation center have found that 15% <strong>of</strong> their donors eat more than three cookiesfollowing their plasma donation. On a given day, 13 donors give plasma. What is theprobability that less than two <strong>of</strong> the day's donors will eat more than three cookies afterthey donate blood plasma?a) .398b) .692c) .121d) .277111.The University <strong>of</strong> Florida’s zip code is 32612, is this a categorical or quantitativevariable?a) Categoricalb) Quantitativec) Neither112. Gubernatorial candidates Charlie Crist and Jim Davis each roll a die. Let therandom variable X be the sum <strong>of</strong> the numbers on the two dice. Below is the probabilitydistribution for all possible sums <strong>of</strong> the rolls <strong>of</strong> the dice. What is the missing probability?X=2 X=3 X=4 X=5 X=6 X=7 X=8 X=9 X=10 X=11 X=121/36 1/18 1/12 1/9 1/6 5/36 1/9 1/12 1/18 1/36a) 1/36b) 4/36c) 5/36d) 7/36113.A bored student during class flips a fair coin 5 times. Assuming the flips areindependent. What is the probability he gets exactly 3 heads and 2 tails?a) ½b) ¾c) 5/16d) 5/64114. In a large class, the instructor ran a regression with the independent variable(x) asthe grade on the first exam and the dependent variable(y) being the grade on the secondexam. She found the equation to be: yˆ 29.25 0. 57x.Knowing that your friend got a 78 on the first exam, what value would you predict shegot on the second exam?a) 73.71b) 72.57c) 78.00d) 71.43
115. Suppose during practice Shaq shoots 50 free-throws and he makes a free-throw 70%<strong>of</strong> the time. (Assume that each free-throw is independent <strong>of</strong> any other free-throw.) Let Xbe the number <strong>of</strong> free-throws Shaq makes during practice. What is the distribution <strong>of</strong> X?a) X ~ Normal (0.7,50)b) X ~ Binomial(50,0.7)c) X ~ Binomial(0.7,50)d) Can’t be determined from the given information116.Suppose that a new scoring system for universities was created which has a scale <strong>of</strong>0-100. The scores on scoring system are normally distributed with a variance <strong>of</strong> 100. Ifthe average score for universities is a 65, what score would the University <strong>of</strong> Florida needto have in order to be in the top 10% <strong>of</strong> universities?a) 95.1 or moreb) 62.1 or morec) 75.1 or mored) 77.8 or more