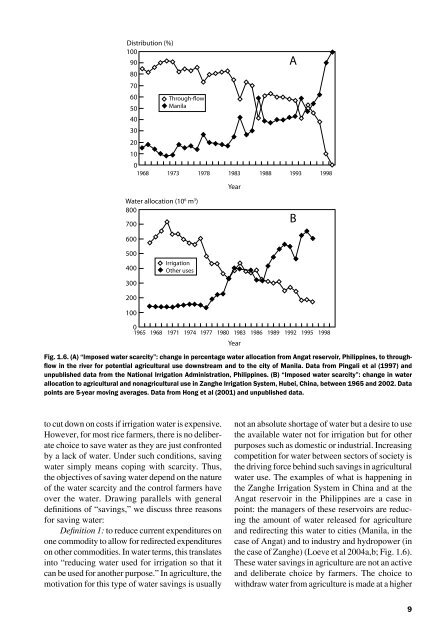
Distribution (%)100908070605040302010Through-flowManila01968 1973 1978 1983 1988 1993 1998YearA<strong>Water</strong> allocation (10 6 m 3 )800700B600500400300IrrigationOther uses20010001965 1968 1971 1974 1977 1980 1983 1986 1989 1992 1995 1998Fig. 1.6. (A) “Imposed water scarcity”: change <strong>in</strong> percentage water allocation from Angat reservoir, Philipp<strong>in</strong>es, to throughflow<strong>in</strong> the river for potential agricultural use downstream and to the city of Manila. Data from P<strong>in</strong>gali et al (1997) andunpublished data from the National Irrigation Adm<strong>in</strong>istration, Philipp<strong>in</strong>es. (B) “Imposed water scarcity”: change <strong>in</strong> waterallocation to agricultural and nonagricultural use <strong>in</strong> Zanghe Irrigation System, Hubei, Ch<strong>in</strong>a, between 1965 and 2002. Datapo<strong>in</strong>ts are 5-year mov<strong>in</strong>g averages. Data from Hong et al (2001) and unpublished data.Yearto cut down on costs if irrigation water is expensive.However, for most <strong>rice</strong> farmers, there is no deliberatechoice to save water as they are just confrontedby a lack of water. Under such conditions, sav<strong>in</strong>gwater simply means cop<strong>in</strong>g with scarcity. Thus,the objectives of sav<strong>in</strong>g water depend on the natureof the water scarcity and the control farmers haveover the water. Draw<strong>in</strong>g parallels with generaldef<strong>in</strong>itions of “sav<strong>in</strong>gs,” we discuss three reasonsfor sav<strong>in</strong>g water:Def<strong>in</strong>ition 1: to reduce current expenditures onone commodity to allow for redirected expenditureson other commodities. In water terms, this translates<strong>in</strong>to “reduc<strong>in</strong>g water used for irrigation so that itcan be used for another purpose.” In agriculture, themotivation for this type of water sav<strong>in</strong>gs is usuallynot an absolute shortage of water but a desire to usethe available water not for irrigation but for otherpurposes such as domestic or <strong>in</strong>dustrial. Increas<strong>in</strong>gcompetition for water between sectors of society isthe driv<strong>in</strong>g force beh<strong>in</strong>d such sav<strong>in</strong>gs <strong>in</strong> agriculturalwater use. The examples of what is happen<strong>in</strong>g <strong>in</strong>the Zanghe Irrigation System <strong>in</strong> Ch<strong>in</strong>a and at theAngat reservoir <strong>in</strong> the Philipp<strong>in</strong>es are a case <strong>in</strong>po<strong>in</strong>t: the managers of these reservoirs are reduc<strong>in</strong>gthe amount of water released for agricultureand redirect<strong>in</strong>g this water to cities (Manila, <strong>in</strong> thecase of Angat) and to <strong>in</strong>dustry and hydropower (<strong>in</strong>the case of Zanghe) (Loeve et al 2004a,b; Fig. 1.6).These water sav<strong>in</strong>gs <strong>in</strong> agriculture are not an activeand deliberate choice by farmers. The choice towithdraw water from agriculture is made at a higher
level: the irrigation system, prov<strong>in</strong>cial, or nationallevel. Farmers must face the consequences of thesedecisions: they receive less water and have to copewith “imposed water scarcity.” The notion that weshould ask farmers to actively save water so it canbe used elsewhere, such as by <strong>in</strong>dustry and cities,is a fallacy. Farmers can be encouraged to voluntarilyreduce water use, for example, by <strong>in</strong>troduc<strong>in</strong>gvolumetric water pric<strong>in</strong>g, but this is the exceptionrather than the rule and “enforced water scarcity” isprevalent. Voluntary water sav<strong>in</strong>gs by farmers forredirected use work well only with properly function<strong>in</strong>gwater markets. For example, <strong>in</strong> Australia,<strong>rice</strong> farmers <strong>in</strong> irrigation schemes <strong>in</strong> the Murraybas<strong>in</strong> can sell their water rights <strong>in</strong> a water market toother users, such as other farmers who grow highvaluecrops such as fruits (Thompson 2002).Def<strong>in</strong>ition 2: to reduce expenditures becauseof reduced <strong>in</strong>come. In water terms, this translates<strong>in</strong>to “reduc<strong>in</strong>g the use of irrigation water becausethere is less of it.” This type of water sav<strong>in</strong>gs <strong>in</strong>agriculture is <strong>in</strong>duced by actual and physical waterscarcity. An example of this situation for farmersis the “enforced water shortage” discussed above.However, an absolute water shortage can also be<strong>in</strong>duced by natural causes. For example, when seasonalra<strong>in</strong>s have failed to fill up reservoirs or ponds,the amount of water may not be sufficient to keepall <strong>rice</strong> fields flooded throughout the year. Whenthe reservoir forms part of a large-scale irrigationsystem, reservoir managers usually respond byreduc<strong>in</strong>g the “program area” for irrigation: fewerfarmers will receive irrigation water. However, withsmaller reservoirs such as <strong>in</strong>dividual ponds, farmersthemselves can decide how to cope with the waterscarcity. They may decide to reduce their land underirrigation or they could decide to “reduce currentexpenditures to allow for future expenditures”: todeliberately save water early <strong>in</strong> the season to have itavailable later <strong>in</strong> the season. Farmers can save waterby reduc<strong>in</strong>g the amount of irrigation applied to theirfields early <strong>in</strong> the season. The best way to do this isby reduc<strong>in</strong>g the nonproductive outflows seepage,percolation, and evaporation (Chapter 3).Def<strong>in</strong>ition 3: to reduce costs to <strong>in</strong>crease profit.In water terms, this translates <strong>in</strong>to “reduc<strong>in</strong>g theuse of irrigation water to lower the costs.” Thisscenario is applicable when farmers pay a high costfor water and have the means to reduce their wateruse to <strong>in</strong>crease their profits. There may be plentyof water, but it is relatively expensive (“economicwater scarcity”). In most surface irrigation systems<strong>in</strong> Asia, farmers either pay no cost for their water orpay a flat rate (a fixed sum per unit land area), andwater costs cannot be reduced by reduc<strong>in</strong>g wateruse. When farmers pump their own water, either<strong>in</strong>dividually or collectively, they pay a relativelyhigh p<strong>rice</strong> for their water when pump<strong>in</strong>g is fromdeep aquifers and/or when the p<strong>rice</strong> for electricityor fuel is high. In this case, water sav<strong>in</strong>gs byfarmers are a voluntary and deliberate choice oftheir own. The means to save water are the sameas <strong>in</strong> the scenario above: to reduce irrigation waterto their fields.These examples illustrate that water scarcity isusually imposed upon farmers (either by nature orby decision makers at higher levels) and that sav<strong>in</strong>gwater is hardly a voluntary choice (except <strong>in</strong> def<strong>in</strong>ition3). Farmers just have to cope with physicalwater scarcity, and the term “water-scarcity cop<strong>in</strong>gtechnology” may be more appropriate than the term“water-sav<strong>in</strong>g technology.”10
- Page 2: Water Management in Irrigated Rice:
- Page 5 and 6: PrefaceWorldwide, about 79 million
- Page 8 and 9: Fig. 1.2. Water balance of a lowlan
- Page 10 and 11: given in Table 1.1. Water losses by
- Page 16 and 17: The plant-soil-water system22.1 Wat
- Page 18 and 19: Ψ Air-100 MPaDemandLeafXylemStemRo
- Page 20: tive to water deficit than cell enl
- Page 23 and 24: Water input (mm)4003503002502001501
- Page 25 and 26: Table 3.1b. Yield, water input, and
- Page 27: Grain yield (t ha -1 )98A2002 20037
- Page 30 and 31: Table 3.5. Water input (I = irrigat
- Page 32 and 33: Practical implementationTemperate e
- Page 34 and 35: Practical implementationSpecific in
- Page 36 and 37: Table 3.8. Comparison of water use
- Page 38: Flooded yield (t ha -1 )87A65432102
- Page 41 and 42: consumption (Hamilton 2003). Many t
- Page 44 and 45: Irrigation systems55.1 Water flows
- Page 46 and 47: the main system is supply-driven, f
- Page 48 and 49: Table 5.1. Area, water use, and tot
- Page 50 and 51: Appendix: InstrumentationDetailed d
- Page 52: 0.5 cm in diameter and spaced 2 cm
- Page 55 and 56: Bronson KF, Singh U, Neue HU, Abao
- Page 57 and 58: Lampayan RM, Bouman BAM, De Dios JL
- Page 59: Uphoff N. 2007. Agroecological alte


![International Standards' Organization â Rice Specification [ISO 7301]](https://img.yumpu.com/36696862/1/190x245/international-standards-organization-a-rice-specification-iso-7301.jpg?quality=85)