Water management in irrigated rice - Rice Knowledge Bank ...
Water management in irrigated rice - Rice Knowledge Bank ...
Water management in irrigated rice - Rice Knowledge Bank ...
- No tags were found...

Create successful ePaper yourself
Turn your PDF publications into a flip-book with our unique Google optimized e-Paper software.
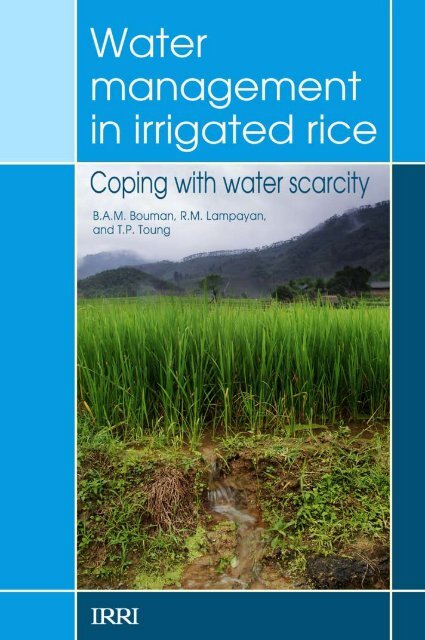
<strong>Water</strong> Management <strong>in</strong> Irrigated <strong>Rice</strong>:Cop<strong>in</strong>g with <strong>Water</strong> ScarcityB.A.M. Bouman, R.M. Lampayan, and T.P. Tuong2007Los Baños, Philipp<strong>in</strong>es
ContentsPreface1 <strong>Rice</strong> and water 11.1 <strong>Rice</strong> environments 11.2 Irrigated lowlands 11.3 The <strong>rice</strong> field and its water balance 11.4 Groundwater under <strong>rice</strong> fields 51.5 <strong>Rice</strong> water productivity 51.6 Global <strong>rice</strong> water use 71.7 <strong>Water</strong> scarcity <strong>in</strong> <strong>rice</strong>-grow<strong>in</strong>g areas 82 The plant-soil-water system 112.1 <strong>Water</strong> movement <strong>in</strong> the soil-plant- 11atmosphere cont<strong>in</strong>uum2.2 The <strong>rice</strong> plant and drought 143 Cop<strong>in</strong>g with water scarcity 173.1 Land preparation 173.1.1 Field channels 173.1.2 Land level<strong>in</strong>g 173.1.3 Tillage: reduc<strong>in</strong>g soil 17permeability3.1.4 Bund preparation and 18ma<strong>in</strong>tenance3.2 Crop establishment 183.3 Crop growth period. 193.3.1 Saturated soil culture 193.3.2 Alternate wett<strong>in</strong>g and 19dry<strong>in</strong>giv3.3.3 The System of <strong>Rice</strong> 22Intensification3.4 Aerobic <strong>rice</strong> 233.4.1 Raised beds 273.4.2 Conservation agriculture 283.5 What option where? 293.6 Susta<strong>in</strong>ability 324 Ecosystem services and 35the environment4.1 Ecosystem services 354.2 Environmental impacts 364.2.1 Ammonia volatilization 364.2.2 Greenhouse gases 364.2.3 <strong>Water</strong> pollution 364.3 Effects of water scarcity 375 Irrigation systems 395.1 <strong>Water</strong> flows <strong>in</strong> irrigation systems 395.2 Field versus irrigation system level 415.3 Integrated approaches 415.4 Irrigation system <strong>management</strong> 425.5 Irrigation system design 43Appendix: Instrumentation 45A.1 Field water tube 45A.2 Groundwater tube 46References 49iii
PrefaceWorldwide, about 79 million ha of <strong>irrigated</strong> lowlandsprovide 75% of the total <strong>rice</strong> production.Lowland <strong>rice</strong> is traditionally grown <strong>in</strong> bundedfields that are cont<strong>in</strong>uously flooded from cropestablishment to close to harvest. It is estimatedthat <strong>irrigated</strong> lowland <strong>rice</strong> receives some 34–43%of the total world’s irrigation water, or 24–30%of the total world’s freshwater withdrawals. With<strong>in</strong>creas<strong>in</strong>g water scarcity, the susta<strong>in</strong>ability, foodproduction, and ecosystem services of <strong>rice</strong> fieldsare threatened. Therefore, there is a need to developand dissem<strong>in</strong>ate water <strong>management</strong> practices thatcan help farmers to cope with water scarcity <strong>in</strong> <strong>irrigated</strong>environments.This manual provides an overview of technicalresponse options to water scarcity. It focuses onwhat <strong>in</strong>dividual farmers can do at the field level,with a brief discussion on response options at theirrigation system level. The manual is meant as asupport document for tra<strong>in</strong><strong>in</strong>g on water <strong>management</strong><strong>in</strong> <strong>rice</strong> production. It comb<strong>in</strong>es scientificbackground <strong>in</strong>formation (with many literature referencesfor further read<strong>in</strong>g) with practical suggestionsfor implementation. The target audience is people<strong>in</strong>volved <strong>in</strong> agricultural extension or tra<strong>in</strong><strong>in</strong>g withan advanced education <strong>in</strong> agriculture or water<strong>management</strong>, who wish to <strong>in</strong>troduce sound water<strong>management</strong> practices to <strong>rice</strong> farmers (such as staffof agricultural colleges and universities, scientists,irrigation operators, and extension officers).Introductory chapters analyze the water use andwater balance of <strong>rice</strong> fields, and water movement<strong>in</strong> the plant-soil system, and discuss the conceptsof water scarcity and water sav<strong>in</strong>gs. Consequencesof water scarcity for susta<strong>in</strong>ability, environmentalimpacts, and ecosystem services of <strong>irrigated</strong> <strong>rice</strong>fields are discussed at the end. An appendix <strong>in</strong>troducestwo simple <strong>in</strong>struments to characterize thewater status of <strong>rice</strong> fields that can help farmers <strong>in</strong>apply<strong>in</strong>g water-sav<strong>in</strong>g technologies.This manual was developed through the <strong>Water</strong>Work Group of the Irrigated <strong>Rice</strong> Research Consortium(which is co-funded by the Swiss Agencyfor Development and Cooperation). The sectionson aerobic <strong>rice</strong> were co-developed by the CGIARChallenge Program on <strong>Water</strong> and Food throughthe project “Develop<strong>in</strong>g a System of Temperateand Tropical Aerobic <strong>Rice</strong> <strong>in</strong> Asia (STAR).” Manypartners from national agricultural research andextension systems <strong>in</strong> Asia have contributed to thework described <strong>in</strong> this manual. The manual wasreviewed by Dr. Ian Willet (Australian Centre forInternational Agricultural Research) and Dr. Mohs<strong>in</strong>Hafeez (CSIRO Land and <strong>Water</strong>).The authorsLos Baños, 2007iv
<strong>Rice</strong> and water11.1 <strong>Rice</strong> environmentsWorldwide, there are about 150 million hectares of<strong>rice</strong> land, which provide around 550–600 milliontons of rough <strong>rice</strong> annually (Maclean et al 2002).<strong>Rice</strong> is unique among the major food crops <strong>in</strong> itsability to grow <strong>in</strong> a wide range of hydrologicalsituations, soil types, and climates. <strong>Rice</strong> is the onlycereal that can grow <strong>in</strong> wetland conditions.Depend<strong>in</strong>g on the hydrology of where <strong>rice</strong> isgrown, the <strong>rice</strong> environment can be classified <strong>in</strong>to<strong>irrigated</strong> lowland <strong>rice</strong> (79 million ha), ra<strong>in</strong>fed lowland<strong>rice</strong> (54 million ha), flood-prone <strong>rice</strong> (11 millionha), and upland <strong>rice</strong> (14 million ha). Lowland<strong>rice</strong> is also called “paddy <strong>rice</strong>.” Lowland <strong>rice</strong> fieldshave saturated (anaerobic) soil conditions with pondedwater for at least 20% of the crop’s duration.In <strong>irrigated</strong> lowlands, the availability of irrigationassures that ponded water is ma<strong>in</strong>ta<strong>in</strong>ed for at least80% of the crop’s duration. In ra<strong>in</strong>fed lowlands,ra<strong>in</strong>fall is the only source of water to the field andno certa<strong>in</strong> duration of ponded water can be assured(depend<strong>in</strong>g on vagaries of ra<strong>in</strong>fall). In flood-proneenvironments, the fields suffer periodically fromexcess water and uncontrolled, deep flood<strong>in</strong>g (morethan 25 cm for 10 days or more). Deepwater <strong>rice</strong>and float<strong>in</strong>g <strong>rice</strong> are found <strong>in</strong> these environments.Upland <strong>rice</strong> fields have well-dra<strong>in</strong>ed, nonsaturated(aerobic) soil conditions without ponded water formore than 80% of the crop’s duration.1.2 Irrigated lowlandsThe 79 million ha of <strong>irrigated</strong> lowlands provide 75%of the world’s <strong>rice</strong> production (Maclean et al 2002;Fig. 1.1). At the turn of the Millennium, countryaverage<strong>irrigated</strong> <strong>rice</strong> yields <strong>in</strong> Asia ranged from 3to 9 t ha –1 , with an overall average of about 5 t ha –1(Maclean et al 2002). Irrigated <strong>rice</strong> is mostly grownwith supplementary irrigation <strong>in</strong> the wet season, andis entirely reliant on irrigation <strong>in</strong> the dry season.Significant areas of <strong>rice</strong> are grown <strong>in</strong> rotation witha range of other crops, such as the 15–20 million haof <strong>rice</strong>-wheat systems (Tims<strong>in</strong>a and Connor 2001,Dawe et al 2004). Irrigation systems vary widely,and <strong>in</strong>clude Individual pump irrigation from shallowtubewells (down to about 15-m depth). Small- to medium-scale community-basedpump irrigation from deep wells (down to200–300-m depth). Small- to medium-scale community-basedsurface irrigation where water is divertedfrom ponds or reservoirs (for example,the tank system <strong>in</strong> southern India and SriLanka). Small- to medium-scale community-basedsurface irrigation where water is directlydiverted from a river (run-off-the-river irrigation). Large-scale surface irrigation where water isdiverted from reservoirs or lakes. Conjunctive groundwater-surface-waterirrigation schemes (can be small to largescale).In each type of system, the ownership andcontrol of water may vary widely.1.3 The <strong>rice</strong> field and its water balanceIrrigated lowland <strong>rice</strong> is grown under floodedconditions. Mostly, <strong>rice</strong> is first raised <strong>in</strong> a separateseedbed and subsequently transplanted <strong>in</strong>to the<strong>rice</strong> field when the seedl<strong>in</strong>gs are 2–3 weeks old.
Fig. 1.2. <strong>Water</strong> balance of a lowland <strong>rice</strong> field. C = capillary rise, E = evaporation, I = irrigation, O = overbund flow, P =percolation, R = ra<strong>in</strong>fall, S = seepage, T = transpiration.pore volume, and to a large <strong>in</strong>crease <strong>in</strong> micropores(Moorman and van Breemen 1978). A typicalvertical cross-section through a puddled <strong>rice</strong> fieldshows a layer of 0–10 cm of ponded water, a puddled,muddy topsoil of 10–20 cm, a plow pan thatis formed by decades or centuries of puddl<strong>in</strong>g, andan undisturbed subsoil (Fig. 1.2). <strong>Rice</strong> roots areusually conta<strong>in</strong>ed with<strong>in</strong> the puddled layer and aretherefore quite shallow. The plow pan reduces thehydraulic conductivity and percolation rate of <strong>rice</strong>fields dramatically.Because of its flooded nature, the <strong>rice</strong> field hasa water balance that is different from that of drylandcrops such as wheat or maize. The water balanceof a <strong>rice</strong> field consists of the <strong>in</strong>flows by irrigation,ra<strong>in</strong>fall, and capillary rise, and the outflows bytranspiration, evaporation, overbund flow, seepage,and percolation (Fig. 1.2). Capillary rise is theupward movement of water from the groundwatertable. In nonflooded (aerobic) soil, this capillaryrise may move <strong>in</strong>to the root zone and provide a cropwith extra water. However, <strong>in</strong> flooded <strong>rice</strong> fields,there is a cont<strong>in</strong>uous downward flow of water fromthe puddled layer to below the plow pan (called“percolation”; see below) that basically preventscapillary rise <strong>in</strong>to the root zone. Therefore, capillaryrise is usually neglected <strong>in</strong> the water balanceof <strong>rice</strong> fields.Before the crop actually starts grow<strong>in</strong>g, water<strong>in</strong>put is already needed for wet land preparation.After puddl<strong>in</strong>g, the field is usually left fallow andflooded for a few days (or 1 to 4 weeks) before theseedl<strong>in</strong>gs are transplanted. The amount of waterused for wet land preparation can be as low as100–150 mm when the turnaround time betweensoak<strong>in</strong>g and transplant<strong>in</strong>g is a few days only orwhen the crop is direct wet seeded. However, <strong>in</strong>large-scale irrigation systems that have poor watercontrol, the turnaround time between soak<strong>in</strong>g andtransplant<strong>in</strong>g can go up to 2 months and water <strong>in</strong>putsdur<strong>in</strong>g this period can reach 940 mm (Tabbalet al 2002). After crop establishment, the soil isusually kept ponded with a 5–10-cm layer of wateruntil 1–2 weeks before harvest. Dur<strong>in</strong>g both theturnaround time and the crop growth period, wateroutflows are by overbund runoff, evaporation, seepage,and percolation. Dur<strong>in</strong>g crop growth, wateralso leaves the <strong>rice</strong> field by transpiration. Of allwater outflows, runoff, evaporation, seepage, andpercolation are nonproductive water flows and areconsidered losses from the field. Only transpirationis a productive water flow as it contributes to cropgrowth and development.When ra<strong>in</strong>fall raises the level of ponded waterabove the height of bunds, excess ra<strong>in</strong> leaves the<strong>rice</strong> field as surface runoff or overbund flow. Thissurface runoff can flow <strong>in</strong>to a neighbor<strong>in</strong>g field,but, <strong>in</strong> a sequence of fields, neighbor<strong>in</strong>g fields willpass on the runoff until it is lost <strong>in</strong> a dra<strong>in</strong>, creek,or ditch.Evaporation leaves the <strong>rice</strong> field directly fromthe ponded water layer. Transpiration by <strong>rice</strong> plants
Table 1.1. Total seasonal water <strong>in</strong>put and daily seepage and percolation rates from lowland <strong>rice</strong> fields with cont<strong>in</strong>uouslyponded water conditions. Data collected from field experiments and from farmers’ fields <strong>in</strong> Ch<strong>in</strong>a and the Philipp<strong>in</strong>es.Total seasonal water Seepage andSite <strong>in</strong>put by ra<strong>in</strong> plus percolation Referencesirrigation (mm) rate (mm d −1 )Zanghe Irrigation System, Hubei, Ch<strong>in</strong>a• Field experiment 750 to 1,110 4.0 to 6.0 Cabangon et al (2001, 2004)• Farmers’ fields 650 to 940 1.6 to 2.8 Dong et al (2004), Loeve et al (2004a,b)• Irrigation system level 750 to 1,525 4.0 to 8.0 Dong et al (2004), Loeve et al (2004a,b)Shimen, Zhejiang, Ch<strong>in</strong>a Cabangon et al (2001, 2004)• Early <strong>rice</strong> 850 to 950 1.0 to 6.0• Late <strong>rice</strong> 575 to 700 1.0 to 6.0Guimba, Philipp<strong>in</strong>es Tabbal et al (2002)• Experiment 1988 2,197 18.3• Experiment 1989 1,679 12.5• Experiment 1990 2,028 16.4• Experiment 1991 3,504 32.8Muñoz, Philipp<strong>in</strong>es, 1991 1,019 to 1,238 5.2 to 7.0 Tabbal et al (2002)Muñoz, Philipp<strong>in</strong>es, 2001 600 1.1 to 4.4 Belder et al (2004)Talavera, Philipp<strong>in</strong>es 577 to 728 0.3 to 2.0 Tabbal et al (2002)San Jose, Philipp<strong>in</strong>es Tabbal et al (2002)• Experiment 1996 1,417 9.6• Experiment 1 1997 1,920 15.2• Experiment 2 1997 2,874 25.8withdraws water from the puddled layer. S<strong>in</strong>ce theroots of <strong>rice</strong> plants generally don’t penetrate thecompacted layer, the contribution to transpirationfrom the subsoil is mostly absent. S<strong>in</strong>ce evaporationand transpiration are difficult to measure separately<strong>in</strong> the field, they are usually taken together as “evapotranspiration.”Typical evapotranspiration ratesof <strong>rice</strong> fields are 4–5 mm d –1 <strong>in</strong> the wet season and6–7 mm d –1 <strong>in</strong> the dry season, but can be as highas 10–11 mm d –1 <strong>in</strong> subtropical regions (Tabbalet al 2002). Dur<strong>in</strong>g the crop growth period, about30–40% of evapotranspiration is evaporation (Boumanet al 2005, Simpson et al 1992).Seepage is the subsurface flow of waterunderneath the bunds of a <strong>rice</strong> field. With wellma<strong>in</strong>ta<strong>in</strong>edbunds, seepage is generally small. In atoposequence of <strong>rice</strong> fields, seepage loss from onefield may be offset by <strong>in</strong>com<strong>in</strong>g seepage from anotherfield located higher up. Considerable seepagecan occur from top-end fields and from bottom-endfields that border dra<strong>in</strong>s, ditches, or creeks. Seepagerates are affected by the soil physical characteristicsof the field and bunds, by the state of ma<strong>in</strong>tenanceand length of the bunds, and by the depth of thewater table <strong>in</strong> the field and <strong>in</strong> the surround<strong>in</strong>g dra<strong>in</strong>s,ditches, or creeks (Wickham and S<strong>in</strong>gh 1978).Percolation is the vertical flow of water to belowthe root zone. The percolation rate of <strong>rice</strong> fieldsis affected by a variety of soil factors (Wickhamand S<strong>in</strong>gh 1978): structure, texture, bulk density,m<strong>in</strong>eralogy, organic matter content, and salt typeand concentration. Soil structure is changed by thephysical action of puddl<strong>in</strong>g. In a heavy-textured,montmorillonitic clay, sodium cations and a highbulk density are favorable for effective puddl<strong>in</strong>gto reduce percolation rates. The percolation rate isfurther <strong>in</strong>fluenced by the water regime <strong>in</strong> and aroundthe field. Large depths of ponded water favor highpercolation rates (Sanchez 1973, Wickham andS<strong>in</strong>gh 1978). In a field survey <strong>in</strong> the Philipp<strong>in</strong>es,Kampen (1970) found that percolation rates werehigher for fields with deep groundwater tables (> 2m depth) than for fields with shallow groundwatertables (0.5–2 m depth). In practice, seepage andpercolation flows are not easily separated becauseof transition flows that cannot be classified as eitherpercolation or seepage (Wickham and S<strong>in</strong>gh 1978).Typical comb<strong>in</strong>ed values for seepage and percolationvary from 1–5 mm d –1 <strong>in</strong> heavy clay soils to25–30 mm d –1 <strong>in</strong> sandy and sandy loam soils (Boumanand Tuong 2001). Some examples of seepageand percolation rates measured at different sites are
given <strong>in</strong> Table 1.1. <strong>Water</strong> losses by seepage andpercolation account for about 25–50% of all water<strong>in</strong>puts <strong>in</strong> heavy soils with shallow groundwater tablesof 20–50-cm depth (Cabangon et al 2004, Donget al 2004), and 50–85% <strong>in</strong> coarse-textured soilswith deep groundwater tables of 1.5-m depth ormore (Sharma et al 2002, S<strong>in</strong>gh et al 2002). Thoughseepage and percolation are losses at the field level,they are often captured and reused downstream (justlike overbund flow; Chapter 5.1). The actual amountof water reuse <strong>in</strong> <strong>rice</strong>-based irrigation systems isnot known and is expected to vary widely amongirrigation systems.Daily seepage and percolation losses from theponded water do not occur <strong>in</strong> dryland crops suchas wheat and maize. Percolation of water below theroot zone can also occur <strong>in</strong> dryland crops when theamount of water <strong>in</strong>filtrat<strong>in</strong>g <strong>in</strong>to the soil (either afterheavy ra<strong>in</strong>fall or after irrigation) is larger than thestorage capacity of the root zone, but this is not adaily water flow as <strong>in</strong> lowland <strong>rice</strong>. Also, evaporationfrom ponded water surfaces is higher than fromsoil surfaces (as <strong>in</strong> dryland crops). Therefore, it isthe relatively large water flows by seepage, percolation,and evaporation that make lowland <strong>rice</strong>fields heavy “water users.” Total seasonal water<strong>in</strong>put to <strong>rice</strong> fields (ra<strong>in</strong>fall plus irrigation) can beup to 2–3 times more than for other cereals such aswheat or maize (Tuong et al 2005). It varies fromas little as 400 mm <strong>in</strong> heavy clay soils with shallowgroundwater tables (that directly supply waterfor crop transpiration) to more than 2,000 mm <strong>in</strong>coarse-textured (sandy or loamy) soils with deepgroundwater tables (Bouman and Tuong 2001,Cabangon et al 2004). Around 1,300–1,500 mm isa typical value for <strong>irrigated</strong> <strong>rice</strong> <strong>in</strong> Asia. Table 1.1lists some values for water <strong>in</strong>puts and daily seepageand percolation rates for lowland <strong>rice</strong> fields <strong>in</strong>Ch<strong>in</strong>a and the Philipp<strong>in</strong>es.It is useful to dist<strong>in</strong>guish between the wateroutflows from <strong>rice</strong> fields that can, <strong>in</strong> pr<strong>in</strong>ciple, bereused and those that cannot be reused. Nonreusableoutflows are called “depleted water” (Molden1997) and are evaporation and transpiration. Overbundflow, seepage, and percolation are generallyreusable flows. Only when these flows enter verydeep or sal<strong>in</strong>e groundwater (or sal<strong>in</strong>e surface water)from where they cannot be recovered are theynot reusable any more and they become depletionflows as well.1.4 Groundwater under <strong>rice</strong> fieldsThe role of groundwater <strong>in</strong> provid<strong>in</strong>g water to <strong>rice</strong>plants may be large, but it has been neglected <strong>in</strong>most studies of the <strong>rice</strong> water balance. Recent datacollection suggests that through the (decade- toage-old) practice of cont<strong>in</strong>uous flood<strong>in</strong>g, the largeamounts of percolat<strong>in</strong>g water have raised groundwatertables to very close to the surface. This isespecially true <strong>in</strong> soils with a heavy texture that arepoorly dra<strong>in</strong>ed <strong>in</strong> the subsoil, as is the case <strong>in</strong> manytraditional <strong>irrigated</strong> <strong>rice</strong> environments.Figure 1.3 gives the groundwater table measuredunder flooded <strong>rice</strong> fields at some sites <strong>in</strong> Ch<strong>in</strong>aand the Philipp<strong>in</strong>es. When the groundwater is lessthan 20 cm deep, it provides a “hidden” source ofwater to the <strong>rice</strong> crop as the roots of the plants candirectly take up water from the groundwater. Whenfor some reason fields are not flooded (Chapter3), capillary rise may reach <strong>in</strong>to the root zone andaga<strong>in</strong> provide extra water to the crop. In mostwater balance studies, the effect of groundwateron water supply is not taken <strong>in</strong>to account, and thebeneficial effect of water-sav<strong>in</strong>g technologies canbe overestimated. With shallow groundwater, cropgrowth with a small irrigation water supply can stillbe good because of the “hidden” water supply ofgroundwater.1.5 <strong>Rice</strong> water productivity<strong>Water</strong> productivity (WP) is a concept of partialproductivity and denotes the amount or value ofproduct (<strong>in</strong> our case, <strong>rice</strong> gra<strong>in</strong>s) over volume orvalue of water used. Discrepancies are large <strong>in</strong> reportedvalues of WP of <strong>rice</strong> (Tuong 1999). These arepartially caused by large variations <strong>in</strong> <strong>rice</strong> yields,with commonly reported values rang<strong>in</strong>g from 3 to8 tons per hectare. But the discrepancies are alsocaused by different understand<strong>in</strong>gs of the denom<strong>in</strong>ator(water used) <strong>in</strong> the computation of WP. Toavoid confusion created by different <strong>in</strong>terpretationsand computations of WP, it is important to clearlyspecify what k<strong>in</strong>d of WP we are referr<strong>in</strong>g to andhow it is derived. Common def<strong>in</strong>itions of WP areWP T: weight of gra<strong>in</strong>s over cumulative weightof water transpired.WP ET: weight of gra<strong>in</strong>s over cumulative weightof water evapotranspired.WP I: weight of gra<strong>in</strong>s over cumulative weightof water <strong>in</strong>puts by irrigation.
Groundwater depth (cm)20AGroundwater depth (cm)20B00–20–20–40–60–80–40–60–80Panicle<strong>in</strong>itiationFlower<strong>in</strong>gHarvest–10018 Jan 7 Feb 27 Feb 18 Mar 7 Apr 27 AprDayGroundwater depth (cm)C–10016 Jun 11 Jul 5 Aug 30 Aug 7 Sep 19 OctDayGroundwater depth (cm)2020–20100–60–100–140–180–220–260–300–10–20–30–40–50–60–70–80–90–10014 Jan 13 Feb 15 Mar 14 Apr 14 Jan 13 Feb 15 Mar 14 AprDayDayFig. 1.3. Groundwater depth under flooded <strong>rice</strong> at Tuanl<strong>in</strong>, Hubei Prov<strong>in</strong>ce (A), and Changle (B), Beij<strong>in</strong>g, Ch<strong>in</strong>a, <strong>in</strong> 2002.Adapted from Belder et al (2004) and unpublished data from Ch<strong>in</strong>a Agricultural University/IRRI. Groundwater depth underflooded <strong>rice</strong> <strong>in</strong> Dolores (C) and Gabaldon (D) <strong>in</strong> 2002, Central Luzon, Philipp<strong>in</strong>es. Adapted from Lampayan et al (2005).DWP IR: weight of gra<strong>in</strong>s over cumulative weightof water <strong>in</strong>puts by irrigation and ra<strong>in</strong>.WP TOT: weight of gra<strong>in</strong>s over cumulative weightof all water <strong>in</strong>puts by irrigation, ra<strong>in</strong>,and capillary rise.Breeders are <strong>in</strong>terested <strong>in</strong> the productivity ofthe amount of transpired water (WP T), whereasfarmers and irrigation eng<strong>in</strong>eers/managers are <strong>in</strong>terested<strong>in</strong> optimiz<strong>in</strong>g the productivity of irrigationwater (WP I). To regional water resource planners,who are <strong>in</strong>terested <strong>in</strong> the amount of food that canbe produced by total water resources (ra<strong>in</strong>fall andirrigation water) <strong>in</strong> the region, water productivitywith respect to the total water <strong>in</strong>put by irrigationand ra<strong>in</strong>fall (WP IR) or to the total amount of waterthat can no longer be reused (WP ET) may be morerelevant.Modern <strong>rice</strong> varieties, when grown underflooded conditions, have similar water productivitywith respect to transpiration (WP T) as other C 3cereals such as wheat, at about 2 g gra<strong>in</strong> kg –1 watertranspired (Bouman and Tuong 2001, Tuong et al2005). The few available data <strong>in</strong>dicate that waterproductivity with respect to evapotranspiration isalso similar to that of wheat, rang<strong>in</strong>g from 0.6 to1.6 g gra<strong>in</strong> kg –1 of evapotranspired water, with amean of 1.1 g gra<strong>in</strong> kg –1 (Tuong et al 2005, Zwartand Bastiaanssen 2004, Fig. 1.4A). Comparedwith wheat, the higher evaporation rates from thewater layer <strong>in</strong> <strong>rice</strong> than from the underly<strong>in</strong>g soil <strong>in</strong>wheat are apparently compensated for by the higheryields of <strong>rice</strong>. For maize, be<strong>in</strong>g a C 4crop, the waterproductivity with respect to evapotranspiration ishigher, rang<strong>in</strong>g from 1.1 to 2.7 g gra<strong>in</strong> kg –1 water,with a mean of 1.8 g gra<strong>in</strong> kg –1 . <strong>Water</strong> productivityof <strong>rice</strong> with respect to total water <strong>in</strong>put (irrigationplus ra<strong>in</strong>fall) ranges from 0.2 to 1.2 g gra<strong>in</strong> kg –1water, with 0.4 as the average value, which is abouthalf that of wheat (Tuong et al 2005, Fig. 1.4B).Compar<strong>in</strong>g WP among seasons and locationscan be mislead<strong>in</strong>g because of differences <strong>in</strong> climaticyield potential, evaporative demands from
Distribution (%)100908070605040302010Through-flowManila01968 1973 1978 1983 1988 1993 1998YearA<strong>Water</strong> allocation (10 6 m 3 )800700B600500400300IrrigationOther uses20010001965 1968 1971 1974 1977 1980 1983 1986 1989 1992 1995 1998Fig. 1.6. (A) “Imposed water scarcity”: change <strong>in</strong> percentage water allocation from Angat reservoir, Philipp<strong>in</strong>es, to throughflow<strong>in</strong> the river for potential agricultural use downstream and to the city of Manila. Data from P<strong>in</strong>gali et al (1997) andunpublished data from the National Irrigation Adm<strong>in</strong>istration, Philipp<strong>in</strong>es. (B) “Imposed water scarcity”: change <strong>in</strong> waterallocation to agricultural and nonagricultural use <strong>in</strong> Zanghe Irrigation System, Hubei, Ch<strong>in</strong>a, between 1965 and 2002. Datapo<strong>in</strong>ts are 5-year mov<strong>in</strong>g averages. Data from Hong et al (2001) and unpublished data.Yearto cut down on costs if irrigation water is expensive.However, for most <strong>rice</strong> farmers, there is no deliberatechoice to save water as they are just confrontedby a lack of water. Under such conditions, sav<strong>in</strong>gwater simply means cop<strong>in</strong>g with scarcity. Thus,the objectives of sav<strong>in</strong>g water depend on the natureof the water scarcity and the control farmers haveover the water. Draw<strong>in</strong>g parallels with generaldef<strong>in</strong>itions of “sav<strong>in</strong>gs,” we discuss three reasonsfor sav<strong>in</strong>g water:Def<strong>in</strong>ition 1: to reduce current expenditures onone commodity to allow for redirected expenditureson other commodities. In water terms, this translates<strong>in</strong>to “reduc<strong>in</strong>g water used for irrigation so that itcan be used for another purpose.” In agriculture, themotivation for this type of water sav<strong>in</strong>gs is usuallynot an absolute shortage of water but a desire to usethe available water not for irrigation but for otherpurposes such as domestic or <strong>in</strong>dustrial. Increas<strong>in</strong>gcompetition for water between sectors of society isthe driv<strong>in</strong>g force beh<strong>in</strong>d such sav<strong>in</strong>gs <strong>in</strong> agriculturalwater use. The examples of what is happen<strong>in</strong>g <strong>in</strong>the Zanghe Irrigation System <strong>in</strong> Ch<strong>in</strong>a and at theAngat reservoir <strong>in</strong> the Philipp<strong>in</strong>es are a case <strong>in</strong>po<strong>in</strong>t: the managers of these reservoirs are reduc<strong>in</strong>gthe amount of water released for agricultureand redirect<strong>in</strong>g this water to cities (Manila, <strong>in</strong> thecase of Angat) and to <strong>in</strong>dustry and hydropower (<strong>in</strong>the case of Zanghe) (Loeve et al 2004a,b; Fig. 1.6).These water sav<strong>in</strong>gs <strong>in</strong> agriculture are not an activeand deliberate choice by farmers. The choice towithdraw water from agriculture is made at a higher
level: the irrigation system, prov<strong>in</strong>cial, or nationallevel. Farmers must face the consequences of thesedecisions: they receive less water and have to copewith “imposed water scarcity.” The notion that weshould ask farmers to actively save water so it canbe used elsewhere, such as by <strong>in</strong>dustry and cities,is a fallacy. Farmers can be encouraged to voluntarilyreduce water use, for example, by <strong>in</strong>troduc<strong>in</strong>gvolumetric water pric<strong>in</strong>g, but this is the exceptionrather than the rule and “enforced water scarcity” isprevalent. Voluntary water sav<strong>in</strong>gs by farmers forredirected use work well only with properly function<strong>in</strong>gwater markets. For example, <strong>in</strong> Australia,<strong>rice</strong> farmers <strong>in</strong> irrigation schemes <strong>in</strong> the Murraybas<strong>in</strong> can sell their water rights <strong>in</strong> a water market toother users, such as other farmers who grow highvaluecrops such as fruits (Thompson 2002).Def<strong>in</strong>ition 2: to reduce expenditures becauseof reduced <strong>in</strong>come. In water terms, this translates<strong>in</strong>to “reduc<strong>in</strong>g the use of irrigation water becausethere is less of it.” This type of water sav<strong>in</strong>gs <strong>in</strong>agriculture is <strong>in</strong>duced by actual and physical waterscarcity. An example of this situation for farmersis the “enforced water shortage” discussed above.However, an absolute water shortage can also be<strong>in</strong>duced by natural causes. For example, when seasonalra<strong>in</strong>s have failed to fill up reservoirs or ponds,the amount of water may not be sufficient to keepall <strong>rice</strong> fields flooded throughout the year. Whenthe reservoir forms part of a large-scale irrigationsystem, reservoir managers usually respond byreduc<strong>in</strong>g the “program area” for irrigation: fewerfarmers will receive irrigation water. However, withsmaller reservoirs such as <strong>in</strong>dividual ponds, farmersthemselves can decide how to cope with the waterscarcity. They may decide to reduce their land underirrigation or they could decide to “reduce currentexpenditures to allow for future expenditures”: todeliberately save water early <strong>in</strong> the season to have itavailable later <strong>in</strong> the season. Farmers can save waterby reduc<strong>in</strong>g the amount of irrigation applied to theirfields early <strong>in</strong> the season. The best way to do this isby reduc<strong>in</strong>g the nonproductive outflows seepage,percolation, and evaporation (Chapter 3).Def<strong>in</strong>ition 3: to reduce costs to <strong>in</strong>crease profit.In water terms, this translates <strong>in</strong>to “reduc<strong>in</strong>g theuse of irrigation water to lower the costs.” Thisscenario is applicable when farmers pay a high costfor water and have the means to reduce their wateruse to <strong>in</strong>crease their profits. There may be plentyof water, but it is relatively expensive (“economicwater scarcity”). In most surface irrigation systems<strong>in</strong> Asia, farmers either pay no cost for their water orpay a flat rate (a fixed sum per unit land area), andwater costs cannot be reduced by reduc<strong>in</strong>g wateruse. When farmers pump their own water, either<strong>in</strong>dividually or collectively, they pay a relativelyhigh p<strong>rice</strong> for their water when pump<strong>in</strong>g is fromdeep aquifers and/or when the p<strong>rice</strong> for electricityor fuel is high. In this case, water sav<strong>in</strong>gs byfarmers are a voluntary and deliberate choice oftheir own. The means to save water are the sameas <strong>in</strong> the scenario above: to reduce irrigation waterto their fields.These examples illustrate that water scarcity isusually imposed upon farmers (either by nature orby decision makers at higher levels) and that sav<strong>in</strong>gwater is hardly a voluntary choice (except <strong>in</strong> def<strong>in</strong>ition3). Farmers just have to cope with physicalwater scarcity, and the term “water-scarcity cop<strong>in</strong>gtechnology” may be more appropriate than the term“water-sav<strong>in</strong>g technology.”10
The plant-soil-water system22.1 <strong>Water</strong> movement <strong>in</strong> the soil-plantatmospherecont<strong>in</strong>uum<strong>Rice</strong> plants take up water from the soil and transportit upward through the roots and stems and releaseit through the leaves and stems as vapor <strong>in</strong> the atmosphere(called transpiration). The movement ofwater through the plant is driven by differences <strong>in</strong>water potential: water flows from a high potentialto a low potential (imag<strong>in</strong>e free water flow over aslop<strong>in</strong>g surface: water flows from the top, with ahigh potential, to the bottom, with a low potential).Different units express water potential (Table 2.1)and, unfortunately, different authors report differentunits. In this report, we usually use the termPascal (P).In the soil-plant-atmosphere cont<strong>in</strong>uum, thewater flows from the soil, with a relatively highpotential, through the plant to the atmosphere justoutside the leaves, which has a relatively low potential.Potentials <strong>in</strong> the soil-plant-atmosphere areusually negative and we also use the term “tension,”which has the opposite value. For example, a tensionof +10 kPa is the equivalent of a potential of–10 kPa. The term tension is <strong>in</strong>tuitively easier tounderstand: a high tension suggests a high “pull<strong>in</strong>gforce.” Thus, water flows from a low tension <strong>in</strong>the soil (low pull<strong>in</strong>g force) to a high tension <strong>in</strong> theatmosphere (high pull<strong>in</strong>g force). The water tension<strong>in</strong> the atmosphere outside the leaves is determ<strong>in</strong>edby climatic factors: relative humidity, w<strong>in</strong>d speed,temperature, and solar radiation. This atmospherictension translates <strong>in</strong>to the “evaporative demand”of the atmosphere, which determ<strong>in</strong>es potentialtranspiration rates. The water tension <strong>in</strong> the soilis determ<strong>in</strong>ed by the amount of water <strong>in</strong> the soiland by soil physical properties such as texture andbulk density. The speed with which water movesthrough the plant is determ<strong>in</strong>ed by the difference <strong>in</strong>water tension between the soil and the atmosphere(the higher the differences, the faster the water willflow) and by the resistance to water flow <strong>in</strong> the plant(Ehlers and Goss 2003). First, soil water needs toovercome a physical resistance (the epidermis)to enter the roots. Then it flows through cells orthrough spaces between cells <strong>in</strong>to so-called xylemor vascular bundles that will transport it upward.The water flows easier and faster <strong>in</strong> wide bundlesTable 2.1. Units to express water potential and some correspond<strong>in</strong>g values. pF is calculated as 10 log(–H), where H is waterheight <strong>in</strong> cm.Unit nameCorrespond<strong>in</strong>g value<strong>Water</strong> height (cm) 0 −10 −100 −1,000 −15,850pF (–) –∞ 1 2 3 4.2Bar (bar) 0 0.01 0.1 1 15.85Pascal (Pa) 0 1,000 10,000 100,000 1,585,000Kilo Pascal (kPa) 0 1 10 100 1,585Mega Pascal (MPa) 0 0.001 0.01 0.1 1.58511
ACO 2H 2 OB[CO 2 ] airBoundary layerBoundary layerresistanceEpidermis cellStomatalresistanceChloroplast[CO 2 ] Stomatal cavityStomatal cavityIntercellular spaceMesophyllresistanceMesophyll cell[CO 2 ] ChloroplastFig. 2.1. Schematic cross section of a leaf stomata (A) <strong>in</strong>dicat<strong>in</strong>g components of resistance (B). Source: Lövenste<strong>in</strong> et al(1992).(with less resistance) than <strong>in</strong> narrow bundles (withlarge resistance). From the bundles, the water flowsthrough the cells or spaces between the cells ofthe leaves to the “stomata”: small cavities <strong>in</strong> theleaves that connect to the outside world (Fig. 2.1).The stomata are the last barrier (resistance) to waterflow<strong>in</strong>g out of the plant. The process of waterrelease through the stomata is called (stomatal)transpiration (there is also a cuticular transpirationdirectly through cells of the leaves, but this is muchlower than stomatal transpiration). Figure 2.2 givesan example of water potentials <strong>in</strong> the soil-plant-atmospheresystem as water moves gradually fromthe soil through the plant <strong>in</strong>to the atmosphere.The flow of water through the plant servesseveral purposes: it transports nutrients (<strong>in</strong> itsstream) from the soil to the plant organs where theyare needed, it provides the plant with water <strong>in</strong> itscells so it will stay erect (this is called “turgor”),and transpiration cools the plant so it doesn’t getoverheated. Plants can actively regulate the rate ofwater flow (transpiration) by regulat<strong>in</strong>g the size ofthe open<strong>in</strong>g of the stomata. If there is not enoughwater <strong>in</strong> the soil to satisfy the demand from theatmosphere (that is, to give <strong>in</strong> to the pull<strong>in</strong>g forceof the atmosphere), the plant can close its stomataand reduce or even completely stop transpiration.Besides the reduction <strong>in</strong> transpiration, severalgrowth processes of the plant become affectedwhen there is not enough water. We usually callthese “drought effects,” and they are summarized<strong>in</strong> Chapter 2.2. Some typical tension levels of soilwater that are important for upland crops are given<strong>in</strong> Table 2.2.Non<strong>rice</strong> soils usually have a mixture of water,air, and solid soil particles, and the water potential isnegative (positive tension). However, under floodedconditions, as <strong>in</strong> the muddy layer above the plowpan of <strong>rice</strong> fields, the soil is saturated with waterand the potential is positive. Negative potentials(positive tensions) occur <strong>in</strong> this layer only when itdries out. Generally, <strong>rice</strong> plants experience the shiftfrom flooded conditions (negative tensions) to nonfloodedconditions (positive tensions) as “droughtstress.” A flooded soil that is saturated with water isalso called an “anaerobic soil,” whereas a soil thatis not saturated but has a mixture of air and water<strong>in</strong> the pores is called an “aerobic soil.” The waterstatus of a soil has major implications for watersupply to the crop and for pH (acidity), nutrient12
Ψ Air–100 MPaDemandLeafXylemStemRootStomatal cavityΨ Leafг StemΨ Rootг Leaf–1 MPa–0.4 MPa<strong>Water</strong> phase Vapor phaseEndodermisг RootSupply<strong>Water</strong> flowSoil particleΨ Soil–0.02–0.1 MPaΨroot – Ψsoil Ψleaf – Ψroot Ψair – Ψleaf= =гroot гstem гleafFig. 2.2 Schematic overview of water flow and water potentials <strong>in</strong> the soil-plant-atmosphere cont<strong>in</strong>uum. Adapted fromLövenste<strong>in</strong> et al (1992).Table 2.2. Some typical soil water tension levels <strong>in</strong> relation to the growth of upland crops (e.g., wheat, maize, cotton).Name pF value ExplanationSaturation –∞ All soil pores are filled with waterField capacity 2 Soil water content that is considered optimum for upland cropsPermanent wilt<strong>in</strong>g po<strong>in</strong>t 4.2 Soil water content at which most upland crops cannot extractwater from the soil any more and show permanent wilt<strong>in</strong>gAir dryness 7 No free water <strong>in</strong> soil pores any moreavailability, soil microbial population, soil organicmatter buildup/decomposition, and occurrence ofsoil pests and diseases (Chapter 3.6). Figure 2.3illustrates soil water tensions measured <strong>in</strong> an aerobicsoil where <strong>rice</strong> was grown under nonfloodedconditions like an upland crop.Each soil has a specific relationship betweenthe tension of the water and the amount of water:the lower the amount, the higher the tension. Thus,a small amount of water <strong>in</strong> the soil and a hightension both reflect a condition of relative “waterscarcity” and drought. The relationship betweensoil water tension and soil water content is calledthe “soil water retention curve” or the “pF curve.”The shape of the pF curve depends on soil type,especially on its texture (mixture of clay, silt, andsand particles), bulk density (the weight of a soilover its volume), m<strong>in</strong>eralogy, and organic mattercontent. Examples are given <strong>in</strong> Figure 2.4 for atypical clay soil and a typical sand soil. There arefour important po<strong>in</strong>ts on the pF curve for uplandcrops: saturation = pF –∞ (H = 0 cm), field capacity= pF 2, permanent wilt<strong>in</strong>g po<strong>in</strong>t = pF 4.2, andair dryness = pF 7 (see Table 2.2). The amount ofwater at each of these four tensions is different foreach soil type. When <strong>rice</strong> fields are flooded, thepF curve is not needed as soil water contents arealways at saturation. However, when a <strong>rice</strong> soil13
Soil moisture tension (kPa)100908070605040302010Panicle<strong>in</strong>itiationFlower<strong>in</strong>gHarvest0175 200 225 250 275 300Day numberFig. 2.3. Time course of soil water tension <strong>in</strong> the root zone of <strong>rice</strong> grown <strong>in</strong> a nonpuddled, nonflooded soil (this system iscalled “aerobic <strong>rice</strong>,” Chapter 3.4). The dips <strong>in</strong> tension are associated with ra<strong>in</strong>fall or an irrigation event. Adapted from YangXiaoguang et al (2005).Air dryness (pF 7)Soil water tension (pF = log(–H))765ClayPermanent wilt<strong>in</strong>g po<strong>in</strong>t (pF 4.2)43SandField capacity (pF 2)21Saturation (pF –∞)00 0.1 0.2 0.3 0.4 0.5 0.6Soil water content (cm 3 cm –3 )Fig. 2.4. Typical soil water retention curve (or pF curve) for a clay soil and a sand soil. Notice the differences <strong>in</strong> water contentat the four critical tension levels (Table 2.2) for the two soil types. Adapted from Lövenste<strong>in</strong> et al (1992).becomes dry, the pF curve becomes mean<strong>in</strong>gful asit <strong>in</strong>dicates the amount of water available for plantuptake at different tensions.2.2 The <strong>rice</strong> plant and droughtCultivated <strong>rice</strong> evolved from a semiaquatic perennialancestor (Lafitte and Bennett 2002). Thewetland ancestry of <strong>rice</strong> is reflected <strong>in</strong> a number ofmorphological and physiological characteristicsthat are unique among crop species. Lowland <strong>rice</strong>is extremely sensitive to water shortage and droughteffects occur when soil water contents drop belowsaturation. <strong>Rice</strong> has a variety of mechanisms bywhich it reacts to such conditions. The follow<strong>in</strong>g isa list compiled by Bouman and Tuong (2001):1. Inhibition of leaf production and decl<strong>in</strong>e <strong>in</strong>leaf area, lead<strong>in</strong>g to retarded leaf growthand light <strong>in</strong>terception, and hence to reducedcanopy photosynthesis. Drought stress affectsboth cell division and enlargement,though cell division appears to be less sensi-14
tive to water deficit than cell enlargement.Leaf area expansion is reduced as soon asthe soil dries below saturation (tensionshigher than 1 kPa) <strong>in</strong> most cultivars, andwhen only about 30% of the available soilwater has been extracted <strong>in</strong> cultivars withaerobic adaptation (Lilley and Fukai 1994,Wopereis et al 1996).2. Closure of stomata, lead<strong>in</strong>g to reduced transpirationrate and reduced photosynthesis.Leaf stomata do not close immediately withdrought stress, however, and the crop keepson photosynthesiz<strong>in</strong>g for a certa<strong>in</strong> periodbefore stomata close. The assimilates arenot used for leaf growth or expansion (seepo<strong>in</strong>t 1), but are stored <strong>in</strong> the exist<strong>in</strong>g leaves,stems, and roots. When drought stress isrelieved, these assimilates may becomeavailable and lead to a flush <strong>in</strong> leaf growth.In the modern high-yield<strong>in</strong>g variety IR72,stomatal closure starts at soil water tensionsof 75 kPa (Wopereis et al 1996).3. Leaf roll<strong>in</strong>g, lead<strong>in</strong>g to a reduction <strong>in</strong> effectiveleaf area for light <strong>in</strong>terception. Leafroll<strong>in</strong>g <strong>in</strong> IR72 starts at soil water tensionsof 75 kPa (Wopereis et al 1996). Leaves unrollaga<strong>in</strong> when drought stress is relieved.4. Enhanced leaf senescence, lead<strong>in</strong>g to reducedcanopy photosynthesis. Enhancedsenescence <strong>in</strong> IR72 starts at soil water tensionsof 630 kPa (Wopereis et al 1996).5. Changes <strong>in</strong> assimilate partition<strong>in</strong>g. Rootsgrow more, at the expense of the shoot,dur<strong>in</strong>g vegetative development, whereaspartition<strong>in</strong>g of assimilates among variousshoot components is not affected. Deeperroots are effective for explor<strong>in</strong>g water stored<strong>in</strong> deeper soil layers.6. Reduced plant height (though it is not likelythat reduced plant height <strong>in</strong> itself will result<strong>in</strong> yield reduction).7. Delayed flower<strong>in</strong>g. Drought <strong>in</strong> the vegetativedevelopment stage can delay flower<strong>in</strong>gup to 3 to 4 weeks <strong>in</strong> photoperiod-<strong>in</strong>sensitivevarieties. The delay <strong>in</strong> flower<strong>in</strong>g islargest with drought early <strong>in</strong> the vegetativestage and is smaller when drought occurslater.8. Reduced tiller<strong>in</strong>g and tiller death. Droughtbefore or dur<strong>in</strong>g tiller<strong>in</strong>g reduces the numberof tillers and panicles per hill. If the droughtis relieved on time, and the source size(i.e., photosynthesiz<strong>in</strong>g leaves and stems)is sufficiently large, the reduced number oftillers/panicles may be compensated for byan <strong>in</strong>creased number of gra<strong>in</strong>s per panicleand/or by an <strong>in</strong>creased gra<strong>in</strong> weight.9. Reduced number of spikelets with droughtbetween panicle <strong>in</strong>itiation and flower<strong>in</strong>g,result<strong>in</strong>g <strong>in</strong> decreased number of gra<strong>in</strong>s perpanicle.10. <strong>Rice</strong> is very sensitive to reduced wateravailability <strong>in</strong> the period around flower<strong>in</strong>gas this greatly affects spikelet sterility (Cruzand O’Toole 1984, Ekanayake et al 1989).Increased spikelet sterility with drought atflower<strong>in</strong>g results <strong>in</strong> decreased percentageof filled spikelets and, therefore, decreasednumber of gra<strong>in</strong>s per panicle. Especially atanthesis, there is a short time span whenspikelet fertility is especially sensitive todrought.11. Decreased gra<strong>in</strong> weight with drought afterflower<strong>in</strong>g.The above processes appear roughly <strong>in</strong> orderof crop development and/or severity of drought,though numbers 2–4 also occur <strong>in</strong> the reproductivestage. Some effects lead to irreversible processesof yield reduction, such as numbers 4, 9, 10, and11, whereas others may be restored when droughtis relieved, such as numbers 2 and 3, and othersmay be compensated for by other effects later <strong>in</strong>the grow<strong>in</strong>g season, such as numbers 1, 2, and 8.Drought may also affect nutrient-use efficiency bythe crop s<strong>in</strong>ce water flow is the essential means ofnutrient transport. How yield is f<strong>in</strong>ally affected bydrought depends on its tim<strong>in</strong>g, severity, duration,and frequency of occurrence. The most sensitivestage of <strong>rice</strong> to drought is around flower<strong>in</strong>g.15
Cop<strong>in</strong>g with water scarcity3In this chapter, we present technology options tohelp farmers to cope with water scarcity at the fieldlevel. The way to deal with reduced (irrigation orra<strong>in</strong>) water <strong>in</strong>flows to <strong>rice</strong> fields is to reduce thenonproductive outflows by seepage, percolation, orevaporation, while ma<strong>in</strong>ta<strong>in</strong><strong>in</strong>g transpiration flows(as these contribute to crop growth). This can bedone at land preparation, at crop establishment, anddur<strong>in</strong>g the actual crop growth period.3.1 Land preparationLand preparation lays the foundation for the wholecropp<strong>in</strong>g season and it is important <strong>in</strong> any situationto “get the basics right.” Especially important forgood water <strong>management</strong> are field channels, landlevel<strong>in</strong>g, and tillage operations (puddl<strong>in</strong>g, and bundpreparation and ma<strong>in</strong>tenance).3.1.1 Field channelsMany irrigation systems <strong>in</strong> Asia have no fieldchannels (or “tertiary” irrigation or dra<strong>in</strong>age channels)and water flows from one field <strong>in</strong>to the otherthrough breaches <strong>in</strong> the bunds. This is called “plotto-plot”irrigation. The amount of water flow<strong>in</strong>g<strong>in</strong> and out of a <strong>rice</strong> field cannot be controlled andfield-specific water <strong>management</strong> is not possible.This means that farmers may not be able to dra<strong>in</strong>their fields before harvest because water keepsflow<strong>in</strong>g <strong>in</strong> from other fields. Also, they may not beable to have water flow<strong>in</strong>g <strong>in</strong> if upstream farmersreta<strong>in</strong> water <strong>in</strong> their fields or let their fields dryout to prepare for harvest. Moreover, a number oftechnologies to cope with water scarcity requiregood water control for <strong>in</strong>dividual fields (Chapter3.5). F<strong>in</strong>ally, the water that cont<strong>in</strong>uously flowsthrough <strong>rice</strong> fields may remove valuable (fertilizer)nutrients. Construct<strong>in</strong>g separate channels to conveywater to and from each field (or to a small groupof fields) greatly improves the <strong>in</strong>dividual control ofwater and is the recommended practice <strong>in</strong> any typeof irrigation system.3.1.2 Land level<strong>in</strong>gA well-leveled field is a prerequisite for good crophusbandry. When fields are not level, water maystagnate <strong>in</strong> depressions, whereas higher parts maybecome dry. This results <strong>in</strong> uneven crop emergenceand uneven early growth, uneven fertilizer distribution,and maybe extra weed problems. Informationon technologies for land level<strong>in</strong>g can be found atwww.knowledgebank.irri.org.3.1.3 Tillage: reduc<strong>in</strong>g soil permeabilitySeepage and percolation flows from <strong>rice</strong> fields aregoverned by the permeability (hydraulic conductivity)of their soils: their capacity to conduct waterdownward and sideward (Chapter 1.3). A <strong>rice</strong> fieldcan be compared to a bathtub: the material of a bathtubis impregnable and it holds water well—however,if you have only one hole (by remov<strong>in</strong>g theplug), the water runs out immediately. <strong>Rice</strong> fieldsjust need a few rat holes or leaky spots and they willrapidly lose water by seepage and percolation.Large amounts of water can be lost dur<strong>in</strong>gsoak<strong>in</strong>g prior to puddl<strong>in</strong>g when large and deepcracks are present that favor rapid “by-pass flow”to below the root zone. Cabangon and Tuong (2000)showed the beneficial effects of additional shallowsoil tillage before land soak<strong>in</strong>g to close the cracks:the amount of water used <strong>in</strong> wet land preparationwas reduced from about 350 mm to about 250 mm(Fig. 3.1).17
<strong>Water</strong> <strong>in</strong>put (mm)400350300250200150100500ControlCracks plowedFig. 3.1. Effect of shallow tillage to fill cracks before soak<strong>in</strong>gon water <strong>in</strong>put dur<strong>in</strong>g land preparation, Bulacan, Philipp<strong>in</strong>es.Data from Cabangon and Tuong (2000).<strong>Water</strong> <strong>in</strong>put (mm)2,0001,8001,6001,4001,2001,0008006004002000No l<strong>in</strong><strong>in</strong>gRa<strong>in</strong>fallIrrigationL<strong>in</strong><strong>in</strong>gFig. 3.2. Effect on total water <strong>in</strong>put of l<strong>in</strong><strong>in</strong>g bunds withplastic <strong>in</strong> a field experiment at IRRI, Los Baños, Philipp<strong>in</strong>es.Data from Bouman et al (2005).Thorough puddl<strong>in</strong>g results <strong>in</strong> a good compactedplow sole that reduces permeability and percolationrates throughout the crop grow<strong>in</strong>g period(Chapter 1.3; De Datta 1981, Tuong et al 1994).The efficacy of puddl<strong>in</strong>g <strong>in</strong> reduc<strong>in</strong>g percolationdepends greatly on soil properties. Puddl<strong>in</strong>g maynot be effective <strong>in</strong> coarse soils, which do not haveenough f<strong>in</strong>e clay particles to migrate downwardand fill up the cracks and pores <strong>in</strong> the plow sole.On the other hand, puddl<strong>in</strong>g is very efficient <strong>in</strong> claysoils that form cracks dur<strong>in</strong>g the fallow period thatpenetrate the plow pan (Tuong et al 1994). Althoughpuddl<strong>in</strong>g reduces percolation rates of the soil, theaction of puddl<strong>in</strong>g itself consumes water, and thereis a trade-off between the amount of water used forpuddl<strong>in</strong>g and the amount of water “saved” dur<strong>in</strong>gthe crop growth period by reduced percolation rates.Puddl<strong>in</strong>g may not be necessary <strong>in</strong> heavy clay soilswith low vertical permeability or limited <strong>in</strong>ternaldra<strong>in</strong>age. In such soils, direct dry seed<strong>in</strong>g on landthat is not puddled but tilled <strong>in</strong> a dry state is verywell possible with m<strong>in</strong>imal percolation losses (Tabbalet al 2002; Chapter 3.2).Soil compaction us<strong>in</strong>g heavy mach<strong>in</strong>eryhas been shown to decrease soil permeability <strong>in</strong>sandy soil with loamy subsoils with at least 5%clay (Harnpichitvitaya et al 2000). Although mostfarmers cannot afford to compact their soils, thistechnology may be feasible on a large scale withgovernment support.3.1.4 Bund preparation and ma<strong>in</strong>tenanceGood bunds are a prerequisite to limit seepageand underbund flows (Tuong et al 1994). To limitseepage losses, bunds should be well compactedand any cracks or rat holes should be plasteredwith mud at the beg<strong>in</strong>n<strong>in</strong>g of the crop season.Make bunds high enough (at least 20 cm) to avoidoverbund flow dur<strong>in</strong>g heavy ra<strong>in</strong>fall. Small leveesof 5–10-cm height <strong>in</strong> the bunds can be used to keepponded water depth at that height. If more waterneeds to be stored, it is relatively simple to closethese levees. Researchers have used plastic sheets <strong>in</strong>bunds <strong>in</strong> field experiments to reduce seepage losses.For example, Bouman et al (2005) demonstrateda reduction of 450 mm <strong>in</strong> total water use <strong>in</strong> a <strong>rice</strong>field by l<strong>in</strong><strong>in</strong>g the bunds with plastic (Fig. 3.2).Although such measures are probably f<strong>in</strong>anciallynot attractive to farmers, the author came upon afarmer <strong>in</strong> the Mekong Delta <strong>in</strong> Vietnam who usedold plastic sheets to block seepage through veryleaky parts of his bunds.3.2 Crop establishmentM<strong>in</strong>imiz<strong>in</strong>g the turnaround time between landsoak<strong>in</strong>g for wet land preparation and transplant<strong>in</strong>greduces the period when no crop is presentand when outflows of water from the field do notcontribute to production. Especially <strong>in</strong> large-scaleirrigation systems with plot-to-plot irrigation, waterlosses dur<strong>in</strong>g the turnaround time can be very high.For <strong>in</strong>stance, <strong>in</strong> the largest surface irrigation scheme<strong>in</strong> Central Luzon, called UPRIIS (Upper PampangaRiver Integrated Irrigation System), it took up to63 days <strong>in</strong> a contiguous 145-ha block from the firstday of water delivery for land preparation until thewhole area was completely transplanted (Tabbalet al 2002). The total amount of water <strong>in</strong>put dur-18
<strong>in</strong>g that time was some 940 mm, of which 110mm was used for soak<strong>in</strong>g, 225 mm disappearedas surface runoff, 445 mm was lost by seepageand percolation, and 160 mm was lost by evaporation.In UPRIIS, farmers raise seedl<strong>in</strong>gs <strong>in</strong> part oftheir ma<strong>in</strong> field. Because of a lack of tertiary fieldchannels, the whole ma<strong>in</strong> field is soaked when theseedbed is prepared and rema<strong>in</strong>s flooded dur<strong>in</strong>gthe entire duration of the seedbed. In systems suchas UPRIIS, the turnaround time can be m<strong>in</strong>imizedby the <strong>in</strong>stallation of field channels, the adoptionof common seedbeds, or the adoption of direct wetor dry seed<strong>in</strong>g. With field channels, water can bedelivered to the <strong>in</strong>dividual seedbeds separately andthe ma<strong>in</strong> field does not need to be flooded. Commonseedbeds, either communal or privately managed,can be located strategically close to irrigation canalsand be <strong>irrigated</strong> as one block.With direct seed<strong>in</strong>g, the crop starts grow<strong>in</strong>gand us<strong>in</strong>g water from the moment of establishmentonward. Direct dry seed<strong>in</strong>g can also <strong>in</strong>creasethe effective use of ra<strong>in</strong>fall and reduce irrigationneeds as shown for the MUDA irrigation scheme<strong>in</strong> Malaysia (Cabangon et al 2002). However, dryseed<strong>in</strong>g with subsequent flood<strong>in</strong>g is possible only<strong>in</strong> heavy (clayey) soils with low permeability andpoor <strong>in</strong>ternal dra<strong>in</strong>age. A major driv<strong>in</strong>g force forthe adoption of direct seed<strong>in</strong>g <strong>in</strong> Asia is scarcityof labor s<strong>in</strong>ce direct seed<strong>in</strong>g does not use labor fortransplant<strong>in</strong>g and can be a mechanized operation.3.3 Crop growth period3.3.1 Saturated soil cultureIn saturated soil culture (SSC), the soil is kept asclose to saturation as possible, thereby reduc<strong>in</strong>gthe hydraulic head of the ponded water, which decreasesthe seepage and percolation flows. SSC <strong>in</strong>practice means that a shallow irrigation is given toobta<strong>in</strong> about 1 cm of ponded water depth a day orso after the disappearance of ponded water. Tabbalet al (2002) reported water sav<strong>in</strong>gs under SSC <strong>in</strong>transplanted and direct wet-seeded <strong>rice</strong> <strong>in</strong> puddledsoil, and <strong>in</strong> direct dry-seeded <strong>rice</strong> <strong>in</strong> nonpuddled soil(Table 3.1). Analyz<strong>in</strong>g a data set of 31 publishedfield experiments with an SSC treatment, Boumanand Tuong (2001) found that water <strong>in</strong>put decreasedon average by 23% (range: 5% to 50%) from thecont<strong>in</strong>uously flooded check, with a nonsignificantyield reduction of 6% on average. Thompson (1999)found that SSC <strong>in</strong> southern New South Wales,Australia, reduced both irrigation water <strong>in</strong>put andyield by a bit more than 10%.Raised beds can be an effective way to keepthe soil around saturation. <strong>Rice</strong> plants are grown onbeds and the water <strong>in</strong> the furrows is kept close to thesurface of the beds. In Australia, Borell et al (1997)experimented with raised beds that were 120 cmwide and separated by furrows of 30-cm width and15-cm depth to facilitate SSC practices. Comparedto flooded <strong>rice</strong>, water sav<strong>in</strong>gs were 34% and yieldlosses 16−34%. More <strong>in</strong>formation on raised bedsis found <strong>in</strong> Chapter 3.4.1.Practical implementationAlthough conceptually sound, SSC will be difficult toimplement practically s<strong>in</strong>ce it requires frequent (dailyor once every two days) applications of small amountsof irrigation water to just keep a stand<strong>in</strong>g water depthof 1 cm on flat land, or to keep furrows filled just to thetop <strong>in</strong> raised beds.3.3.2 Alternate wett<strong>in</strong>g and dry<strong>in</strong>gIn alternate wett<strong>in</strong>g and dry<strong>in</strong>g (AWD), irrigationwater is applied to obta<strong>in</strong> flooded conditions after acerta<strong>in</strong> number of days have passed after the disappearanceof ponded water. The number of days ofnonflooded soil <strong>in</strong> AWD before irrigation is appliedcan vary from 1 day to more than 10 days. ThoughTable 3.1a. Yield, water <strong>in</strong>put, and water productivity with respect to total water <strong>in</strong>put (WP IR) <strong>in</strong> transplanted and wet-seeded<strong>rice</strong> under cont<strong>in</strong>uous flood<strong>in</strong>g and SSC, Muñoz, 1991 dry season. Data from Tabbal et al (2002).TreatmentTransplantedWet-seededYield <strong>Water</strong> <strong>in</strong>put WP IRYield <strong>Water</strong> WP IR(t ha −1 ) (mm) (g gra<strong>in</strong> kg −1 water) (t ha −1 ) <strong>in</strong>put (mm) (g gra<strong>in</strong> kg −1 water)Flooded 7.4 694 1.06 7.6 631 1.20SSC 6.7 373 1.81 7.3 324 2.2719
Table 3.1b. Yield, water <strong>in</strong>put, and water productivity with respect to total water <strong>in</strong>put (WP IR) and irrigation (WP I) <strong>in</strong> dry-seeded<strong>rice</strong> under cont<strong>in</strong>uous flood<strong>in</strong>g and SSC, San Jose City, Philipp<strong>in</strong>es, 1996-97. Data from Tabbal et al (2002).Treatment<strong>Water</strong> <strong>in</strong>put (mm)<strong>Water</strong> productivity (g gra<strong>in</strong> kg −1 water)Yield (t ha −1 ) Irrigation + ra<strong>in</strong>fall Irrigation WP IRWP I1996Flooded 4.3 1,417 531 0.31 8.16SSC 4.2 1,330 432 0.32 9.651997Flooded 4.7 1,920 941 0.25 4.99SSC 4.5 1,269 355 0.36 12.81Table 3.2. Yield, water use, and water productivity with respect to irrigation and ra<strong>in</strong>fall of <strong>rice</strong> under alternate wett<strong>in</strong>g anddry<strong>in</strong>g (AWD) and cont<strong>in</strong>uously flooded conditions. Data from Bouman et al (2006a).Location Year TreatmentYield Total water <strong>Water</strong> productivity(t ha −1 ) <strong>in</strong>put (mm) (g gra<strong>in</strong> kg −1 water)Guimba, Philipp<strong>in</strong>es 1988 Flooded 5.0 2,197 0.23(Tabbal et al 2002) AWD 4.0 880 0.461989 Flooded 5.8 1,679 0.35AWD 4.3 700 0.611990 Flooded 5.3 2,028 0.26AWD 4.2 912 0.461991 Flooded 4.9 3,504 0.14AWD 3.3 1,126 0.29Tuanl<strong>in</strong>, Huibei, Ch<strong>in</strong>a 1999 Flooded 8.4 965 0.90(Belder et al 2004) AWD 8.0 878 0.952000 Flooded 8.1 878 0.92AWD 8.4 802 1.07Muñoz, Philipp<strong>in</strong>es, 2001 Flooded 7.2 602 1.20(Belder et al 2004) AWD 7.7 518 1.34some researchers have reported a yield <strong>in</strong>creaseus<strong>in</strong>g AWD (Wei Zhang and Song 1989, Stoopet al 2002), recent work <strong>in</strong>dicates that this is theexception rather than the rule (Belder et al 2004,Cabangon et al 2004, Tabbal et al 2002; Table 3.2).In 31 field experiments analyzed by Bouman andTuong (2001), 92% of the AWD treatments resulted<strong>in</strong> yield reductions vary<strong>in</strong>g from just more than 0%to 70% compared with those of the flooded checks.In all these cases, however, AWD <strong>in</strong>creased waterproductivity (WP IR) with respect to total water <strong>in</strong>putbecause the reductions <strong>in</strong> water <strong>in</strong>puts were largerthan the reductions <strong>in</strong> yield. The large variability <strong>in</strong>results of AWD <strong>in</strong> the analyzed data set was causedby differences <strong>in</strong> the number of days between irrigationsand <strong>in</strong> soil and hydrological conditions.Experiment<strong>in</strong>g with AWD <strong>in</strong> lowland <strong>rice</strong>areas with heavy soils and shallow groundwatertables <strong>in</strong> Ch<strong>in</strong>a and the Philipp<strong>in</strong>es, Cabangonet al (2004), Belder et al (2004), Lampayan et al(2005), and Tabbal et al (2002) reported that total(irrigation and ra<strong>in</strong>fall) water <strong>in</strong>puts decreased byaround 15–30% without a significant impact onyield. In all these cases, groundwater depths werevery shallow (between 10 and 40 cm), and pondedwater depths almost never dropped below the rootzone dur<strong>in</strong>g the dry<strong>in</strong>g periods (Fig. 3.3), thus turn<strong>in</strong>gAWD effectively <strong>in</strong>to a k<strong>in</strong>d of near-saturatedsoil culture. Even without ponded water, plant rootsstill had access to “hidden” water <strong>in</strong> the root zone(Chapter 1.4). More water can be saved and waterproductivity further <strong>in</strong>creased by prolong<strong>in</strong>g the20
Ponded water depth (mmm)15050Transplant<strong>in</strong>gFlower<strong>in</strong>gHarvest140 160 180–50200 220 240Day number–150–250–350Fig. 3.3. Depth of ponded water on the soil surface (above the horizontal l<strong>in</strong>e) and below the soil surface (below the horizontall<strong>in</strong>e) <strong>in</strong> an AWD experiment, Tuanl<strong>in</strong>, Hubei, Ch<strong>in</strong>a. Adapted from Belder et al (2004).periods of dry soil and impos<strong>in</strong>g a slight droughtstress on the plants, but this usually comes at theexpense of yield loss (Bouman and Tuong 2001).Research <strong>in</strong> more loamy and sandy soils with deepergroundwater tables <strong>in</strong> India and the Philipp<strong>in</strong>esshowed reductions <strong>in</strong> water <strong>in</strong>puts of more than 50%coupled with yield loss of more than 20% comparedwith the flooded check (Sharma et al 2002, S<strong>in</strong>ghet al 2002, Tabbal et al 2002).AWD is a mature technology that has beenwidely adopted <strong>in</strong> Ch<strong>in</strong>a (Li and Barker 2004). Itis also a recommended practice <strong>in</strong> northwest India,and is be<strong>in</strong>g tested by farmers <strong>in</strong> the Philipp<strong>in</strong>es.Figures 3.4 and 3.5 give an example of yields andwater <strong>in</strong>puts obta<strong>in</strong>ed by farmers <strong>in</strong> Central Luzon,Philipp<strong>in</strong>es, who practiced AWD irrigation (Lampayanet al 2005). The farmers used communaldeep-well pumps or their own shallow tubewellpumps to irrigate their fields. They divided theirfields <strong>in</strong>to two, one with AWD <strong>management</strong> and theother with cont<strong>in</strong>uous flood<strong>in</strong>g. Table 3.3 gives aneconomic comparison among AWD and cont<strong>in</strong>uouslyflooded fields. The AWD fields had the sameyield as cont<strong>in</strong>uous flood<strong>in</strong>g, but saved 16–24% <strong>in</strong>water costs and 20–25% <strong>in</strong> production costs.Very little research has been done to quantifythe impact of AWD on the different water outflowsof <strong>rice</strong> fields: evaporation, seepage, and percolation.The little work done so far suggests that AWD<strong>Water</strong> <strong>in</strong>put (mm)1,4001,2001,0008006004002000<strong>Water</strong> <strong>in</strong>put (mm)1,4001,2001,0008006004002000UpperDoloresMiddle2002 2003LowerAverageUpperMiddleLower2002 2003GabaldonAverageDoloresGabaldonAverageAverageFig. 3.4. Total water <strong>in</strong>put (mm) under AWD (shaded columns)and cont<strong>in</strong>uous flood<strong>in</strong>g (black columns) <strong>in</strong> farmers’ fields <strong>in</strong>Tarlac (A) and Nueva Ecija (B), Philipp<strong>in</strong>es, 2002 and 2003dry seasons. Data from Lampayan et al (2005).AB21
Gra<strong>in</strong> yield (t ha –1 )98A2002 200376543210UpperMiddleLowerAverageUpperMiddleLowerAveragemostly reduces seepage and percolation flows andhas only a small effect on evaporation flows. Belderet al (2007) and Cabangon et al (2004) calculatedthat evaporation losses decreased by 2–33% comparedwith fully flooded conditions.The follow<strong>in</strong>g potential benefits of AWD havebeen suggested: improved root<strong>in</strong>g system, reducedlodg<strong>in</strong>g (because of a better root system), periodicsoil aeration, and better control of some diseasessuch as golden snail. On the other hand, rats f<strong>in</strong>d iteasier to attack the crop dur<strong>in</strong>g dry soil periods.Yield (t ha –1 )982002B200376543210DoloresGabaldonAverageDoloresGabaldonAverageFig. 3.5 Average yield under AWD (shaded columns) andcont<strong>in</strong>uous flood<strong>in</strong>g (black columns) <strong>in</strong> farmers’ fields <strong>in</strong>Tarlac (A) and Nueva Ecija (B), Philipp<strong>in</strong>es, 2002 and 2003dry seasons. Data from Lampayan et al (2005).3.3.3 The System of <strong>Rice</strong> IntensificationAWD is the water <strong>management</strong> practice of theSystem of <strong>Rice</strong> Intensification (SRI), an <strong>in</strong>tegratedcrop <strong>management</strong> technology developed by theJesuit priest Father Henri de Laulanie <strong>in</strong> Madagascar(Stoop et al 2002). SRI is characterized by thefollow<strong>in</strong>g practices (Uphoff 2007): Transplant<strong>in</strong>g 8- to 12-day-old seedl<strong>in</strong>gs verycarefully (root tip down) Transplant<strong>in</strong>g s<strong>in</strong>gle seedl<strong>in</strong>gs Spac<strong>in</strong>g the plants widely apart <strong>in</strong> a squarepattern (25 × 25 cm or wider) Controll<strong>in</strong>g weeds by weed<strong>in</strong>g with a rotat<strong>in</strong>ghoe, which aerates the soil Apply<strong>in</strong>g compost to <strong>in</strong>crease the soil’s organicmatter content (optional)Table 3.3. Average cost and returns of <strong>rice</strong> grown under AWD and FP (farmers’ practice = cont<strong>in</strong>uously flooded) <strong>in</strong> farmers’fields at three sites <strong>in</strong> Central Luzon, Philipp<strong>in</strong>es, <strong>in</strong> 2002 and 2003 dry seasons. Data from Lampayan et al (2005).ItemTarlac Nueva Ecija (Gab) Nueva Ecija (Dol)FP AWD FP AWD FP AWD2002Gross returns ($ ha −1 ) 933 933 1,183 1,292 1,073 1,043Production cost ($ ha −1 ) 441 397 1,030 870 597 574Net profit ($ ha −1 ) 491 535 152 422 477 469Net profit-cost ratio 1.1 1.3 0.1 0.5 0.8 0.82003Gross returns ($ ha −1 ) 1,134 1,105Production cost ($ ha −1 ) 519 491Net profit ($ ha −1 ) 615 614Net profit-cost ratio 1.2 1.222
Table 3.4. <strong>Water</strong> <strong>in</strong>put (I = irrigation R = ra<strong>in</strong>fall) and yield of two aerobic <strong>rice</strong> varieties (HD502, HD297) under flooded andaerobic conditions <strong>in</strong> 2001 and 2002, Beij<strong>in</strong>g, Ch<strong>in</strong>a. Data from Yang Xiaoguang et al (2005).Year<strong>Water</strong> <strong>Water</strong> <strong>in</strong>put (mm) Yield (t ha −1 )<strong>management</strong>I I + R HD502 HD2972001 Flooded 1,057 1,351 6.8 5.4aerobic 350 644 5.3 4.7283 577 4.6 4.3292 586 4.3 4.2225 519 3.5 3.4175 469 3.0 2.52002 Flooded 900 1,255 4.6 5.3aerobic 522 917 5.7 5.3374 769 4.8 4.7225 620 4.0 3.9300 695 4.3 4.6152 547 3.6 2.9upland crop, such as wheat or maize. Unlike lowland<strong>rice</strong>, upland crops are grown <strong>in</strong> nonpuddled,nonsaturated (i.e., “aerobic”) soil without pondedwater. When ra<strong>in</strong>fall is <strong>in</strong>sufficient, irrigation is appliedto br<strong>in</strong>g the soil water content <strong>in</strong> the root zoneup to field capacity after it has reached a certa<strong>in</strong>lower threshold level, such as halfway between fieldcapacity and wilt<strong>in</strong>g po<strong>in</strong>t (Doorenbos and Pruit1984). The amount of irrigation water should matchevaporation from the soil and transpiration by thecrop (plus any application <strong>in</strong>efficiency losses). Thepotential water reductions at the field level when<strong>rice</strong> can be grown as an upland crop are large, especiallyon soils with high seepage and percolationrates (Bouman 2001; Chapter 3.5). Besides seepageand percolation losses decl<strong>in</strong><strong>in</strong>g, evaporation decreasess<strong>in</strong>ce there is no ponded water layer, and thelarge amount of water used for wet land preparationis elim<strong>in</strong>ated altogether (Chapter 3.1.3).In Asia, “upland <strong>rice</strong>” is already grown aerobicallywith m<strong>in</strong>imal <strong>in</strong>puts <strong>in</strong> the upland environment,but mostly as a low-yield<strong>in</strong>g subsistence cropto give stable yields under the adverse environmentalconditions of the uplands (Lafitte et al 2002).Upland <strong>rice</strong> varieties are drought tolerant, but havea low yield potential and tend to lodge under highlevels of external <strong>in</strong>puts such as fertilizer and supplementalirrigation. Alternatively, high-yield<strong>in</strong>glowland <strong>rice</strong> varieties grown under aerobic soilconditions, but with supplemental irrigation, havebeen shown to save water, but at a severe yieldpenalty (Blackwell et al 1985, Westcott and V<strong>in</strong>es1986, McCauley 1990). Achiev<strong>in</strong>g high yieldsunder <strong>irrigated</strong> but aerobic soil conditions requiresnew varieties of “aerobic <strong>rice</strong>” that comb<strong>in</strong>e thedrought-tolerant characteristics of upland varietieswith the high-yield<strong>in</strong>g characteristics of lowlandvarieties (Lafitte et al 2002, Atl<strong>in</strong> et al 2006).The development of temperate aerobic <strong>rice</strong>started <strong>in</strong> the mid-eighties <strong>in</strong> northern Ch<strong>in</strong>a andBrazil. In Ch<strong>in</strong>a, breeders have produced aerobic<strong>rice</strong> varieties with an estimated yield potential of6-7 t ha –1 (Wang Huaqi et al 2002). In experimentswith Ch<strong>in</strong>ese aerobic <strong>rice</strong> varieties close to Beij<strong>in</strong>g<strong>in</strong> 2001 and 2002, Yang Xiaoguang et al (2005) andBouman et al (2006b) obta<strong>in</strong>ed aerobic <strong>rice</strong> yieldsof 2.5−5.7 t ha −1 with only 500−900 mm of total(irrigation plus ra<strong>in</strong>fall) water <strong>in</strong>put (Table 3.4). Forcomparison, the aerobic varieties yielded 5.4−6.8t ha −1 under flooded lowland conditions, receiv<strong>in</strong>gabout 1,300 mm of total water <strong>in</strong>put. At the samesite, Xue et al (2007) reported yield maxima of3.6−4.5 t ha −1 with 688 mm of total water <strong>in</strong>put <strong>in</strong>2003, and 6.0 t ha −1 with 705 mm of water <strong>in</strong>put<strong>in</strong> 2004 (Table 3.5). The relatively high yields ofaerobic <strong>rice</strong> at Beij<strong>in</strong>g were obta<strong>in</strong>ed under “harsh”conditions for grow<strong>in</strong>g <strong>rice</strong>. The soil conta<strong>in</strong>edmore than 80% sand, was permeable, and heldwater above field capacity for a few hours afterirrigation only. The groundwater table was deeperthan 20 m, the soil moisture content <strong>in</strong> the root zonewas mostly between 50% and 80% of saturation,and soil moisture tensions went up to 90 kPa (seeFig. 2.3 <strong>in</strong> Chapter 2.1). In field experiments near24
Table 3.5. <strong>Water</strong> <strong>in</strong>put (I = irrigation, R = ra<strong>in</strong>fall) and yield of aerobic <strong>rice</strong> variety HD297 under aerobic conditions <strong>in</strong> 2003and 2004, Beij<strong>in</strong>g, Ch<strong>in</strong>a. Data from Xue Changy<strong>in</strong>g et al (2007).2003 2004<strong>Water</strong> <strong>in</strong>put (mm) Yield (t ha −1 ) <strong>Water</strong> <strong>in</strong>put (mm) Yield (t ha −1 )I I + R Exp 1 Exp 2 I I + R408 688 4.25 3.11 535 705 5.58408 618 3.70 2.54 535 675 5.35408 648 2.11 1.26 535 645 5.35408 578 − 0.46 535 605 4.99Table 3.6. Performance of aerobic <strong>rice</strong> grown by farmers around Kaifeng, northern Ch<strong>in</strong>a, <strong>in</strong> terms of yield and water use,2002-03. Data from Bouman et al (2007).Farmer (code letter) A B C D E F GYield (t ha −1 ) 3.8 4.4 3.8 5.1 5.5 4.7 3.4Irrigation (mm) 225 225 80 231 230 300 225Ra<strong>in</strong>fall (mm) 337 337 337 337 337 337 337Total water <strong>in</strong>put (mm) 562 562 417 568 567 637 562Farmer (code letter) U V W X Y ZYield (t ha −1 ) 1.2 3.8 2.4 3.8 3.6 3.0Irrigation (mm) 156 159 145 169 146 162Ra<strong>in</strong>fall (mm) 674 674 674 674 674 674Total water <strong>in</strong>put (mm) 830 833 819 843 820 836Kaifeng <strong>in</strong> the North Ch<strong>in</strong>a Pla<strong>in</strong>, Feng Lip<strong>in</strong>g etal (2007) obta<strong>in</strong>ed relatively low yields of 2.4−3.6t ha −1 with 750−1,000 mm of total water <strong>in</strong>put. Itis estimated that aerobic <strong>rice</strong> systems are currentlybe<strong>in</strong>g pioneered by farmers on some 80,000 ha<strong>in</strong> northern Ch<strong>in</strong>a us<strong>in</strong>g supplementary irrigation(Wang Huaqi et al 2002). Bouman et al (2007)reported yields of aerobic <strong>rice</strong> obta<strong>in</strong>ed by farmersaround Kaifeng of up to 5.5 t ha −1 with sometimesas little as 566 mm of total water <strong>in</strong>put, with onlyone or two supplementary irrigation applications(Table 3.6). Table 3.7 compares the performance<strong>in</strong>dicators of aerobic <strong>rice</strong>, lowland <strong>rice</strong>, and maizeobta<strong>in</strong>ed by farmers <strong>in</strong> the same area. Simulationmodel predictions even suggested that no irrigationwould be needed for high yields with some 400−600mm of ra<strong>in</strong>fall and groundwater tables of 2 m deepand less. In Brazil, a breed<strong>in</strong>g program to improveupland <strong>rice</strong> has resulted <strong>in</strong> aerobic varieties with ayield potential of up to 6 t ha –1 (Piñheiro et al 2006).Farmers grow these varieties <strong>in</strong> rotation with cropssuch as soybean and fodder on large commercialfarms with supplemental spr<strong>in</strong>kler irrigation on anestimated 250,000 ha of flat lands <strong>in</strong> the Cerradoregion, realiz<strong>in</strong>g yields of 3−4 t ha −1 .The development of tropical aerobic <strong>rice</strong> is ofrelatively recent orig<strong>in</strong>. De Datta et al (1973) grewlowland variety IR20 <strong>in</strong> aerobic soil under furrowirrigation at IRRI <strong>in</strong> the Philipp<strong>in</strong>es. <strong>Water</strong> sav<strong>in</strong>gswere 55% compared with flooded conditions, butyield fell from about 8 t ha −1 under flooded conditionsto 3.4 t ha −1 under aerobic conditions. Us<strong>in</strong>gimproved upland <strong>rice</strong> varieties, George et al (2002)reported aerobic <strong>rice</strong> yields of 1.5−7.4 t ha −1 <strong>in</strong>uplands with 2,500 to 4,500 mm of annual ra<strong>in</strong>fall<strong>in</strong> the Philipp<strong>in</strong>es. Yields of 6 t ha −1 and more,however, were realized only <strong>in</strong>cidentally <strong>in</strong> the firstyears of cultivation, and most yields were <strong>in</strong> the 2−3t ha −1 range. Atl<strong>in</strong> et al (2006) reported aerobic <strong>rice</strong>yields of 3−4 t ha −1 us<strong>in</strong>g recently developed aerobic25
Table 3.7. Average performance of aerobic <strong>rice</strong>, lowland <strong>rice</strong>, and maize near Kaifeng, northernCh<strong>in</strong>a, 2002-03. Unpublished data from Ch<strong>in</strong>a Agricultural University and IRRI.Item Lowland <strong>rice</strong> Aerobic <strong>rice</strong> MaizeNumber of farmers, 2002 5 7 3Field size (ha) 0.12 0.12 0.15Yield (t ha −1 ) 7.3 4.4 7.5Irrigation (mm) 1,407 217 77Ra<strong>in</strong>fall (mm) 337 337 337Total water (mm) 1,744 553 414WP IR(g gra<strong>in</strong> kg −1 total water) 0.42 0.79 1.81Input costs ($ ha −1 ) 379 230 140Production value ($ ha −1 ) 1,097 706 1,071Net <strong>in</strong>come ($ ha −1 ) 718 487 906Own labor (d ha −1 ) 116 93 109Net <strong>in</strong>come (<strong>in</strong>clud<strong>in</strong>g labor) ($ ha −1 ) 500 312 703Number of farmers, 2003 2 6 3Field size (ha) 0.11 0.11 0.56Yield (t ha –1 ) 3,7 3.0 5.7Irrigation (mm) 476 156 0Ra<strong>in</strong>fall (mm) 674 674 674Total water (mm) 1,149 830 674WP IR(g gra<strong>in</strong> kg −1 total water) 0.32 0.36 0.85Input costs ($ ha −1 ) 378 261 129Production value ($ ha −1 ) 643 520 856Net <strong>in</strong>come ($ ha −1 ) 265 259 727Own labor (d ha −1 ) 162 75 41Net <strong>in</strong>come (<strong>in</strong>clud<strong>in</strong>g labor) ($ ha −1 ) −34 120 651<strong>rice</strong> varieties <strong>in</strong> farmers’ fields <strong>in</strong> ra<strong>in</strong>fed uplands<strong>in</strong> the Philipp<strong>in</strong>es. Though the amount of ra<strong>in</strong>fallwas not reported, the conditions of the trials weredescribed as “well watered.” Bouman et al (2005)and Peng et al (2006) quantified yield and wateruse of the recently released tropical aerobic <strong>rice</strong>variety Apo under <strong>irrigated</strong> aerobic and floodedconditions. In the dry season, yields under aerobicconditions were 4−5.7 t ha −1 and <strong>in</strong> the wet seasonthey were 3.5−4.2 t ha −1 . These yields were obta<strong>in</strong>ed<strong>in</strong> relatively wet soil with seasonal-average soilmoisture tensions <strong>in</strong> the root zone of 10−12 kPaand with maximum values of around 40 kPa. Onaverage, the mean yield of all varieties was 32%lower under aerobic conditions than under floodedconditions <strong>in</strong> the dry season and 22% lower <strong>in</strong> thewet season. Total water <strong>in</strong>put was 1,240−1,880mm <strong>in</strong> flooded fields and 790−1,430 mm <strong>in</strong> aerobicfields. On average, aerobic fields used 190 mm lesswater <strong>in</strong> land preparation and had 250−300 mm lessseepage and percolation, 80 mm less evaporation,and 25 mm less transpiration than flooded fields.Successful examples of the adoption of aerobic<strong>rice</strong> by farmers <strong>in</strong> the tropics are <strong>in</strong> some ra<strong>in</strong>feduplands <strong>in</strong> Batangas Prov<strong>in</strong>ce, Philipp<strong>in</strong>es (Atl<strong>in</strong> etal 2006). In the hilly regions of Yunnan Prov<strong>in</strong>ce,southern Ch<strong>in</strong>a, farmers grow ra<strong>in</strong>fed aerobic <strong>rice</strong>under <strong>in</strong>tensified <strong>management</strong>, realiz<strong>in</strong>g yields of3−4 t ha −1 (Atl<strong>in</strong> et al 2006).26
Practical implementationTemperate environment/Ch<strong>in</strong>a. Promis<strong>in</strong>g aerobic <strong>rice</strong> varieties <strong>in</strong> northern Ch<strong>in</strong>a are HD277, HD297, and HD502. Beforesow<strong>in</strong>g, the land should be dry prepared by plow<strong>in</strong>g and harrow<strong>in</strong>g to obta<strong>in</strong> a smooth seedbed. Seeds should be dryseeded at 1−2-cm depth <strong>in</strong> heavy (clayey) soils and at 2−3-cm depth <strong>in</strong> light-textured (loamy) soils. Optimum seed<strong>in</strong>g ratesstill need to be established but are probably <strong>in</strong> the 60−80 kg ha −1 range. In experiments so far, row spac<strong>in</strong>gs between25 and 35 cm gave similar yields. Sow<strong>in</strong>g of the seeds can be done manually (e.g., dibbl<strong>in</strong>g the seeds <strong>in</strong> slits opened bya stick or a tooth harrow) or us<strong>in</strong>g direct-seed<strong>in</strong>g mach<strong>in</strong>ery. The total amount of fertilizer N application could probablyfollow local recommendations for lowland <strong>rice</strong> aim<strong>in</strong>g at a 4−6 t ha −1 yield level. The total amount of N to be applieddepends on <strong>in</strong>digenous soil N supply and other sources of N (such as atmospheric deposition). If no knowledge on localrecommendations is available, an amount of 90 kg N ha −1 could be a useful start<strong>in</strong>g po<strong>in</strong>t (to be subsequently optimized).Instead of basal application of the first N split, the first application can best be applied 10−12 days after emergenceto m<strong>in</strong>imize N losses by leach<strong>in</strong>g (the emerg<strong>in</strong>g seedl<strong>in</strong>gs can’t take up N fast, so it will easily leach out). Second andthird split applications can be given around maximum tiller<strong>in</strong>g and panicle <strong>in</strong>itiation, respectively. With future research,pr<strong>in</strong>ciples of site-specific nutrient <strong>management</strong> (SSNM) for aerobic <strong>rice</strong> should be developed. If the crop is grown <strong>in</strong> adry season, a light irrigation application (say 30 mm) should be given after sow<strong>in</strong>g to promote emergence. Subsequentirrigation applications should aim to frequently restore the soil water content to field capacity, and depend on the ra<strong>in</strong>fallpattern, the depth of groundwater, and on availability and/or cost of irrigation water. Irrigation can be applied by the samemeans as used for upland crops: flash flood, furrow, or spr<strong>in</strong>kler.Tropical aerobic <strong>rice</strong> systems for water-short <strong>irrigated</strong> environments are still <strong>in</strong> the research and development phase.More research is especially needed to develop high-yield<strong>in</strong>g aerobic <strong>rice</strong> varieties and susta<strong>in</strong>able <strong>management</strong> systems.In the tropical Philipp<strong>in</strong>es, the most promis<strong>in</strong>g variety so far is Apo, but the breed<strong>in</strong>g of improved varieties is <strong>in</strong> full sw<strong>in</strong>g.In general, the same <strong>management</strong> practices as for northern Ch<strong>in</strong>a can be followed. However, susta<strong>in</strong>ability seems so farmore of a problem <strong>in</strong> tropical areas than <strong>in</strong> temperate areas such as northern Ch<strong>in</strong>a. Aerobic <strong>rice</strong> should not be grownconsecutively on the same piece of land, and—depend<strong>in</strong>g on the cropp<strong>in</strong>g history and soil type—even complete yieldfailures can occur on fields cropped to aerobic <strong>rice</strong> the very first time <strong>in</strong> their history! The ma<strong>in</strong> problems to overcome <strong>in</strong>the development of tropical aerobic <strong>rice</strong> are listed <strong>in</strong> Chapter 3.6.3.4.1 Raised bedsOne of the recently proposed <strong>in</strong>novations to dealwith water scarcity <strong>in</strong> the <strong>rice</strong>-wheat system <strong>in</strong>the Indo-Gangetic Pla<strong>in</strong> is the use of raised beds,<strong>in</strong>spired by the success of the system <strong>in</strong> high-yield<strong>in</strong>g,<strong>irrigated</strong> wheat-maize areas <strong>in</strong> Mexico (Sayreand Hobbs 2004). In the system of raised beds,<strong>rice</strong> is grown on beds that are separated by furrowsthrough which irrigation water is coursed. In irrigationeng<strong>in</strong>eer<strong>in</strong>g terms, the system of raised beds iscomparable with “furrow irrigation.” Irrigation is<strong>in</strong>termittent and the soil of the beds is dom<strong>in</strong>antly<strong>in</strong> aerobic conditions; hence, the system can beconsidered an aerobic <strong>rice</strong> system (this is differentfrom the use of beds <strong>in</strong> heavy soils to ma<strong>in</strong>ta<strong>in</strong>saturated soil conditions, Chapter 3.3.1). In general,furrow irrigation is more water efficient than flashflood<strong>in</strong>g(depend<strong>in</strong>g on soil type, field dimensions,and slope of the land), and furrow irrigation shouldhold promise for aerobic <strong>rice</strong>. Though dimensionsmay vary, beds are usually around 35 cm wide,separated by furrows that are 30 cm wide and 25 cmdeep. <strong>Rice</strong> can be transplanted or direct-seeded onthe beds. So far, the raised-bed system has mostlybeen tested with current lowland <strong>rice</strong> varieties, andyield ga<strong>in</strong>s can be expected when suitable aerobicvarieties are developed/used. Tractor-pulled equipmenthas been developed that shapes the beds anddrills seed (sometimes together with fertilizers) <strong>in</strong>one operation.Among the suggested benefits of raised bedsare improved water-use and nutrient-use efficiency,improved water <strong>management</strong>, higher yields,and—when the operations are mechanized—reducedlabor requirements and improved seed<strong>in</strong>gand weed<strong>in</strong>g practices (Connor et al 2003, Hobbsand Gupta 2003). Balasubramanian et al (2003) andHobbs and Gupta (2003) reported <strong>in</strong>itial results ofon-station trials and farmer participatory evaluationof <strong>rice</strong> on beds <strong>in</strong> the <strong>rice</strong>-wheat belt <strong>in</strong> India. Yieldof <strong>rice</strong> transplanted or direct-seeded on beds wasplus/m<strong>in</strong>us 5−6% of that of puddled transplanted<strong>rice</strong>, while irrigation water sav<strong>in</strong>gs averaged about37−40%. In a recent review, however, Kukal et al27
(2006) reported that “the performance of <strong>rice</strong> onbeds <strong>in</strong> NW India has been variable, but generallydisappo<strong>in</strong>t<strong>in</strong>g to date. Even with similar irrigationschedul<strong>in</strong>g, yields on permanent beds are generally20−40% lower than puddled transplanted <strong>rice</strong>,with serious problems of iron deficiency, weeds,accurate sow<strong>in</strong>g depth, and sometimes nematodes.Strategies for overcom<strong>in</strong>g these problems are urgentlyneeded, <strong>in</strong>clud<strong>in</strong>g breed<strong>in</strong>g and selectionfor <strong>rice</strong> grown <strong>in</strong> aerobic soil and for the wide rowspac<strong>in</strong>g between adjacent beds. There are manyreports of substantial irrigation water sav<strong>in</strong>gs with<strong>rice</strong> on beds compared with cont<strong>in</strong>uously floodedpuddled transplanted <strong>rice</strong>. However, some studiessuggest that where similar irrigation schedul<strong>in</strong>g isused, irrigation water use of transplanted <strong>rice</strong> onbeds and puddled flats is similar, or even higheron the beds due to higher percolation rates <strong>in</strong> thenonpuddled furrows and longer duration of directseeded<strong>rice</strong>.”Choudhury et al (2007) compared the yield, water<strong>in</strong>put (ra<strong>in</strong>fall, irrigation), and water productivityof dry-seeded <strong>rice</strong> on raised beds and flat land withthat of flooded transplanted and wet-seeded <strong>rice</strong>,and analyzed the effects of beds on the subsequentwheat crop. Their experiments were conducted <strong>in</strong>2001-03 at New Delhi, India. The yields variedfrom 3.2 t ha −1 (flat land and raised beds) to 5.5 tha −1 (flooded transplanted). Yields on raised bedsthat were kept around field capacity were 32−42%lower than under flooded transplanted conditions,and 21% lower than under flooded wet-seeded conditions.Total water <strong>in</strong>put varied from 930 mm onraised beds to 1,600 mm <strong>in</strong> the flooded transplantedfields. Total water <strong>in</strong>put <strong>in</strong> <strong>rice</strong> on raised beds was38−42% lower than <strong>in</strong> flooded transplanted <strong>rice</strong>,and 32−37% lower than <strong>in</strong> flooded wet-seeded <strong>rice</strong>.However, the reduced water <strong>in</strong>puts <strong>in</strong> raised bedswere also realized with dry seed<strong>in</strong>g on flat landwith the same water <strong>management</strong>. Reduced water<strong>in</strong>puts and yield reductions balanced each otherso that water productivity was comparable amongmost treatments. It should be noted that this studywas done <strong>in</strong> small plots (compared with farmers’fields), where edge effects (seepage losses underand adjacent to the bunds) can dom<strong>in</strong>ate the waterbalance.A dist<strong>in</strong>ction needs to be made between “permanentbeds” and “fresh beds.” Permanent bedsare constructed once and reshaped only afterwardwith subsequent cropp<strong>in</strong>g. They are used <strong>in</strong> croprotations (<strong>rice</strong>-non<strong>rice</strong> crops) and have advantages<strong>in</strong> terms of cost sav<strong>in</strong>gs, timel<strong>in</strong>ess of plant<strong>in</strong>g,and opportunities for rapid crop diversification <strong>in</strong>response to market options. The raised beds canespecially benefit the non<strong>rice</strong> crop <strong>in</strong> heavy waterloggedsoils because of improved dra<strong>in</strong>age (removalof water through the furrows; beds rema<strong>in</strong> relativelydry). However, just like with aerobic <strong>rice</strong> on flatland (Chapter 3.6), yield of both transplanted anddirect-seeded <strong>rice</strong> has been noted to decl<strong>in</strong>e undercont<strong>in</strong>uous cropp<strong>in</strong>g on permanent raised beds (E.Humphreys, personal communication).Practical implementationGrow<strong>in</strong>g <strong>rice</strong> on raised beds shows promise but isstill <strong>in</strong> its <strong>in</strong>fancy of development (Humphreys et al2005, Kukal et al 2006). In the Indo-Gangetic Pla<strong>in</strong>,farmers are experiment<strong>in</strong>g with raised beds for <strong>rice</strong>and other crops with different degrees of success. More<strong>in</strong>formation on raised beds can be obta<strong>in</strong>ed from the<strong>Rice</strong>-Wheat Consortium (www.rwc.cgiar.org/<strong>in</strong>dex.asp).Problems to overcome are listed <strong>in</strong> Chapter 3.6.3.4.2 Conservation agricultureWith aerobic <strong>rice</strong>, technologies of conservationagriculture, such as mulch<strong>in</strong>g and zero- or m<strong>in</strong>imumtillage as practiced <strong>in</strong> upland crops, becomeavailable to <strong>rice</strong> farmers as well (Hobbs and Gupta2003). Various methods of mulch<strong>in</strong>g (e.g., us<strong>in</strong>gdry soil, straw, and plastic sheets) are be<strong>in</strong>g experimentedwith <strong>in</strong> nonflooded <strong>rice</strong> systems <strong>in</strong> Ch<strong>in</strong>aand have been shown to reduce evaporation as wellas percolation losses while ma<strong>in</strong>ta<strong>in</strong><strong>in</strong>g high yields(Dittert et al 2002). In hilly areas <strong>in</strong> Shiyan, HubeiProv<strong>in</strong>ce, <strong>in</strong> Ch<strong>in</strong>a, farmers are adopt<strong>in</strong>g the use ofplastic sheets to cover <strong>rice</strong> fields <strong>in</strong> which the soilis kept just below saturation. The local governmentsubsidizes and actively promotes this use of plasticsheets, and, <strong>in</strong> 2006, there were an estimated 6,000ha of farmer adopters. The proclaimed advantagesare earlier crop establishment by 3 weeks (<strong>rice</strong> isestablished <strong>in</strong> early spr<strong>in</strong>g when temperatures arestill low, and the plastic sheets <strong>in</strong>crease the soiltemperature), higher yields, less weed growth,and less water use (important dur<strong>in</strong>g dry spells).However, little research has been done to verifythese benefits. The leftover plastic after harvest maycause environmental degradation if not properlytaken care of.28
Practical implementationSpecific <strong>in</strong>formation on m<strong>in</strong>imum tillage andconservation agriculture technologies for <strong>rice</strong> can beobta<strong>in</strong>ed from the <strong>Rice</strong>-Wheat Consortium (www.rwc.cgiar.org/<strong>in</strong>dex.asp).3.5 What option where?The relative “attractiveness” of the above technologiesfor farmers to respond to water scarcitydepends on the type and level of water scarcity(Chapter 1.7), on the irrigation <strong>in</strong>frastructure (orthe level of control that a farmer has over the irrigationwater), and on the socioeconomics of theirproduction environment.With absolute, or physical, water scarcity,farmers have little choice but to adapt to receiv<strong>in</strong>gless water than they would need to keep their fieldscont<strong>in</strong>uously flooded. Figure 3.6 presents a gradient<strong>in</strong> relative water availability and some appropriateresponse options. On the far right-hand side of the(horizontal) water axis, water is amply availableand farmers can practice cont<strong>in</strong>uous flood<strong>in</strong>g oflowland <strong>rice</strong> and obta<strong>in</strong> the highest yields. On thefar left-hand side, water is extremely short, suchas <strong>in</strong> ra<strong>in</strong>fed uplands, and yields are very low. Go<strong>in</strong>gfrom right to left along the water-availabilityaxis, water gets <strong>in</strong>creas<strong>in</strong>gly scarce and yields willdecl<strong>in</strong>e.Even with sufficient water available, goodland level<strong>in</strong>g, bund ma<strong>in</strong>tenance, construction offield channels, and thorough puddl<strong>in</strong>g (<strong>in</strong> the caseof puddled systems) will contribute to good cropgrowth and high yields. “Gett<strong>in</strong>g the basics right”is someth<strong>in</strong>g that all farmers can do, no matterwhether they operate <strong>in</strong> large- or small-scale irrigationsystems or whether they use their own sourcesof irrigation (such as tubewells) or shared sources.After crop establishment, cont<strong>in</strong>uous pond<strong>in</strong>g ofwater generally provides the best growth environmentfor <strong>rice</strong> and will result <strong>in</strong> the highest yields.After transplant<strong>in</strong>g, water levels should be around 3cm <strong>in</strong>itially, and gradually <strong>in</strong>crease to 5−10 cm with<strong>in</strong>creas<strong>in</strong>g plant height. With direct wet seed<strong>in</strong>g, thesoil should be kept just at saturation from sow<strong>in</strong>g tosome 10 days after emergence, and then the depthof ponded water should gradually <strong>in</strong>crease with<strong>in</strong>creas<strong>in</strong>g plant height. With direct dry seed<strong>in</strong>g,the soil should be moist but not saturated from sow<strong>in</strong>gtill emergence, or else the seeds may rot <strong>in</strong> thesoil. After sow<strong>in</strong>g, apply a flush irrigation if thereis no ra<strong>in</strong>fall to wet the soil. Saturate the soil whenplants have developed three leaves, and gradually<strong>in</strong>crease the depth of ponded water with <strong>in</strong>creas<strong>in</strong>gplant height. In special problem soils, <strong>in</strong>troduc<strong>in</strong>gsome form of alternate wett<strong>in</strong>g and dry<strong>in</strong>g (AWD)105Yield (t ha –1 )Traditionalupland <strong>rice</strong>systemFurrow, flush,spr<strong>in</strong>kler irrigationTechnologies to reduce water <strong>in</strong>putAerobic <strong>rice</strong>systemAWD SSCSoil <strong>management</strong>,reduced water depthLowland <strong>rice</strong>system∆Y = f (variety, <strong>management</strong>)0LowAerobic<strong>Water</strong> availabilityFCSoil conditionSFloodedHighFig. 3.6. Schematic presentation of yield responses to water availability and soil condition <strong>in</strong> different <strong>rice</strong> production systemsand their respective technologies to reduce water <strong>in</strong>puts. AWD = alternate wett<strong>in</strong>g and dry<strong>in</strong>g, SSC = saturated soil culture,FC = field capacity, S = saturation po<strong>in</strong>t, ΔY = change <strong>in</strong> yield. Adapted from Tuong et al (2005).29
or <strong>in</strong>creas<strong>in</strong>g the <strong>in</strong>ternal dra<strong>in</strong>age rate may improvecrop growth and yield (Ramasamy et al 1997). Theunderly<strong>in</strong>g reason may be improved soil aerationor the removal of toxic substances.The first response option to decreas<strong>in</strong>g wateravailability would be to check “the basics.” Theamount of water loss that can be reduced dependson the <strong>in</strong>itial condition of the <strong>rice</strong> field; if the basicsare right from the start, there is not much that canbe done any more. With progress<strong>in</strong>g water scarcity,establishment options alternative to transplant<strong>in</strong>gcan be considered if the turnaround time betweensoak<strong>in</strong>g and transplant<strong>in</strong>g is relatively large, suchas <strong>in</strong> some large-scale irrigation systems. If communityseedbeds or a commercial provider ofseedl<strong>in</strong>gs could be organized, this would be theleast water-consum<strong>in</strong>g method of gett<strong>in</strong>g a cropestablished. Seedl<strong>in</strong>gs could get transplanted a fewdays after land soak<strong>in</strong>g and puddl<strong>in</strong>g only, whilethe large-scale rais<strong>in</strong>g of seedl<strong>in</strong>gs would ensurean efficient use of water dur<strong>in</strong>g that period (ma<strong>in</strong>fields do not yet have to be soaked). Both direct wetand direct dry seed<strong>in</strong>g are alternative options. Dryseed<strong>in</strong>g will be effective only <strong>in</strong> relatively clayeyand impermeable soils that don’t need puddl<strong>in</strong>g toreduce the permeability any more.With further <strong>in</strong>creas<strong>in</strong>g water scarcity, water<strong>management</strong> practices dur<strong>in</strong>g the whole grow<strong>in</strong>gseason need to be considered. Instead of keep<strong>in</strong>g a5−10-cm depth of ponded water dur<strong>in</strong>g the grow<strong>in</strong>gseason, the depth can be reduced to around 3 cm.This will reduce the hydrostatic pressure and m<strong>in</strong>imizeseepage and percolation losses. In saturatedsoil culture (SSC), the depth of ponded water isreduced to 0−1 cm. Around flower<strong>in</strong>g, from 1 weekbefore to 1 week after the peak of flower<strong>in</strong>g, pondedwater should best be kept at 5-cm depth to avoid anypossible water stress that could result <strong>in</strong> severe yieldloss. The practice of SSC would require frequent(once <strong>in</strong> 2 days) applications of small amounts ofirrigation water, and hence require a high level ofcontrol over irrigation water. The practice of safeAWD can reduce water losses by a small to considerableamount without a yield penalty. To whatextent water losses can be reduced under SSC orAWD depends ma<strong>in</strong>ly on soil type and depth ofthe groundwater table: with a heavy clay soil andshallow groundwater (10−40 cm deep), water lossesare small to start with and reductions <strong>in</strong> water lossesare equally small. With more loamy or sandy soilsand/or deeper groundwater tables, reductions <strong>in</strong>water losses can be higher, but the risk of a reduction<strong>in</strong> yield also becomes higher. If water is gett<strong>in</strong>gso scarce that “safe AWD” is no longer possible,the periods between irrigation will have to becomelonger (lett<strong>in</strong>g the water <strong>in</strong> the field water tubes godeeper than 15 cm) and yield loss becomes <strong>in</strong>evitable.All forms of AWD require water control by thefarmer. With own water sources, such as tubewells,this is not a problem. In community-based or largescaleirrigation systems, a communal approach toAWD is required <strong>in</strong> which delivery of water togroups of farmers is scheduled to realize a certa<strong>in</strong>pattern of AWD. Irrigation system upgrad<strong>in</strong>g ormodernization may be required to do this, or smallstorage facilities (such as on-farm reservoirs) mayprovide the required water control (Chapter 5).With still further <strong>in</strong>creas<strong>in</strong>g water scarcity,yield of lowland <strong>rice</strong> under AWD will cont<strong>in</strong>ue togo down. At a certa<strong>in</strong> po<strong>in</strong>t, aerobic <strong>rice</strong> systemsbecome a viable alternative. How much less wateris used under aerobic conditions than under floodedconditions depends mostly on the seepage and percolation(SP) losses under flooded conditions and onthe deep percolation losses of irrigation water underaerobic conditions. Typical SP rates of flooded <strong>rice</strong>fields are given <strong>in</strong> Table 1.1 <strong>in</strong> Chapter 1.3. Underaerobic conditions, the amount of deep percolationdepends on the comb<strong>in</strong>ation of soil water-hold<strong>in</strong>gcapacity and method of irrigation, and is reflected<strong>in</strong> the irrigation application efficiency (EA). With aprecise dosage and tim<strong>in</strong>g of irrigation <strong>in</strong> relation tocrop transpiration and soil water-hold<strong>in</strong>g capacity,the EA <strong>in</strong> flash-flood irrigation can be up to 60%(Doorenbos and Pruit 1984). If furrow irrigation (orraised beds) is used, the EA can go up to 70%, andwith spr<strong>in</strong>kler irrigation up to 80% or more. Assum<strong>in</strong>gan average growth duration of 100 days, andmean ET values for <strong>rice</strong>, we can roughly calculatethe “break-even” po<strong>in</strong>t for SP rates <strong>in</strong> flooded fieldsthat would result <strong>in</strong> similar water requirements <strong>in</strong>aerobic fields with different irrigation methods(Table 3.8). When the SP rate <strong>in</strong> flooded <strong>rice</strong> is 3.5mm d −1 or higher, aerobic systems with flash-floodirrigation will require less water, and, if the SPrate is 0.5 mm d −1 or lower, only aerobic systemswith spr<strong>in</strong>kler irrigation require less water. Whenaerobic <strong>rice</strong> systems are direct (dry) seeded, as is thetypical target technology, an additional amount ofwater <strong>in</strong>put can be saved by forgo<strong>in</strong>g the wet landpreparation. An example of the cross-over po<strong>in</strong>t <strong>in</strong>terms of water availability where aerobic <strong>rice</strong> gives30
Table 3.8. Comparison of water use <strong>in</strong> a hypothetical aerobic <strong>rice</strong> crop with that of lowland <strong>rice</strong> on different soil typescharacterized by their seepage (S) and percolation (P) rates.<strong>Water</strong> flow process Aerobic <strong>rice</strong> (mm) Lowland <strong>rice</strong> (mm)Lowland soil SP rate − − 1 mm d −1 5 mm d −1 15 mm d −1Irrigation efficiency 85% 60% − − −Evaporation 100 100 200 200 200Transpiration 400 400 400 400 400Seepage and percolation − − 100 500 1,500Irrigation <strong>in</strong>efficiency loss 90 335 − − −Total 590 835 700 1,100 2,100Yield (t ha –1 )10987654321AerobicFlooded0200 400 600 800 1,000 1,200 1,400<strong>Water</strong> <strong>in</strong>put (mm)Fig. 3.7. Yield of aerobic <strong>rice</strong> varieties HD297 ( ) and HD502 ( ) and lowland <strong>rice</strong> variety JD305 ( ) at different levels ofwater <strong>in</strong>put. Data from Yang Xiaoguang et al (2005).higher yields than flooded lowland <strong>rice</strong> is given <strong>in</strong>Figure 3.7 for field experiments at Beij<strong>in</strong>g <strong>in</strong> Ch<strong>in</strong>a(Yang Xiaoguang et al 2005). Two aerobic <strong>rice</strong>varieties (HD297 and HD502) and one lowland <strong>rice</strong>variety (JD305) were grown under flooded conditionsand under aerobic soil conditions with differentamounts of total water <strong>in</strong>put. Under floodedconditions with 1,300−1,400 mm of water <strong>in</strong>put tothe right-hand side of the horizontal (water) axis,lowland variety JD305 gave the highest yields of8−9 t ha −1 . The yield of JD305, however, quicklydecl<strong>in</strong>ed with <strong>in</strong>creas<strong>in</strong>g water shortage and aerobicsoil conditions. With less than 1,100 mm of water<strong>in</strong>put, and under aerobic soil conditions, aerobic<strong>rice</strong> varieties HD297 and HD502 outperformed thelowland variety.When water is physically available, but has ahigh cost, the choice of adopt<strong>in</strong>g any of the watersav<strong>in</strong>gtechnologies becomes more of an economicissue. Adopt<strong>in</strong>g certa<strong>in</strong> water-sav<strong>in</strong>g technologiesmay reduce water but at the expense of yield loss.If the f<strong>in</strong>ancial sav<strong>in</strong>gs <strong>in</strong>curred by us<strong>in</strong>g less irrigationwater under a certa<strong>in</strong> technology outweigh thef<strong>in</strong>ancial loss of reduced yield, then the adoptionof that technology becomes attractive. Figure 3.8gives so-called “water-response curves” obta<strong>in</strong>edfrom two different field experiments <strong>in</strong> India wheredifferent forms of AWD were implemented (different<strong>in</strong>tervals between irrigations). The experimentof the lower curve was done <strong>in</strong> Cuttack, Orissa(Jha et al 1981). The climatic yield potential wasrelatively low s<strong>in</strong>ce the experiment was performed31
Yield (t ha –1 )864200 500 1,000 1,500 2,000 2,500 3,000<strong>Water</strong> <strong>in</strong>put (mm)Fig. 3.8. Yield versus water <strong>in</strong>put <strong>in</strong> two experiments <strong>in</strong> India. Top curve data ( ) are from Pantnagar, Uttar Pradesh (Tripathiet al 1986), and bottom curve data ( ) are from Cuttack, Orissa (Jha et al 1981). The curved l<strong>in</strong>es are fitted productionfunctions of the shape [yield = a*(1 – e (b*(water <strong>in</strong>put – c)) )]. Adapted from Bouman and Tuong (2001).<strong>in</strong> the w<strong>in</strong>ter season (low radiation levels). Fertilizerapplication was only 80 kg N ha −1 and zero Pand K. The soil SP rate was about 21 mm d −1 . Theexperiment of the top curve was done <strong>in</strong> Pantnagar,Uttar Pradesh (Tripathi et al 1986). The climaticyield potential was higher because the experimentwas done <strong>in</strong> the summer (high radiation levels). Torealize the higher yield potential, fertilizer applicationswere also higher: 120 kg N ha −1 , 60 kg P 2O 5ha −1 , and 40 kg K 2O ha −1 . The soil SP rate was 9−14mm d −1 . Go<strong>in</strong>g from right to left on the horizontalaxis, water use decreased with adopt<strong>in</strong>g <strong>in</strong>creas<strong>in</strong>g<strong>in</strong>tervals between irrigations <strong>in</strong> AWD. Yieldswere <strong>in</strong>itially not affected, but, after a certa<strong>in</strong> po<strong>in</strong>t,yields decl<strong>in</strong>ed with less water use. This happenedsomewhere below 1,750 mm for the top curveand somewhere below 1,000 mm for the bottomcurve. This example illustrates the site-specificityof results of AWD. Farmers will decide on thetype/severity of AWD to adopt based on the sitespecificf<strong>in</strong>ancial trade-off between yield decl<strong>in</strong>eand water sav<strong>in</strong>gs.3.6 Susta<strong>in</strong>abilityWhile relatively much work has been done onthe development of technologies to ma<strong>in</strong>ta<strong>in</strong> cropproductivity under water scarcity, little researchhas been done on their long-term susta<strong>in</strong>ability andenvironmental impacts. Given assured water supply,lowland <strong>rice</strong> fields are extremely susta<strong>in</strong>ableand able to produce cont<strong>in</strong>uously high yields, evenunder cont<strong>in</strong>uous double or triple cropp<strong>in</strong>g eachyear (Dawe et al 2000). Flood<strong>in</strong>g of <strong>rice</strong> fields hasbeneficial effects on soil acidity (pH); soil organicmatter buildup; phosphorus, iron, and z<strong>in</strong>c availability;and biological N fixation that supplies thecrop with additional N (Kirk 2004). When fieldscannot be cont<strong>in</strong>uously flooded any more becauseof water scarcity, these beneficial effects graduallydisappear. A change to more aerobic soil conditions(such as <strong>in</strong> AWD and aerobic <strong>rice</strong>) will negativelyaffect the soil pH <strong>in</strong> some situations and decreasethe availability of phosphorus, iron, and z<strong>in</strong>c. Underthe “safe AWD” practice (Chapter 3.3.2), theseproblems do not occur, but, when more severe formsof AWD are implemented, they may start to occur.Under fully aerobic conditions, whether on flat landor on raised beds, problems with micronutrientdeficiencies have been reported by Choudhury etal (2007), Sharma et al (2002), S<strong>in</strong>gh et al (2002),and Tao Hongb<strong>in</strong> et al. (2006). The <strong>in</strong>troductionof aerobic phases <strong>in</strong> <strong>rice</strong> fields may also decreasethe soil organic carbon content. In a long-term experimentat IRRI, where a cont<strong>in</strong>uous <strong>rice</strong> systemis compared with a maize-<strong>rice</strong> system, 12 yearsof maize-<strong>rice</strong> cropp<strong>in</strong>g caused a 15% decl<strong>in</strong>e <strong>in</strong>soil organic C and <strong>in</strong>digenous N supply relative to32
Flooded yield (t ha –1 )87A65432102001 2002 2003 2004 2005% Aerobic yield1009080706050403020100Cont<strong>in</strong>uousNewRestored2001 2002 2003 2004 2005YearFig. 3.9. Yield of aerobic <strong>rice</strong> variety Apo under floodedconditions (A) and relative yield of Apo under aerobicconditions (as % of the Apo yield under flooded conditions)(B). In B, the black columns <strong>in</strong>dicate cont<strong>in</strong>uous aerobicconditions, the darkly shaded column <strong>in</strong>dicates yield undernew aerobic conditions after conversion of flooded fields,and the lightly shaded column <strong>in</strong>dicates yield under restoredaerobic conditions after 1 year of fallow or flooded conditions(average is given). Data from Bouman et al (2006a).flooded <strong>rice</strong>-<strong>rice</strong> cropp<strong>in</strong>g (Roland Buresh, personalcommunication).There are <strong>in</strong>dications that soil-borne pestsand diseases such as nematodes, root aphids, andfungi occur more <strong>in</strong> nonflooded <strong>rice</strong> systems than<strong>in</strong> flooded <strong>rice</strong> systems (Sharma et al 2002, S<strong>in</strong>ghet al 2002, Ventura and Watanabe 1978, Venturaet al 1981). Current experience is that under fullyaerobic soil conditions, <strong>rice</strong> cannot be grown cont<strong>in</strong>uouslyon the same piece of land each year (ascan be successfully done with flooded <strong>rice</strong>) withouta yield decl<strong>in</strong>e (George et al 2002). Figure 3.9presents recent data from a cont<strong>in</strong>uous aerobic <strong>rice</strong>cropp<strong>in</strong>g experiment at IRRI (Bouman et al 2005,Peng et al 2006). S<strong>in</strong>ce 2001, aerobic <strong>rice</strong> varietyApo has been cont<strong>in</strong>uously grown under floodedand aerobic conditions <strong>in</strong> the same field. Floodedyields <strong>in</strong> the dry season are usually 6.5−7 t ha −1 ,except <strong>in</strong> 2001, when diseases depressed yields. InBYield (kg ha –1 )2,5002,0001,5001,0005000060120N (t ha –1 )160200Fig. 3.10. Yield of aerobic <strong>rice</strong> variety Apo under aerobic soilconditions at IRRI <strong>in</strong> 2004, at four levels of fertilizer N supply,and under three levels of water <strong>in</strong>put (black column = 1,147mm, darkly shaded column = 772 mm, and lightly shadedcolumn = 632 mm). Unpublished data, IRRI.2001, yield under aerobic conditions was 86% ofthat under flooded conditions, but this graduallydecl<strong>in</strong>ed until it was only 45% <strong>in</strong> 2005. In 2003,half of the flooded fields were converted to aerobicconditions, and aerobic yields returned to 85% ofthe flooded yields, as <strong>in</strong> the first year, 2001. In 2004,half of the cont<strong>in</strong>uous aerobic fields were left fallowor were flooded for the whole year, and returnedto aerobic conditions <strong>in</strong> 2005. This “restoration”attempt brought aerobic yields back to 65% offlooded yields, and was only partially successful.The mechanisms beh<strong>in</strong>d the gradual yield decl<strong>in</strong>eand the restoration effect are not yet understood,although high levels of the nematode Melodoigynegram<strong>in</strong>icola are found <strong>in</strong> the aerobic <strong>rice</strong> fields(up to 3,000 counts g −1 fresh root) compared withthe flooded fields (6−400 counts g −1 fresh root;unpublished data).In some field experiments and farmers’ fields,nearly complete yield failure has been observed <strong>in</strong>fields where aerobic <strong>rice</strong> was established the veryfirst year (Fig. 3.10). Usually, such fields had a lightsoil texture and a history of be<strong>in</strong>g partially croppedto upland crops or to <strong>rice</strong> under nonflooded conditionsbefore aerobic <strong>rice</strong> got established. Always,nematodes were found when yield failures wereobserved, sometimes aggravated by the presence ofroot aphids, fungi, and/or nutrient disorders. Croprotation is necessary under such conditions, andbreeders are try<strong>in</strong>g to develop aerobic <strong>rice</strong> varietieswith tolerance of these soil sicknesses.33
Ecosystem services andthe environment44.1 Ecosystem servicesAlthough the ma<strong>in</strong> function of <strong>rice</strong> fields is toproduce <strong>rice</strong>, they also provide a range of other“ecosystem services” (also referred to as “multifunctionality”)(Bouman et al 2006a). Ecosystemservices can be grouped <strong>in</strong>to the follow<strong>in</strong>g categories(Millennium Ecosystem Assessment 2005): Provision<strong>in</strong>g (e.g., fresh water and commoditiessuch as food, wood, timber, and fuel) Regulat<strong>in</strong>g (e.g., water purification, and climateand flood regulat<strong>in</strong>g) Support<strong>in</strong>g (e.g., nutrient cycl<strong>in</strong>g, soil formation,primary production) Cultural (e.g., aesthetic, spiritual, educational,recreational)The most important provision<strong>in</strong>g function of<strong>rice</strong> environments is, of course, the production of<strong>rice</strong>. Examples of other provision<strong>in</strong>g services arethe rais<strong>in</strong>g of fish and ducks <strong>in</strong> <strong>rice</strong> fields, ponds, orcanals. Frogs and snails are collected for consumption<strong>in</strong> some countries.As part of regulat<strong>in</strong>g services, bunded <strong>rice</strong>fields may <strong>in</strong>crease the water storage capacity ofcatchments and river bas<strong>in</strong>s, lower the peak flowof rivers, and <strong>in</strong>crease groundwater flow. For example,<strong>in</strong> 1999 and 2000, 20% of the floodwater<strong>in</strong> the lower Mekong River Bas<strong>in</strong> was estimated tobe temporarily stored <strong>in</strong> upstream <strong>rice</strong> fields (Masumoto2004). Other possible regulatory services ofbunded <strong>rice</strong> fields and terraces <strong>in</strong>clude the preventionor mitigation of land subsidence, soil erosion,and landslides (PAWEES 2005). Percolat<strong>in</strong>g waterfrom <strong>rice</strong> fields, canals, and storage reservoirsrecharges groundwater systems (Mitsuno 1982).The moderation of air temperature by <strong>rice</strong> fieldshas been recognized as an important function <strong>in</strong>peri-urban areas where <strong>rice</strong> fields and urban land are<strong>in</strong>term<strong>in</strong>gled (Oue 1994). This function is attributedto relatively high evapotranspiration rates result<strong>in</strong>g<strong>in</strong> reduced ambient temperature of the surround<strong>in</strong>garea <strong>in</strong> summer, and <strong>in</strong> lateral heat emissionfrom the water body <strong>in</strong> w<strong>in</strong>ter. <strong>Rice</strong> can be usedas a desal<strong>in</strong>ization crop because the cont<strong>in</strong>uouslypercolat<strong>in</strong>g water (Chapter 1.3) leaches salts fromthe topsoil (Bhumbla and Abrol 1978). The leachateshould be removed by a good dra<strong>in</strong>age system, orelse there is risk for <strong>in</strong>creased sal<strong>in</strong>ization of thegroundwater. <strong>Rice</strong> soils that are flooded for longperiods of the year contribute to the mitigation ofthe greenhouse effect by tak<strong>in</strong>g CO 2from the atmosphereand sequester<strong>in</strong>g the carbon (C) (Bronson1997a, Dobermann 2003).As a support<strong>in</strong>g service, flooded <strong>rice</strong> fields andirrigation channels form a comprehensive waternetwork, which, together with the contiguous dryland, provides a complex mosaic of landscapes. Irrigated<strong>rice</strong> land has been classified as human-madewetlands by the Ramsar Convention on Wetlands(Ramsar 2004). Surveys show that such landscapessusta<strong>in</strong> a rich biodiversity, <strong>in</strong>clud<strong>in</strong>g unique aswell as threatened species, and also enhance biodiversity<strong>in</strong> urban and peri-urban areas (Fernandoet al 2005).The cultural services of <strong>rice</strong> fields are especiallyvalued <strong>in</strong> Asian countries where, for centuries,<strong>rice</strong> has been the ma<strong>in</strong> staple food and thes<strong>in</strong>gle most important source of employment and<strong>in</strong>come for rural people. Many old k<strong>in</strong>gdoms aswell as small communities have been founded onthe construction of irrigation facilities to stabilize<strong>rice</strong> production. <strong>Rice</strong> affects daily life <strong>in</strong> many waysand the social concept of <strong>rice</strong> culture gives mean<strong>in</strong>gto <strong>rice</strong> beyond its role as an item of production and35
consumption (Hamilton 2003). Many traditionalfestivals and religious practices are associated with<strong>rice</strong> cultivation and <strong>rice</strong> fields are valued for theirscenic beauty.4.2 Environmental impactsThe production of lowland <strong>rice</strong> affects the environment<strong>in</strong> negative ways, such as the emissionof greenhouse gases and water pollution. In thissection, environmental impacts that have a relationshipwith water and the hydrology of <strong>rice</strong> fields aresummarized.4.2.1 Ammonia volatilizationAmmonia (NH 3) volatilization from urea fertilizeris the major pathway of N loss <strong>in</strong> tropical flooded<strong>rice</strong> fields, often caus<strong>in</strong>g losses of 50% or more ofthe applied urea-N (Buresh and De Datta 1990).Ammonia-N emissions from lowland <strong>rice</strong> fields areestimated to be roughly 3.6 Tg per year (comparedwith a total of 9 Tg y −1 emitted from all agriculturalfields), which is some 5−8% of the estimated 45−75Tg of globally emitted ammonia-N per year (Kirk2004). The magnitude of ammonia volatilizationlargely depends on climatic conditions, field waterstatus, and the method of N fertilizer application.Volatilized ammonium can be deposited on theearth by ra<strong>in</strong>, which can lead to soil acidification(Kirk 2004) and un<strong>in</strong>tended N <strong>in</strong>puts <strong>in</strong>to naturalecosystems.4.2.2 Greenhouse gasesIrrigated <strong>rice</strong> systems are a significant s<strong>in</strong>k for atmosphericCO 2(Chapter 4.1), a significant sourceof methane (CH 4), and a small source of nitrousoxide (N 2O). In the early 1980s, it was estimatedthat lowland <strong>rice</strong> fields emitted some 50−100 Tgof methane per year, or about 10−20% of the thenestimated global methane emissions (Kirk 2004).Recent measurements, however, show that many<strong>rice</strong> fields emit substantially less than those <strong>in</strong>vestigated<strong>in</strong> the early 1980s, especially <strong>in</strong> northern Indiaand Ch<strong>in</strong>a. Also, methane emissions have actuallydecreased s<strong>in</strong>ce the early 1980s because of changes<strong>in</strong> crop <strong>management</strong> such as a decreased use oforganic <strong>in</strong>puts (Van der Gon et al 2000). Currentestimates of annual methane emissions from <strong>rice</strong>fields are <strong>in</strong> the range of 20 to 60 Tg, be<strong>in</strong>g 5–10%of total global emissions of about 600 Tg (Kirk2004). The magnitude of methane emissions from<strong>rice</strong> fields is ma<strong>in</strong>ly determ<strong>in</strong>ed by water regime andorganic <strong>in</strong>puts, and to a lesser extent by soil type,weather, tillage, residue <strong>management</strong>, fertilizer use,and <strong>rice</strong> cultivar (Bronson et al 1997a,b, Wassmannet al 2000). Flood<strong>in</strong>g of the soil is a prerequisitefor susta<strong>in</strong>ed emissions of methane. Mid-seasondra<strong>in</strong>age, a common irrigation practice adopted <strong>in</strong>major <strong>rice</strong>-grow<strong>in</strong>g regions <strong>in</strong> Ch<strong>in</strong>a and Japan,greatly reduces methane emissions. Similarly,<strong>rice</strong> environments with an uneven supply of water(for example, those suffer<strong>in</strong>g from water scarcity,Chapter 1.7) have a lower emission potential thanfully <strong>irrigated</strong> <strong>rice</strong>.Few accurate assessments have been made ofemissions of nitrous oxide from <strong>rice</strong> fields (Abao etal 2000, Bronson et al 1997a,b, Dittert et al 2002),and the contribution to global emissions has not yetbeen assessed. In <strong>irrigated</strong> <strong>rice</strong> systems with goodwater control, nitrous oxide emissions are quitesmall except when excessively high fertilizer-Nrates are applied. In <strong>irrigated</strong> <strong>rice</strong> fields, nitrousoxide emissions ma<strong>in</strong>ly occur dur<strong>in</strong>g fallow periodsand immediately after flood<strong>in</strong>g of the soil at the endof the fallow period.4.2.3 <strong>Water</strong> pollutionChanges <strong>in</strong> water quality associated with <strong>rice</strong> productionmay be positive or negative, depend<strong>in</strong>gma<strong>in</strong>ly on <strong>management</strong> practices such as fertilizationand biocide (all chemicals used for crop protection,such as herbicides, pesticides, fungicides, etc.)use. The quality of the water leav<strong>in</strong>g <strong>rice</strong> fields maybe improved as a result of the capacity of the <strong>rice</strong>fields to remove nitrogen and phosphorus (Feng etal 2004, Ikeda and Watanabe 2002). On the otherhand, nitrogen transfer from flooded <strong>rice</strong> fields bydirect flow of dissolved nitrogen through runoffwarrants more attention. High nitrogen pollutionof surface fresh waters can be found <strong>in</strong> <strong>rice</strong>-grow<strong>in</strong>gregions where fertilizer rates are excessivelyhigh, such as <strong>in</strong> Jiangsu Prov<strong>in</strong>ce <strong>in</strong> Ch<strong>in</strong>a (Cuiet al 2000).Contam<strong>in</strong>ation of groundwater may arisefrom the leach<strong>in</strong>g of nitrate or biocides and theirresidues (Bouman et al 2002). Nitrate leach<strong>in</strong>gfrom flooded <strong>rice</strong> fields is quite negligible becauseof rapid denitrification under anaerobic conditions(Buresh and De Datta 1990). For example, <strong>in</strong> thePhilipp<strong>in</strong>es, nitrate pollution of groundwater under<strong>rice</strong>-based cropp<strong>in</strong>g systems surpassed the 10 mgL −1 limit for safe dr<strong>in</strong>k<strong>in</strong>g water only when highly36
fertilized vegetables were <strong>in</strong>cluded <strong>in</strong> the cropp<strong>in</strong>gsystem (Bouman et al 2002). In traditional<strong>rice</strong> systems, relatively few herbicides are used aspuddl<strong>in</strong>g, transplant<strong>in</strong>g, and the pond<strong>in</strong>g of waterare effective weed control measures. Mean biocideuse <strong>in</strong> <strong>irrigated</strong> <strong>rice</strong> varies from some 0.4 kg active<strong>in</strong>gredients (a.i.) ha −1 <strong>in</strong> Tamil Nadu, India, to 3.8kg a.i. ha −1 <strong>in</strong> Zhejiang Prov<strong>in</strong>ce, Ch<strong>in</strong>a (Bouman atal 2002). In the warm and humid conditions of thetropics, volatilization is a major process of biocideloss, especially when biocides are applied on thesurface of water or on wet soil (Sethunathan andSiddaramappa 1978). The relatively high temperaturesfurther favor rapid transformation of the rema<strong>in</strong><strong>in</strong>gbiocides by (photo)chemical and microbialdegradation, but little is known about the toxicity ofthe residues. In case studies <strong>in</strong> the Philipp<strong>in</strong>es, meanbiocide concentrations <strong>in</strong> groundwater underneath<strong>irrigated</strong> <strong>rice</strong>-based cropp<strong>in</strong>g systems were one totwo orders of magnitude below the s<strong>in</strong>gle (0.1 µgL −1 ) and multiple (0.5 µg L −1 ) biocide limits for safedr<strong>in</strong>k<strong>in</strong>g water, although temporary peak concentrationsof 1.14−4.17 µg L −1 were measured (Boumanet al 2002). As for nitrogen, however, biocidesand their residues may be directly transferred toopen water bodies through dra<strong>in</strong>age water flow<strong>in</strong>goverland out of <strong>rice</strong> fields. The potential for waterpollution by biocides is greatly affected by fieldwater <strong>management</strong>. Different water regimes result<strong>in</strong> different pest and weed populations and densities,which farmers may combat with different amountsand types of biocides. Residual biocides <strong>in</strong>teractdifferently with soil under different water regimes(Sethunathan and Siddaramappa 1978).4.3 Effects of water scarcity<strong>Water</strong> scarcity affects not only the ability of <strong>rice</strong>fields to produce food but also the environmentand the other ecosystem services of <strong>rice</strong> fields.Increas<strong>in</strong>g water scarcity is expected to shift <strong>rice</strong>production to more water-abundant delta areas,and to lead to less flooded conditions <strong>in</strong> <strong>rice</strong> fieldsand to the <strong>in</strong>troduction of upland crops that do notrequire flood<strong>in</strong>g. These changes will have environmentalconsequences and will affect the traditionalecosystem services of the <strong>rice</strong> landscape.<strong>Rice</strong> that is not permanently flooded tendsto have more weed growth and a broader weedspectrum than <strong>rice</strong> that is permanently flooded(Mortimer and Hill 1999). It is expected that watershortages will lead to more frequent use of herbicides,which may <strong>in</strong>crease the environmental loadof herbicide residues. With less water, the numbersand types of pests and predators (e.g., spiders) maychange as well as predator-pest relationships. Thepossible shift <strong>in</strong> the use of pesticides by farmers<strong>in</strong> response to these changes, and what this meansfor the environment, is as yet unknown. Moreleach<strong>in</strong>g of nitrate is expected with <strong>in</strong>creased soilaeration (either with grow<strong>in</strong>g <strong>rice</strong> under nonfloodedconditions, or with the shift to upland crops) thanunder flooded conditions. Less methane emissionsare expected under aerobic conditions than underflooded conditions, but higher nitrous oxide emissionsare expected (Bronson et al 1997a,b). However,the relative emissions of these greenhouse gases varywith environment and <strong>management</strong> practices (Dittertet al 2002). Flooded <strong>rice</strong> is effective <strong>in</strong> leach<strong>in</strong>gaccumulated salts from the soil profile, and thechange to more aerobic conditions may result <strong>in</strong><strong>in</strong>creased sal<strong>in</strong>ization.There is little <strong>in</strong>formation on how waterscarcity will affect the ecosystem services of <strong>rice</strong>lands listed <strong>in</strong> Chapter 4.1. There is a grow<strong>in</strong>g recognitionthroughout the <strong>rice</strong>-grow<strong>in</strong>g world that abetter understand<strong>in</strong>g of the ecosystem services ofthe <strong>rice</strong> environment is needed. Although somemethodologies exist to measure and estimate differentservices of agricultural systems, quantify<strong>in</strong>gand valu<strong>in</strong>g the positive and negative externalitiesstill presents a major challenge. In many countries,relevant data at the appropriate geographic levelare not available.37
Irrigation systems55.1 <strong>Water</strong> flows <strong>in</strong> irrigation systemsIrrigated <strong>rice</strong> fields are characterized by large volumesof outflows by surface dra<strong>in</strong>age, seepage, andpercolation (Chapter 1.3). Although these outflowsare losses from an <strong>in</strong>dividual field, there is greatscope for reuse of these flows with<strong>in</strong> a landscapethat consists of many <strong>in</strong>terconnected fields (Fig.5.1). Surface dra<strong>in</strong>age and seepage water usuallyflow <strong>in</strong>to downstream fields and the loss of onefield is the ga<strong>in</strong> of another. At the bottom of atoposequence, these flows enter dra<strong>in</strong>s or ditches.However, farmers can use small pumps to lift waterfrom dra<strong>in</strong>s to irrigate fields that are <strong>in</strong>adequately,or not, serviced by irrigation canals. In many irrigationsystems <strong>in</strong> low-ly<strong>in</strong>g deltas or flood pla<strong>in</strong>swith impeded dra<strong>in</strong>age, the cont<strong>in</strong>uous percolationof water (from fields, but also from canals) has createdshallow groundwater tables close to the surfacethat may directly provide the <strong>rice</strong> crop with water(Chapter 1.4). Aga<strong>in</strong>, farmers can either directlypump water up from the shallow groundwater orpump groundwater when it becomes surface wateras it flows <strong>in</strong>to creeks or dra<strong>in</strong>s.Irrigation channelSDDDDra<strong>in</strong>age channelPPPSPSPSGroundwater<strong>in</strong>flowPumpPumpGroundwateroutflowFig. 5.1. Surface and subsurface water flows across a toposequence of <strong>rice</strong> fields. D = dra<strong>in</strong>age (overbund flow), I = irrigation,P = percolation, S = seepage.39
<strong>Water</strong> reuse (10 6 m 3 )100908070605040302010005,000 10,000 15,000 20,000Area (ha)y = 0.0046x + 0.8885R 2 = 0.9049y = 0.0013x + 1.1412R 2 = 0.9174Fig. 5.2. Volume of reuse of surface water by check dams( ) and by groundwater pump<strong>in</strong>g ( ) versus spatial scale <strong>in</strong>District I of UPRIIS. The l<strong>in</strong>es are l<strong>in</strong>ear regressions. Datafrom Hafeez (2003).<strong>Water</strong> productivity (g gra<strong>in</strong> kg –1 water)0.200.180.160.140.120.100.080.060.040.020.000y = (7 × 10 –6 )x + 0.0561R 2 = 0.8465,000 10,000 15,000 20,000Area (ha)Fig. 5.3. <strong>Water</strong> productivity (WP IR; g <strong>rice</strong> gra<strong>in</strong>s kg –1 watersupplied (irrigation plus ra<strong>in</strong>fall)) versus spatial scale <strong>in</strong>District I of UPRIIS. The l<strong>in</strong>e is a l<strong>in</strong>ear regression. Theabsolute values of WP IRare low (compare with values <strong>in</strong>Chapter 1.5) because a lot of water still flows out of the area(dra<strong>in</strong>age water) but is reused by downstream irrigators. Datafrom Hafeez (2003).Recent studies of <strong>rice</strong>-based irrigation systems<strong>in</strong> Ch<strong>in</strong>a and the Philipp<strong>in</strong>es <strong>in</strong>dicate that manywater performance <strong>in</strong>dicators (such as water productivity,fraction of applied water used by the crop)improve with <strong>in</strong>creas<strong>in</strong>g spatial scale because of thereuse of water (Hafeez 2003, Loeve et al 2004a,b).Much of this reuse is done <strong>in</strong>formally by farmerswho take their own <strong>in</strong>itiative to pump water, blockdra<strong>in</strong>age waterways, or construct small on-farm reservoirsfor secondary storage. Most of these farmersare found <strong>in</strong> tail-end portions of irrigation systemswhere water does not reach because too much wateris lost upstream (e.g., by upstream farmers tak<strong>in</strong>gtoo much water, by canal seepage losses, and byoperational losses). Hafeez et al (2007) reportedquantitative data on water reuse on 18,000 ha ofDistrict I of the <strong>rice</strong>-based Upper Pampanga RiverIntegrated Irrigation System (UPRIIS) <strong>in</strong> CentralLuzon, Philipp<strong>in</strong>es. A total of 16 check dams werefound for reuse of surface dra<strong>in</strong>age water, and12% of all farmers owned a pump for groundwaterextraction. In the whole study area, 57% of all availablesurface water was reused by the check damsand 17% through pump<strong>in</strong>g. The amount of waterpumped from the groundwater was about 30% ofthe groundwater recharge by percolation from <strong>rice</strong>fields. Figure 5.2 shows that the amount of waterreused by the check dams and by pump<strong>in</strong>g <strong>in</strong>creasedwith spatial scale (because, with <strong>in</strong>creas<strong>in</strong>g scale,the options for reuse <strong>in</strong>crease). Because of this<strong>in</strong>crease <strong>in</strong> water reuse with <strong>in</strong>creas<strong>in</strong>g scale, thewater productivity <strong>in</strong>creased with spatial scale aswell (Fig. 5.3).Although water can be efficiently reused thisway, it does, however, come at a cost, especiallyto downstream farmers. The current debate on theimprovement of irrigation systems focuses on therelative benefits and costs of system modernizationvis-à-vis those of <strong>in</strong>ternal and (mostly <strong>in</strong>formal)reuse of water. System modernization aims to improvethe irrigation system delivery <strong>in</strong>frastructureand operation scheme to supply each farmer withthe right amount of water at the right time. Ga<strong>in</strong>s<strong>in</strong> water productivity are possible by provid<strong>in</strong>gmore reliable irrigation supplies, for example,through precision technology and the <strong>in</strong>troductionof on-demand delivery of irrigation supplies (e.g.,Gleick 2000, Rosegrant 1997). The argument isthat when farmers have control over tim<strong>in</strong>g andamount of water supplies to their farm, they neednot take their turn <strong>in</strong> a fixed rotational scheduleof deliveries if the soil is still wet from ra<strong>in</strong>fall.Match<strong>in</strong>g system delivery and field-level demandneeds further research, as optimal schedul<strong>in</strong>g ofirrigations is difficult when a large part of the cropwater requirement is met from ra<strong>in</strong>fall. This isespecially true <strong>in</strong> large irrigation systems with aconsiderable time lag between diversion of waterat the source (river or reservoir) and its arrival atthe farmer’s gate. In some parts of Ch<strong>in</strong>a, although40
the ma<strong>in</strong> system is supply-driven, farmers havecontrol over the tim<strong>in</strong>g and amount of water at thefarm gate because water is stored <strong>in</strong> small farmponds, which can also provide water for other uses(Mushtaq et al 2006).5.2 Field versus irrigation system levelThe relationships between water use at the fieldand at the irrigation system level are complex and<strong>in</strong>volve hydrological, <strong>in</strong>frastructural, and economicaspects. At the field level, farmers can reduce waterlosses by adopt<strong>in</strong>g water-sav<strong>in</strong>g technologies(Chapter 3). If they pay for the cost of the waterthey use, they can thereby <strong>in</strong>crease the profitabilityof <strong>rice</strong> farm<strong>in</strong>g. At the irrigation system level, theadoption of field-level water-sav<strong>in</strong>g technologieswill reduce the total amount of water lost as evaporation,but by relatively small amounts only. Mostof the water saved at the field level is by reducedseepage, percolation, and dra<strong>in</strong>age flows. On theone hand, this results <strong>in</strong> more water reta<strong>in</strong>ed at thesurface (<strong>in</strong> the irrigation canals), which is availablefor downstream farmers. On the other hand,it reduces the amount of water re-enter<strong>in</strong>g the hydrologicalcycle and thus reduces the options for<strong>in</strong>formal reuse downstream. Reduc<strong>in</strong>g percolationfrom <strong>rice</strong> fields can lower groundwater tables. Thiscan adversely affect yields s<strong>in</strong>ce <strong>rice</strong> plants may beless able to extract water directly from the groundwater(Chapter 1.4; Belder et al 2004). Deepergroundwater tables will also <strong>in</strong>crease the cost ofpump<strong>in</strong>g for reuse downstream. Any adoption ofwater-sav<strong>in</strong>g technologies requires considerablewater control by the farmers. This is not much ofa problem for farmers us<strong>in</strong>g their own pump, butit is so for farmers <strong>in</strong> large-scale surface irrigationsystems that lack flexibility <strong>in</strong>, and reliability of,water delivery. It is also a problem for farmers us<strong>in</strong>gelectricity to pump groundwater where supplies areunreliable, as <strong>in</strong> northwest India. To allow farmersto profit from water-sav<strong>in</strong>g technologies, suchirrigation systems need to be modernized, whichcomes at an economic cost.The “beneficiaries” of water sav<strong>in</strong>gs at thefield and irrigation system level are different <strong>in</strong> mostcases. At the irrigation system level, the irrigationsystem <strong>management</strong> can save water <strong>in</strong> agricultureand use this water for other purposes such as hydropowergeneration or <strong>in</strong>dustry. Farmers will be<strong>in</strong>terested <strong>in</strong> sav<strong>in</strong>g water only if they can derivebenefits such as reduced irrigation costs. A detaileddiscussion of motives to save water is presented <strong>in</strong>Chapter 1.7.5.3 Integrated approachesApproaches that <strong>in</strong>tegrate agronomic measures,improved policies, <strong>in</strong>stitutional reforms, and <strong>in</strong>frastructuralupgrad<strong>in</strong>gs may have the best chance ofsuccessfully respond<strong>in</strong>g to water scarcity. A recentsuccess story is the Zanghe Irrigation System (ZIS)<strong>in</strong> the middle reaches of the Yangtze Bas<strong>in</strong> <strong>in</strong> Ch<strong>in</strong>a(Loeve et al 2004a,b). ZIS has a command area ofabout 160,000 ha and services ma<strong>in</strong>ly <strong>rice</strong> <strong>in</strong> thesummer season. S<strong>in</strong>ce the early 1970s, the amountof water released to agriculture has been steadilyreduced <strong>in</strong> favor of <strong>in</strong>creased releases to cities,<strong>in</strong>dustry, and hydropower (Fig. 5.4). S<strong>in</strong>ce the mid-1990s, the amount of water received by agriculturehas been less than 30% of the amount received <strong>in</strong>the early 1970s. In the same period, however, total<strong>rice</strong> production has <strong>in</strong>creased, with a productionpeak of around 650,000 tons <strong>in</strong> the late eighties thatwas nearly twice the amount produced <strong>in</strong> the latesixties. Although <strong>rice</strong> production has leveled off toa stable 500,000 tons <strong>in</strong> the last decade, more <strong>rice</strong>has been produced with less water over the past 30years. This feat has been accomplished by a varietyof <strong>in</strong>tegrated measures (Dong et al 2004, Hong etal 2001, Loeve et al 2001, 2004a,b, Mushtaq et al2006, Moya et al 2004): Double <strong>rice</strong> cropp<strong>in</strong>g has been replaced bymore water-efficient s<strong>in</strong>gle <strong>rice</strong> cropp<strong>in</strong>g.This was possible because of the availabilityof modern short-duration high-yield<strong>in</strong>g varieties. The alternate wett<strong>in</strong>g-dry<strong>in</strong>g water-sav<strong>in</strong>gtechnology has been promoted and widelyadopted. Policies, such as volumetric water pric<strong>in</strong>g,and <strong>in</strong>stitutional reforms, such as water-userassociations, have been <strong>in</strong>troduced that driveand promote efficient use of water by farmers. The irrigation system has been upgraded (e.g.,canal l<strong>in</strong><strong>in</strong>g). Secondary storage has been developedthrough the creation of thousands of small- tolarge-size ponds and reservoirs.The ZIS case study suggests that w<strong>in</strong>-w<strong>in</strong>situations can exist where <strong>rice</strong> production can be41
<strong>Water</strong> for irrigation (10 6 m 3 )1,4001,200<strong>Rice</strong> production (000 t)8007001,000<strong>Water</strong>600800600400200019651969 1973 1977 1981 1985 1989 1993 1997 2001Year<strong>Rice</strong>5004003002001000Fig. 5.4. Total <strong>rice</strong> production and irrigation water supply <strong>in</strong> Zanghe Irrigation System, Hubei, Ch<strong>in</strong>a, between 1965 and2002. Data po<strong>in</strong>ts are 5-year mov<strong>in</strong>g averages. See also Fig. 1.6B from Hong et al (2001).ma<strong>in</strong>ta<strong>in</strong>ed, or even <strong>in</strong>creased, while free<strong>in</strong>g upwater for other purposes.5.4 Irrigation system <strong>management</strong>When water is scarcer than land, it may be beneficialto maximize water productivity rather than landproductivity (which is yield; kg ha −1 ) <strong>in</strong> irrigationsystem <strong>management</strong>. Take, for example, a typical<strong>rice</strong>-based irrigation system that faces water shortage<strong>in</strong> the ma<strong>in</strong> reservoir. A usual response optionof the irrigation system manager is to programless area for irrigation than the designed commandarea. In practice, this means that upstream farmerswould get sufficient water for flooded <strong>rice</strong> production,and downstream farmers would not get anywater at all and their land would be left fallow.However, to maximize total production from theirrigation system, and to improve equity amongfarmers, it would be more beneficial to spread outthe available amount of water over the completecommand area and “impose” some water scarcity onall farmers. Instead of upstream farmers practic<strong>in</strong>gcont<strong>in</strong>uously flooded irrigation, and downstreamfarmers hav<strong>in</strong>g no water at all, there could be amix of farmers grow<strong>in</strong>g flooded <strong>rice</strong> and adopt<strong>in</strong>ga water-sav<strong>in</strong>g technology such as AWD. Table 5.1quantifies the water use and total <strong>rice</strong> production ofa hypothetical irrigation system <strong>in</strong> two contrast<strong>in</strong>gscenarios of water distribution. The productivityand water-use parameters of flooded <strong>rice</strong> and AWD<strong>rice</strong> used <strong>in</strong> our example are taken from Table 3.2(Guimba, 1989 data), and are repeated <strong>in</strong> Table 5.2.To simplify the calculations, we assume there is nora<strong>in</strong>fall and that all water is supplied by irrigation.The system is 10,000 ha, with a storage capacity ofthe reservoir of 168 10 6 m 3 . With a full reservoir,this amount of water is sufficient to have 10,000 haof flooded <strong>rice</strong>, produc<strong>in</strong>g a total of 58 10 3 tons of<strong>rice</strong>. Suppose there is a water scarcity and that thereservoir is filled only to 80%, stor<strong>in</strong>g 134 10 6 m 3of water. In scenario I, only 80% of the commandarea receives water, allow<strong>in</strong>g these farmers to growflooded <strong>rice</strong>, whereas the rema<strong>in</strong><strong>in</strong>g 20% is leftfallow. In scenario II, 65% of the command areareceives the “full” amount of water, allow<strong>in</strong>g thesefarmers to grow flooded <strong>rice</strong>, and the rema<strong>in</strong><strong>in</strong>g35% receives a reduced amount that is sufficientto grow <strong>rice</strong> under AWD. In scenario I, the total<strong>rice</strong> production <strong>in</strong> the irrigation system is 46 10 3tons, and, <strong>in</strong> scenario II, it is 53 10 3 tons. Moreover,there is more equity among the farmers <strong>in</strong> scenarioII than <strong>in</strong> scenario I.The above example is quite simple (and ignoresthe complexities of diversified cropp<strong>in</strong>g and of systemsoperation to allow farmers to practice AWD)42
Table 5.1. Area, water use, and total production of flooded <strong>rice</strong> and of <strong>rice</strong> grown under AWD, <strong>in</strong> ahypothetical irrigation scheme of 10,000 ha with 134 10 6 m 3 of water available.Land use Area (ha) <strong>Water</strong> use (10 6 m 3 ) Production (tons)Scenario I (80% farmers, flooded <strong>rice</strong>; 20% farmers, no crop)Flooded 8,000 134 46,400AWD 0 0 0Fallow 2,000 0 0Sum 10,000 134 46,400Scenario II (65% of farmers, flooded <strong>rice</strong>; 35% farmers, AWD)Flooded 6,560 110 38,048AWD 3,440 24 14,852Fallow 0 0 0Sum 10,000 134 52,900Table 5.2. Yield, water productivity with respect to total water <strong>in</strong>put (WP IR), and water <strong>in</strong>put of flooded<strong>rice</strong> and <strong>rice</strong> grown under AWD (from Table 3.2, Guimba 1989).Yield (t ha −1 ) WP IR(kg m −3 ) <strong>Water</strong> use (m 3 ha −1 )Flooded 5.8 0.345 1,679AWD 4.3 0.614 700Table 5.3. Area under <strong>rice</strong> production, and total water use, <strong>rice</strong> production, and number of farmers,with flooded <strong>rice</strong> and with AWD as design criteria.Design criterion<strong>Rice</strong> area <strong>Water</strong> use Production Farmers(ha) (10 6 m 3 ) (tons) (number)Flooded 10,000 168 58,000 10,000AWD 23,986 168 103,000 23,986but illustrates the effect of <strong>in</strong>clud<strong>in</strong>g the conceptof water productivity (besides yield) <strong>in</strong> irrigationsystem <strong>management</strong>.5.5 Irrigation system designAWD irrigation can be taken as a start<strong>in</strong>g po<strong>in</strong>t <strong>in</strong>the design of a new irrigation system. Suppose thata hypothetical reservoir can be constructed with acapacity of 168 10 6 m 3 , and that a command areawill be designed for <strong>rice</strong> farmers gett<strong>in</strong>g 1 ha each.If AWD irrigation is the design criterion ratherthan flooded <strong>rice</strong>, the <strong>irrigated</strong> <strong>rice</strong> area and total<strong>rice</strong> production are larger, and more farmers willbenefit from irrigation development (Table 5.3).If reuse of percolation and dra<strong>in</strong>age water is taken<strong>in</strong>to consideration <strong>in</strong> the design, the <strong>rice</strong> area underirrigation can <strong>in</strong>crease further <strong>in</strong> both scenarios.With 100% reuse of water, the <strong>irrigated</strong> <strong>rice</strong> areaswould be similar <strong>in</strong> both scenarios s<strong>in</strong>ce AWDmostly saves water by reduc<strong>in</strong>g percolation flows(that can be reused) and only a little by reduc<strong>in</strong>gevaporation (which cannot be reduced). However,100% water reuse is <strong>in</strong> practice not atta<strong>in</strong>able andthe implementation of AWD would lead to thelargest area under irrigation.This example demonstrates the impact thatwater-sav<strong>in</strong>g technologies can have on irrigationsystem design. Rather than tak<strong>in</strong>g cont<strong>in</strong>uous flood<strong>in</strong>gof fields as a design criterion, a rotation of waterdelivery can be used that is designed to let the fieldsdry out for a few days dur<strong>in</strong>g each rotation cycle.43
Field water requirements dur<strong>in</strong>g the flooded daysshould be based on evapotranspiration, seepage, andpercolation, whereas, dur<strong>in</strong>g the nonflooded days,they can be based on evapotranspiration alone.A system can also be designed to maximizethe reuse of seepage and percolation water as muchas possible through check dams and pump<strong>in</strong>g. Ifthere is a sal<strong>in</strong>ization hazard, care should be takento avoid us<strong>in</strong>g water that has become too sal<strong>in</strong>e byreuse through judicious mix<strong>in</strong>g of dra<strong>in</strong>age andfresh water.Construction of field channels (irrigation,dra<strong>in</strong>age) and land level<strong>in</strong>g should be considered tofacilitate good water <strong>management</strong>. Farmers <strong>in</strong> a newirrigation system should be tra<strong>in</strong>ed <strong>in</strong> sound water<strong>management</strong> practices such as those detailed <strong>in</strong> thismanual (bund ma<strong>in</strong>tenance, crack plow<strong>in</strong>g, etc.).44
Appendix: InstrumentationDetailed descriptions and user guides of equipmentto measure water flows and soil physical andhydrological properties of <strong>rice</strong> soils are given byIRRI (1987) and Wopereis et al (1994). Calculationand measurement procedures for evapotranspirationare given by FAO (1998). Here, we <strong>in</strong>troduce twosimple tools that are practical <strong>in</strong> characteriz<strong>in</strong>g thewater status (hydrological conditions) of <strong>rice</strong> fieldsand can help guide the implementation of watersav<strong>in</strong>gtechnologies.A.1 Field water tubeThe field water tube is used to measure the depth ofstand<strong>in</strong>g water on the field, be it on top of the surfaceor just below the surface (Fig. A.1). PerforateWith stand<strong>in</strong>g wateron top of the surface:read this20-cm-diameter PVC pipeUse a ruler tomeasure water depth15 cmSoil surfacePuddledtopsoil20 cmWith water belowthe soil surface:read thisPlow panHoles are 5 mm <strong>in</strong> diameter,and spaced 2 cm apartFig. A.1. Field water tube for monitor<strong>in</strong>g the depth of stand<strong>in</strong>g water on a <strong>rice</strong> field.45
Fig. A.2. Groundwatertube for monitor<strong>in</strong>ggroundwater depth below<strong>rice</strong> fields.Cover(used t<strong>in</strong> can)5-cm-diameter PVCpipeBund surface50 cmReadhere100 cm 200 cmMeasur<strong>in</strong>gdeviceGroundwater levelHoles are 5 mm<strong>in</strong> diameter, 2 cm apart50 cma hollow and bottomless PVC-tube of about 20 cm<strong>in</strong> diameter and 35 cm long with small holes us<strong>in</strong>g adrill. The holes should be about 0.5 cm <strong>in</strong> diameterand spaced 2 cm apart. Install this tube <strong>in</strong> the fieldso that the bottom of the tube is buried <strong>in</strong> the plowsole (about 20 cm deep) and that some 15 cm ofthe tube protrudes above the soil surface. Removethe soil from <strong>in</strong>side the tube down to the bottom ofthe tube. <strong>Water</strong> will flow through the holes <strong>in</strong>to thetube, so that the water level <strong>in</strong>side the tube is thesame as outside. After irrigation, the level of thewater <strong>in</strong> the tube can be seen go<strong>in</strong>g down every day.The tube can be placed at the side of the field closeto the bund (but at least 1 m away from the bund),so it is easy to record the water depth (no need towalk very deep <strong>in</strong>to the field). Make sure that thespot chosen to <strong>in</strong>stall the tube is representative forthe whole field (don’t place it <strong>in</strong> a depression or <strong>in</strong>an elevated patch).The water depth is measured from the top ofthe tube to the level of the water <strong>in</strong> the field us<strong>in</strong>ga simple ruler. Subtract 15 cm from the read<strong>in</strong>g toobta<strong>in</strong> the depth of ponded water. A negative valuemeans that the water is stand<strong>in</strong>g on the field; a positivevalue means that the water level is below thesurface. To make the measurement more accurate,the height of the tube protrud<strong>in</strong>g above the surfacecan be measured a few times dur<strong>in</strong>g the season tocheck whether it is 15 cm.A.2 Groundwater tubeThe groundwater tube is used to measure the depthof the groundwater below the <strong>rice</strong> fields (Fig. A.2).Cut a length of 175 to 250 cm of hollow and bottomlessPVC-tube of about 5 cm <strong>in</strong> diameter. Use adrill to make holes along a section of 50-cm lengthat one end of the tube. The holes should be about46
0.5 cm <strong>in</strong> diameter and spaced 2 cm apart. Wrapthe perforated part of the tube <strong>in</strong> rough cloth suchas an old jute sack to prevent the holes from gett<strong>in</strong>gclogged. Install this tube <strong>in</strong> a good and solid bundbetween the <strong>rice</strong> fields so that the tube protrudesabout 50 cm above the soil surface. An auger drillcan be used to drill the hole to place the tube <strong>in</strong>.Once the tube is <strong>in</strong>stalled, any groundwater willflow through the holes <strong>in</strong>to the tube, so that thewater level <strong>in</strong>side the tube <strong>in</strong>dicates the depth ofthe groundwater. Place a cap (can be made of anold t<strong>in</strong>) on top of the tube to prevent anyth<strong>in</strong>g fromfall<strong>in</strong>g <strong>in</strong> and block<strong>in</strong>g the tube.The water depth is measured from the top ofthe tube to the level of the water <strong>in</strong> the field us<strong>in</strong>ga long stick or a piece of bamboo. Subtract 50 cmfrom the read<strong>in</strong>g to obta<strong>in</strong> the depth of the groundwater(if the height of the tube above the bundis different from 50 cm, subtract the real height<strong>in</strong>stead of 50 cm). A negative value means that thegroundwater has risen above the bund and that thearea is flooded. To make the measurement moreaccurate, the height of the tube protrud<strong>in</strong>g abovethe bund can be measured a few times dur<strong>in</strong>g theseason to check whether it is 50 cm. To relate themeasured groundwater depth to the soil surface ofthe fields, subtract the height of the bunds from themeasurements. For example, with a bund height of20 cm, a groundwater depth of 100 cm below thebund equals a groundwater depth of 80 cm belowthe <strong>rice</strong> field.47
ReferencesAbao Jr EB, Bronson KF, Wassmann R, S<strong>in</strong>gh U. 2000.Simultaneous records of methane and nitrous oxideemissions <strong>in</strong> <strong>rice</strong>-based cropp<strong>in</strong>g systems underra<strong>in</strong>fed conditions. Nutr. Cycl. Agroecosyst. 58:131-139.Ahmed KM, Bhattacharya P, Hasan MA, Akhter SH, AlamSMM, Bhuyian MAH, Imam MB, Khan AA, SracekO. 2004. Arsenic enrichment <strong>in</strong> groundwater of thealluvial aquifers <strong>in</strong> Bangladesh: an overview. Appl.Geochem. 19:181-200.Atl<strong>in</strong> GN, Lafitte HR, Tao D, Laza M, Amante M, CourtoisB. 2006. Develop<strong>in</strong>g <strong>rice</strong> cultivars for high-fertilityupland systems <strong>in</strong> the Asian tropics. Field CropsRes. 97:43-52.Balasubramanian V, Ladha JK, Gupta R, Naresh RK,Mehla RK, Bijay-S<strong>in</strong>gh, Yadv<strong>in</strong>der-S<strong>in</strong>gh. 2003.Technology options for <strong>rice</strong> <strong>in</strong> the <strong>rice</strong>-wheat system<strong>in</strong> South Asia. In: Ladha JK, Hill JE, Duxbury JM,Gupta RK, Buresh RJ, editors. Improv<strong>in</strong>g the productivityand susta<strong>in</strong>ability of <strong>rice</strong>-wheat systems:issues and impacts. ASA Special Publication 65,ASA Inc., CSSA Inc., SSSA Inc., Madison, Wis.,USA. p 115-147.Belder P, Bouman BAM, Spiertz JHJ, Cabangon R, GuoanL, Quilang EJP, Li Yuanhua, Tuong, TP. 2004. Effectof water and nitrogen <strong>management</strong> on water useand yield of <strong>irrigated</strong> <strong>rice</strong>. Agric. <strong>Water</strong> Manage.65:193-210.Belder P, Bouman BAM, Spiertz JHJ, Lu G. 2007. Compar<strong>in</strong>goptions for water sav<strong>in</strong>gs <strong>in</strong> lowland <strong>rice</strong> us<strong>in</strong>g amodel<strong>in</strong>g approach. Agric. Syst. 92:91-114.Bhumbla DR, Abrol IP. 1978. Sal<strong>in</strong>e and sodic soils. In:Soils and <strong>rice</strong>. Los Baños (Philipp<strong>in</strong>es): International<strong>Rice</strong> Research Institute. p 719-738.Blackwell J, Meyer WS, Smith RG. 1985. Growth and yieldof <strong>rice</strong> under spr<strong>in</strong>kler irrigation on a free-dra<strong>in</strong><strong>in</strong>gsoil. Aust. J. Exp. Agric. 25:636-641.Borell A, Garside A, Fukai S. 1997. Improv<strong>in</strong>g efficiencyof water for <strong>irrigated</strong> <strong>rice</strong> <strong>in</strong> a semi-arid tropical environment.Field Crops Res. 52:231-248.Bouman BAM. 2001. <strong>Water</strong>-efficient <strong>management</strong>strategies <strong>in</strong> <strong>rice</strong> production. Int. <strong>Rice</strong> Res. Notes16(2):17-22.Bouman BAM. 2007. A conceptual framework for theimprovement of crop water productivity at differentspatial scales. Agric. Syst. 93:43-60.Bouman BAM, Tuong TP. 2001. Field water <strong>management</strong>to save water and <strong>in</strong>crease its productivity <strong>in</strong> <strong>irrigated</strong><strong>rice</strong>. Agric. <strong>Water</strong> Manage. 49:11-30.Bouman BAM, Kropff MJ, Tuong TP, Wopereis MCS,Ten Berge, HFM, Van Laar HH., 2001. ORYZA2000:model<strong>in</strong>g lowland <strong>rice</strong>. International <strong>Rice</strong> ResearchInstitute, Los Baños, Philipp<strong>in</strong>es, and Wagen<strong>in</strong>genUniversity and Research Centre, Wagen<strong>in</strong>gen, Netherlands.235 p.Bouman BAM, Castañeda A, Bhuiyan SI. 2002. Nitrateand pesticide contam<strong>in</strong>ation of groundwater under<strong>rice</strong>-based cropp<strong>in</strong>g systems: evidence from the Philipp<strong>in</strong>es.Agric. Ecosyst. Environ. 92:185-199.Bouman BAM, Peng S, Castaneda AR, Visperas RM. 2005.Yield and water use of <strong>irrigated</strong> tropical aerobic <strong>rice</strong>systems. Agric. <strong>Water</strong> Manage. 74:87-105.Bouman BAM, Humphreys E, Tuong TP, Barker R. 2006a.<strong>Rice</strong> and water. Adv. Agron. 92:187-237.Bouman BAM, Yang Xiaoguang, Wang Huaqi, WangZhim<strong>in</strong>, Zhao Junfang, Chen B<strong>in</strong>. 2006b. Performanceof temperate <strong>rice</strong> varieties under <strong>irrigated</strong> aerobic conditions<strong>in</strong> North Ch<strong>in</strong>a. Field Crops Res. 97:53-65.Bouman BAM, Feng L, Tuong TP, Lu G, Wang H, FengY. 2007. Explor<strong>in</strong>g options to grow <strong>rice</strong> under watershortconditions <strong>in</strong> northern Ch<strong>in</strong>a us<strong>in</strong>g a modell<strong>in</strong>gapproach. II. Quantify<strong>in</strong>g yield, water balancecomponents, and water productivity. Agric. <strong>Water</strong>Manage. 88:23-33.Bronson KF, Neue HU, S<strong>in</strong>gh U, Abao EBJ. 1997a.Automated chamber measurement of methane andnitrous oxide flux <strong>in</strong> flooded <strong>rice</strong> soil. I. Residue,nitrogen, and water <strong>management</strong>. Soil Sci. Soc. Am.J. 61:981-987.49
Bronson KF, S<strong>in</strong>gh U, Neue HU, Abao EBJ. 1997b. Automatedchamber measurement of methane and nitrousoxide flux <strong>in</strong> flooded <strong>rice</strong> soil. II. Fallow period emissions.Soil Sci. Soc. Am. J. 61:988-993.Buresh RJ, De Datta SK. 1990. Denitrification lossesfrom puddled <strong>rice</strong> soils <strong>in</strong> the tropics. Biol. Fertil.Soils 9:1-13.Cabangon RJ, Tuong TP. 2000. Management of crackedsoils for water sav<strong>in</strong>g dur<strong>in</strong>g land preparation for <strong>rice</strong>cultivation. Soil Tillage Res. 56:105-116.Cabangon RJ, Castillo EG, Bao LX, Lu GA, Wang GH,Cui YL, Tuong TP, Bouman BAM, Li YH, ChenCD, Wang ZJ. 2001. Impact of alternate wett<strong>in</strong>g anddry<strong>in</strong>g irrigation on <strong>rice</strong> growth and resource-useefficiency. In: Barker R, Li YH, Tuong TP, editors.<strong>Water</strong>-sav<strong>in</strong>g irrigation for <strong>rice</strong>. Proceed<strong>in</strong>gs of anInternational Workshop held <strong>in</strong> Wuhan, Ch<strong>in</strong>a, 23-25 March 2001. Colombo (Sri Lanka): International<strong>Water</strong> Management Institute. p 55-80.Cabangon RJ, Tuong TP, Abdullah NB. 2002. Compar<strong>in</strong>gwater <strong>in</strong>put and water productivity of transplanted anddirect-seeded <strong>rice</strong> production systems. Agric. <strong>Water</strong>Manage. 57:11-31.Cabangon RJ, Tuong TP, Lu G, Bouman BAM, Feng Y,Zhichuan Z, Chen CD, Wang JC. 2003. Irrigation<strong>management</strong> effects on yield and water productivityof hybrid, <strong>in</strong>bred and aerobic <strong>rice</strong> varieties <strong>in</strong> Ch<strong>in</strong>a.In: Susta<strong>in</strong>able development of water resources and<strong>management</strong> and operation of participatory irrigationorganizations. Shiang-Kueen Hsu, editor. Proceed<strong>in</strong>gsof the 2003 International Commission on Irrigationand Dra<strong>in</strong>age (ICID) Asian Regional Workshopon 10-12 Nov. 2003, Taipei, Taiwan. Volume 1. p184-210.Cabangon RJ, Tuong TP, Castillo EG, Bao LX, Lu G,Wang GH, Cui L, Bouman BAM, Li Y, ChongdeChen, Jianzhang Wang. 2004. Effect of irrigationmethod and N-fertilizer <strong>management</strong> on <strong>rice</strong> yield,water productivity and nutrient-use efficiencies <strong>in</strong>typical lowland <strong>rice</strong> conditions <strong>in</strong> Ch<strong>in</strong>a. <strong>Rice</strong> Field<strong>Water</strong> Environ. 2:195-206.Choudhury BU, Bouman BAM, S<strong>in</strong>gh AK. 2007. Yield andwater productivity of <strong>rice</strong>-wheat on raised beds at NewDelhi, India. Field Crops Res. 100:229-239.Connor DJ, Tims<strong>in</strong>a J, Humphreys E. 2003. Prospects forpermanent beds <strong>in</strong> the <strong>rice</strong>-wheat system. In: LadhaJK, Hill JE, Duxbury JM, Gupta RK, Buresh RJ, editors.Improv<strong>in</strong>g the productivity and susta<strong>in</strong>ability of<strong>rice</strong>-wheat systems: issues and impacts. ASA SpecialPublication 65. ASA Inc., CSSA Inc., SSSA Inc.,Madison, Wis., USA. p 197-210.Cruz RT, O’Toole JC. 1984. Dryland <strong>rice</strong> response toan irrigation gradient at flower<strong>in</strong>g stage. Agron. J.76:178-183.Cui Y, Cheng X, Han C, Li R. 2000. The economic andecological satisfactory amount of nitrogen fertilizerus<strong>in</strong>g on <strong>rice</strong> <strong>in</strong> Tai Lake <strong>Water</strong>shed. Acta Ecol. S<strong>in</strong>.20:659-662. (In Ch<strong>in</strong>ese with English abstract.)Dawe D. 2005. Increas<strong>in</strong>g water productivity <strong>in</strong> <strong>rice</strong>-basedsystems <strong>in</strong> Asia—past trends, current problems, andfuture prospects. Plant Prod. Sci. 8:221-230.Dawe D, Dobermann A, Moya P, Abdulrachman S, BijayS<strong>in</strong>gh, Lal P, Li SY, L<strong>in</strong> B, Panaullah G, Sariam O,S<strong>in</strong>gh Y, Swarup A, Tan PS, Zhen QX. 2000. Howwidespread are yield decl<strong>in</strong>es <strong>in</strong> long-term <strong>rice</strong> experiments<strong>in</strong> Asia? Field Crops Res. 66:175-193.Dawe D, Frolk<strong>in</strong>g S, Changseng Li. 2004. Trends <strong>in</strong> <strong>rice</strong>wheatarea <strong>in</strong> Ch<strong>in</strong>a. Field Crops Res. 87:89-95.De Datta SK. 1981. Pr<strong>in</strong>ciples and practices of <strong>rice</strong> production.Los Baños (Philipp<strong>in</strong>es): International <strong>Rice</strong>Research Institute. 618 p.De Datta SK, Krupp HK, Alvarez EI, Modgal SC. 1973.<strong>Water</strong> <strong>management</strong> <strong>in</strong> flooded <strong>rice</strong>. In: <strong>Water</strong> <strong>management</strong><strong>in</strong> Philipp<strong>in</strong>e irrigation systems: research andoperations. Los Baños (Philipp<strong>in</strong>es): International<strong>Rice</strong> Research Institute. p 1-18.Dittert K, L<strong>in</strong> Shan, Kreye C, Zheng XH, Xu YC, Lu XJ,Shen QR, Fan XL, Sattelmacher B. 2002. Sav<strong>in</strong>gwater with ground cover <strong>rice</strong> production systems(GCRPS) at the p<strong>rice</strong> of <strong>in</strong>creased greenhouse gasemissions? In: Bouman BAM, Hengsdijk H, HardyB, B<strong>in</strong>draban PS, Tuong TP, Ladha JK, editors. <strong>Water</strong>-wise<strong>rice</strong> production. Los Baños (Philipp<strong>in</strong>es):International <strong>Rice</strong> Research Institute. p 197-206.Dobermann A. 2003. A critical assessment of the system of<strong>rice</strong> <strong>in</strong>tensification (SRI). Agric. Syst. 79:261-281.Dobermann A, Witt C, Abdulrachman S, G<strong>in</strong>es HC, NagarajanR, Son TT, Tan PS, Wang GH, Chien NV, ThoaVTK, Phung CV, Stal<strong>in</strong> P, Muthukrishnan P, Ravi V,Babu M, Simbahan GC, Adviento MAA. 2003. Soilfertility and <strong>in</strong>digenous nutrient supply <strong>in</strong> <strong>irrigated</strong><strong>rice</strong> doma<strong>in</strong>s of Asia. Agron. J. 95:913-923.Dong B, Molden D, Loeve R, Li YH, Chen CD, Wang JZ.2004. Farm level practices and water productivity <strong>in</strong>Zanghe Irrigation System. <strong>Rice</strong> Field <strong>Water</strong> Environ.2:217-226.Doorenbos J, Pruit WO. 1984. Guidel<strong>in</strong>es for predict<strong>in</strong>gcrop water requirements. FAO Irrigation and Dra<strong>in</strong>agePaper 24. Rome (Italy): Food and AgricultureOrganization. 144 p.Ehlers W, Goss M. 2003. <strong>Water</strong> dynamics <strong>in</strong> plant production.CABI Publish<strong>in</strong>g, CAB International, Wall<strong>in</strong>gford,UK. 273 p.Ekanayake IJ, De Datta SK, Steponkus PL. 1989. Spikeletsterility and flower<strong>in</strong>g response of <strong>rice</strong> to water stressat anthesis. Ann. Bot. 63:257-264.Falkenmark M, Rockström J. 2004. Balanc<strong>in</strong>g water forhumans and nature: the new approach <strong>in</strong> ecohydrology.London (UK): Earthscan. 247 p.50
FAO (Food and Agriculture Organization). 1998. Cropevaporation: guidel<strong>in</strong>es for comput<strong>in</strong>g crop waterrequirements. Irrigation and Dra<strong>in</strong>age Paper 56. FAO,Rome. 300 p.Feng YW, Yosh<strong>in</strong>aga I, Shiratani E, Hitomi T, HasebeH. 2004. Characteristics and behavior of nutrients<strong>in</strong> a paddy area equipped with a recycl<strong>in</strong>g irrigationsystem. Agric. <strong>Water</strong> Manage. 68:47-60.Feng Lip<strong>in</strong>g, Bouman BAM, Tuong TP, Cabangon RJ, LiYalong, Lu Guoan, Feng Yuehua. 2007. Explor<strong>in</strong>goptions to grow <strong>rice</strong> under water-short conditions <strong>in</strong>northern Ch<strong>in</strong>a us<strong>in</strong>g a modell<strong>in</strong>g approach. I: Fieldexperiments and model evaluation. Agric. <strong>Water</strong>Manage. 88:1-13.Fernando C H, Goltenboth F, Margraf J, editors. 2005.Aquatic ecology of <strong>rice</strong>fields. Volumes Publish<strong>in</strong>g,Kitchener Ontario, Canada. 472 p.George T, Magbanua R, Garrity DP, Tubaña BS, QuitonJ. 2002. Rapid yield loss of <strong>rice</strong> cropped successively<strong>in</strong> aerobic soil. Agron. J. 94:981-989.Gleick PH. 2000. The chang<strong>in</strong>g water paradigm: a lookat twenty-first century water resources development.<strong>Water</strong> Int. 25:127-138.Hafeez MM. 2003. <strong>Water</strong> account<strong>in</strong>g and productivity atdifferent scales <strong>in</strong> a <strong>rice</strong> irrigation system: a remotesens<strong>in</strong>g approach. Ecology and Development Series,No. 8, University of Bonn, Germany. 155 p.Hafeez MM, Bouman BAM, Van de Giesen N, Vlek P.2007. Scale effects on water use and water productivity<strong>in</strong> a <strong>rice</strong>-based irrigation system (UPRIIS) <strong>in</strong> thePhilipp<strong>in</strong>es. Agric. <strong>Water</strong> Manage. 92:81-89.Hamilton RW, editor. 2003. The art of <strong>rice</strong>: spirit and sustenance<strong>in</strong> Asia. UCLA Fowler Museum of CulturalHistory, Los Angeles, Calif., USA. 552 p.Harnpichitvitaya D, Trebuil G, Oberthür T, Pantuwan G,Craig I, Tuong TP, Wade LJ, Suriya-Aruroj D. 2000.Identify<strong>in</strong>g recommendations for subsoil compactionand soil <strong>management</strong> to improve water- and nutrientuseefficiency <strong>in</strong> ra<strong>in</strong>fed lowland <strong>rice</strong>. In: Tuong TP,Kam SP, Wade L, Pandey S, Bouman BAM, HardyB, editors. Characteriz<strong>in</strong>g and understand<strong>in</strong>g ra<strong>in</strong>fedenvironments. Proceed<strong>in</strong>gs of the International Workshopon Characteriz<strong>in</strong>g and Understand<strong>in</strong>g Ra<strong>in</strong>fedEnvironments, 5-9 Dec. 1999, Bali, Indonesia. LosBaños (Philipp<strong>in</strong>es): International <strong>Rice</strong> ResearchInstitute. p 97-110.Hobbs P, Gupta RK. 2003. <strong>Rice</strong>-wheat cropp<strong>in</strong>g systems <strong>in</strong>the Indo-Gangetic Pla<strong>in</strong>s: issues of water productivity.I. Relation to new resource-conserv<strong>in</strong>g technologies.In: Kijne JW, Barker R, Molden D, editors. <strong>Water</strong>productivity <strong>in</strong> agriculture: limits and opportunitiesfor improvement. CABI Publish<strong>in</strong>g, Wall<strong>in</strong>gford,UK. p 239-253.Hong L, Li YH, Deng L, Chen CD, Dawe D, Barker R.2001. Analysis <strong>in</strong> changes <strong>in</strong> water allocation andcrop production <strong>in</strong> the Zanghe Irrigation System andDistrict – 1966 to 1998. In: Barker R, Loeve R, Li YH,Tuong TP, editors. <strong>Water</strong>-sav<strong>in</strong>g irrigation for <strong>rice</strong>.Proceed<strong>in</strong>gs of an <strong>in</strong>ternational workshop, Wuhan,Ch<strong>in</strong>a, 23-25 March 2001. Colombo (Sri Lanka):International <strong>Water</strong> Management Institute. p 11-24.Humphreys E, Meisner C, Gupta R, Tims<strong>in</strong>a J, BeecherHG, Tang Yong Lu, Yadv<strong>in</strong>der-S<strong>in</strong>gh, Gill MA,Masih I, Zheng Jia Guo, Thomposon JA. 2005.<strong>Water</strong> sav<strong>in</strong>gs <strong>in</strong> <strong>rice</strong>-wheat systems. Plant Prod.Sci. 8:242-258.Ikeda M, Watanabe T. 2002. Nitrogen accumulation <strong>in</strong> <strong>rice</strong>field <strong>rice</strong> <strong>irrigated</strong> with water conta<strong>in</strong><strong>in</strong>g ammoniumand nitrate dur<strong>in</strong>g the reproductive growth period.Soil Sci. Plant Nutr. 48:105-109.IRRI (International <strong>Rice</strong> Research Institute). 1987. Physicalmeasurements <strong>in</strong> <strong>rice</strong> soils: the Japanese methodologies.Los Baños (Philipp<strong>in</strong>es): IRRI.Jha KP, D<strong>in</strong>esh Chandra, Challaiah, 1981. Irrigationrequirement of high-yield<strong>in</strong>g <strong>rice</strong> varieties grownon soils hav<strong>in</strong>g shallow water-table. Indian J. Agric.Sci. 51:732-737.Kampen J. 1970. <strong>Water</strong> losses and water balance studies<strong>in</strong> lowland <strong>rice</strong> irrigation. PhD thesis, Cornell University,USA. 416 p.Kirk G. 2004. The biochemistry of submerged soils.Chichester, West Sussex (UK): John Wiley andSons. 291 p.Kukal SS, Humphreys E, Yadv<strong>in</strong>der-S<strong>in</strong>gh, Tims<strong>in</strong>a J,Thaman S. 2006. Performance of raised beds <strong>in</strong><strong>rice</strong>-wheat systems of north west India. In: RothC, Fischer AR, Meisner C, editors. Evaluation andperformance of permanent raised bed systems <strong>in</strong>Asia and Australia. Proceed<strong>in</strong>gs of an InternationalWorkshop, 1-3 March 2005, Griffith, New SouthWales. Canberra (Australia): Australian Center forInternational Agricultural Research. (In press.)Lafitte HR, Bennett J. 2002. Requirements for aerobic<strong>rice</strong>: physiological and molecular considerations. In:Bouman BAM, Hengsdijk H, Hardy B, B<strong>in</strong>drabanPS, Tuong TP, Ladha JK, editors. <strong>Water</strong>-wise <strong>rice</strong>production. Los Baños (Philipp<strong>in</strong>es): International<strong>Rice</strong> Research Institute. p 259-274.Lafitte RH, Courtois B, Arraudeau M. 2002. Genetic improvementof <strong>rice</strong> <strong>in</strong> aerobic systems: progress fromyield to genes. Field Crops Res. 75:171-190.51
Lampayan RM, Bouman BAM, De Dios JL, Lactaoen AT,Espiritu AJ, Norte TM, Quilang EJP, Tabbal DF, LlorcaLP, Soriano JB, Corpuz AA, Malasa RB, VicmudoVR. 2005. Transfer of water sav<strong>in</strong>g technologies <strong>in</strong><strong>rice</strong> production <strong>in</strong> the Philipp<strong>in</strong>es. In: ThiyagarajanTM, Hengsdijk H, B<strong>in</strong>draban P, editors. Transitions <strong>in</strong>agriculture for enhanc<strong>in</strong>g water productivity. Proceed<strong>in</strong>gsof the International Symposium on Transitions <strong>in</strong>Agriculture for Enhanc<strong>in</strong>g <strong>Water</strong> Productivity, 23-25September 2003, Kilikulam, Tamil Nadu AgriculturalUniversity, Tamil Nadu, India. p 111-132.Latif MA, Islam MR, Ali MY, Saleque MA. 2005. Validationof the system of <strong>rice</strong> <strong>in</strong>tensification (SRI) <strong>in</strong>Bangladesh. Field Crops Res. 93:281-292.Li YH, Barker R. 2004. Increas<strong>in</strong>g water productivityfor <strong>rice</strong> field irrigation <strong>in</strong> Ch<strong>in</strong>a. <strong>Rice</strong> Field <strong>Water</strong>Environ. 2:187-193.Lilley JM, Fukai S. 1994. Effect of tim<strong>in</strong>g and severity ofwater deficit on four diverse <strong>rice</strong> cultivars. II. Physiologicalresponses to soil water deficit. Field CropsRes. 37:215-223.Loeve R, Dong B, Zhao JH, Wang JZ, Molden D. 2001.Operations of the Zhanghe Irrigation System. In:<strong>Water</strong>-sav<strong>in</strong>g irrigation for <strong>rice</strong>. Barker R, Loeve R,Li YH, Tuong TP, editors. Proceed<strong>in</strong>gs of an <strong>in</strong>ternationalworkshop, Wuhan, Ch<strong>in</strong>a, 23-25 March 2001.Colombo (Sri Lanka): International <strong>Water</strong> ManagementInstitute. p 25-54.Loeve R, Hong L, Dong B, Mao G, Chen CD, Dawe D,Barker R. 2004a. Long-term trends <strong>in</strong> <strong>in</strong>tersectoralwater allocation and crop water productivity <strong>in</strong>Zanghe and Kaifeng, Ch<strong>in</strong>a. <strong>Rice</strong> Field <strong>Water</strong> Environ.2:237-245.Loeve R, Dong B, Molden D, Li YH, Chen CD, Wang JZ.2004b. Issues of scale <strong>in</strong> water productivity <strong>in</strong> theZhanghe irrigation system: implications for irrigation<strong>in</strong> the bas<strong>in</strong> context. <strong>Rice</strong> Field <strong>Water</strong> Environ.2:227-236.Lövenste<strong>in</strong> H, Lant<strong>in</strong>ga E, Rabb<strong>in</strong>ge R, van Keulen H.1992. Pr<strong>in</strong>ciples of theoretical production ecology.Department of Theoretical Production Ecology,Wagen<strong>in</strong>gen University, Netherlands. 116 p.Maclean JL, Dawe D, Hardy B, Hettel GP, editors. 2002.<strong>Rice</strong> almanac. Los Baños (Philipp<strong>in</strong>es): International<strong>Rice</strong> Research Institute. 253 pp.Masumoto T, Shimizu K, Hai PT. 2004. Roles of floodsfor agricultural production <strong>in</strong> and around Tonle SapLake. ACIAR Production, No. 116, Canberra, Australia,p 136-146.McCauley GN. 1990. Spr<strong>in</strong>kler vs. flooded irrigation <strong>in</strong>traditional <strong>rice</strong> production regions of Southeast Texas.Agron. J. 82:677-683.McDonald AL, Hobbs PR, Riha SJ. 2006. Does the systemof <strong>rice</strong> <strong>in</strong>tensification outperform conventional best<strong>management</strong>? A synopsis of the empirical record.Agric. Syst. 96:31-36.Millennium Ecosystem Assessment. 2005. Ecosystemsand human well-be<strong>in</strong>g: synthesis. Wash<strong>in</strong>gton, D.C.(USA): Island Press. 137 p.Mitsuno T, Kobayashi S, Maruyama T. 1982. Groundwaterrecharge function of paddy fields: a case of groundwaterbalance analysis <strong>in</strong> Nobi Pla<strong>in</strong>. J. Soc. Irrig. Dra<strong>in</strong>ageReclamation Eng. 50:11-18. (In Japanese.)Molden D. 1997. Account<strong>in</strong>g for water use and productivity.SWIM Paper. International <strong>Water</strong> ManagementInstitute, Colombo, Sri Lanka.Moorman FR, van Breemen N. 1978. <strong>Rice</strong>: soil, water,land. Los Baños (Philipp<strong>in</strong>es): International <strong>Rice</strong>Research Institute. 185 p.Mortimer AM, Hill JE. 1999. Weed species shifts <strong>in</strong> responseto broad spectrum herbicides <strong>in</strong> sub-tropicaland tropical crops. Brighton Crop Protection Conference2:425-437.Moser CM, Barett CB. 2003. The disappo<strong>in</strong>t<strong>in</strong>g adoptiondynamics of a yield-<strong>in</strong>creas<strong>in</strong>g, low external-<strong>in</strong>puttechnology: the case of SRI <strong>in</strong> Madagascar. Agric.Syst. 76:1085-1100.Moya P, Hong L, Dawe D, Chongde C. 2004. The impactof on-farm water sav<strong>in</strong>g irrigation techniques on <strong>rice</strong>productivity and profitability <strong>in</strong> Zanghe IrrigationSystem, Hubei, Ch<strong>in</strong>a. <strong>Rice</strong> Field <strong>Water</strong> Environ.2:207-215.Mushtaq S, Dawe D, Hong L<strong>in</strong>, Moya P. 2006. An assessmentof the role of ponds <strong>in</strong> the adoption of watersav<strong>in</strong>girrigation practices <strong>in</strong> the Zanghe IrrigationSystem, Ch<strong>in</strong>a. Agric. <strong>Water</strong> Manage. 83:100-110.Oue H, Fukushima T, Maruyama T. 1994. Temperaturemitigation function of paddy fields. J. Soc. Irrig.Dra<strong>in</strong>age Reclamation Eng. 62:13-18. (In Japanese.)Pandey S, Velasco L. 2002. Economics of direct seed<strong>in</strong>g <strong>in</strong>Asia: pattern of adoption and research priorities. In:Pandey S, Mortimer M, Wade L, Tuong TP, Lopez K,B Hardy, editors. Direct seed<strong>in</strong>g: research strategiesand opportunities. Los Baños (Philipp<strong>in</strong>es): International<strong>Rice</strong> Research Institute. p 3-14.PAWEES (International Society of <strong>Rice</strong> field and <strong>Water</strong>Environment Eng<strong>in</strong>eer<strong>in</strong>g). 2005. Proceed<strong>in</strong>gs of theInternational Conference on Management of <strong>Rice</strong>Field and <strong>Water</strong> Environment for Susta<strong>in</strong>able <strong>Rice</strong>Production, 7-8 September 2005, Kyoto University,Kyoto, Japan. 178 p.Peng S, Bouman BAM, Visperas RM, Castañeda A, NieL, Park H-K. 2006. Comparison between aerobicand flooded <strong>rice</strong>: agronomic performance <strong>in</strong> along-term (8-season) experiment. Field Crops Res.96:252-259.P<strong>in</strong>gali PL, Hossa<strong>in</strong> M, Gerpacio RV. 1997. Asian <strong>rice</strong>bowls: the return<strong>in</strong>g crisis? CAB International, Oxon,UK (<strong>in</strong> association with IRRI, Los Baños, Philipp<strong>in</strong>es).341 p.52
Piñheiro B da S, de Castro E da M, Guimarães CM. 2006.Susta<strong>in</strong>ability and profitability of aerobic <strong>rice</strong> production<strong>in</strong> Brazil. Field Crops Res. 97:34-42.Postel S. 1997. Last oasis: fac<strong>in</strong>g water scarcity. New York(USA): Norton and Company. 239 p.Ramasamy S, ten Berge HFM, Purushothaman S. 1997.Yield formation <strong>in</strong> <strong>rice</strong> <strong>in</strong> response to dra<strong>in</strong>age andnitrogen application. Field Crops Res. 51:65-82.Ramsar. 2004. Ramsar handbooks for the wise use ofwetlands. Handbook 7. Designat<strong>in</strong>g Ramsar sites.http://ramsar.org/lib/lib_handbooks_e.htm.Rijsberman FR. 2006. <strong>Water</strong> scarcity: fact or fiction? Agric.<strong>Water</strong> Manage. 80:5-22.Rosegrant MW. 1997. <strong>Water</strong> resources <strong>in</strong> the twenty-firstcentury: challenges and implications for action. Food,Agriculture, and the Environment Discussion Paper20. International Food Policy Research Institute,Wash<strong>in</strong>gton, D.C., USA.Sanchez PA. 1973. Puddl<strong>in</strong>g tropical <strong>rice</strong> soils. 2. Effectsof water losses. Soil Sci. 115(4):303-308.Sayre KD, Hobbs PR. 2004. The raised-bed system of cultivationfor <strong>irrigated</strong> production conditions. In: Lal R,Hobbs P, Uphoff N, Hansen DO, editors. Susta<strong>in</strong>ableagriculture and the <strong>in</strong>ternational <strong>rice</strong>-wheat system.New York (USA): Marcel Dekker, Inc. p 337-355.Sethunathan N, Siddaramappa R. 1978. Microbial degradationof pesticides <strong>in</strong> <strong>rice</strong> soils. In: Soils and <strong>rice</strong>.Los Baños (Philipp<strong>in</strong>es): International <strong>Rice</strong> ResearchInstitute. p 479-497.Sharma PK, Bhushan Lav, Ladha JK, Naresh RK, GuptaRK, Balasubramanian BV, Bouman BAM. 2002.Crop-water relations <strong>in</strong> <strong>rice</strong>-wheat cropp<strong>in</strong>g underdifferent tillage systems and water-<strong>management</strong>practices <strong>in</strong> a marg<strong>in</strong>ally sodic, medium-textured soil.In: Bouman BAM, Hengsdijk H, Hardy B, B<strong>in</strong>drabanPS, Tuong TP, Ladha JK, editors. <strong>Water</strong>-wise <strong>rice</strong>production. International <strong>Rice</strong> Research Institute, LosBaños, Philipp<strong>in</strong>es. p 223-235.Sheehy JE, Peng S, Dobermann A, Mitchell PL, FerrerA, Jianchang Yang, Y<strong>in</strong>gb<strong>in</strong> Zou, Xuhua Zhong,Jianliang Huang. 2004. Fantastic yields <strong>in</strong> the systemof <strong>rice</strong> <strong>in</strong>tensification: fact or fallacy? Field CropsRes. 88:1-8.Shu Geng, Yix<strong>in</strong>g Zhou, M<strong>in</strong>ghua Zhang, Shawn SmallwoodK. 2001. A susta<strong>in</strong>able agro-ecological solutionto water shortage <strong>in</strong> the North Ch<strong>in</strong>a Pla<strong>in</strong> (HuabeiPla<strong>in</strong>). J. Environ. Plann<strong>in</strong>g Manage. 44:345-355.Simpson HJ, Herczeg AL, Meyer WS. 1992. Stable isotoperatios <strong>in</strong> irrigation water can estimate <strong>rice</strong> cropevaporation. Geophys. Res. Lett. 19:377-380.S<strong>in</strong>clair TR, Cassman KG. 2004. Agronomic UFOs. FieldCrops Res. 88:9-10.S<strong>in</strong>gh RB. 2000. Environmental consequences of agriculturaldevelopment: a case study from the greenrevolution state of Haryana, India. Agric. Ecosyst.Environ. 82:97-103.S<strong>in</strong>gh AK, Choudhury BU, Bouman BAM. 2002. Effectsof <strong>rice</strong> establishment methods on crop performance,water use, and m<strong>in</strong>eral nitrogen. In: Bouman BAM,Hengsdijk H, Hardy B, B<strong>in</strong>draban PS, Tuong TP,Ladha JK, editors. <strong>Water</strong>-wise <strong>rice</strong> production. LosBaños (Philipp<strong>in</strong>es): International <strong>Rice</strong> ResearchInstitute. p 237-246.Stoop W, Uphoff N, Kassam A. 2002. A review of agriculturalresearch issues raised by the system of <strong>rice</strong><strong>in</strong>tensification (SRI) from Madagascar: opportunitiesfor improv<strong>in</strong>g farm<strong>in</strong>g systems for resource-poorfarmers. Agric. Syst. 71:249-274.Surridge C. 2004. Feast or fam<strong>in</strong>e? Nature 428:360-361.Tabbal DF, Bouman BAM, Bhuiyan SI, Sibayan EB, SattarMA. 2002. On-farm strategies for reduc<strong>in</strong>g water<strong>in</strong>put <strong>in</strong> <strong>irrigated</strong> <strong>rice</strong>: case studies <strong>in</strong> the Philipp<strong>in</strong>es.Agric. <strong>Water</strong> Manage. 56:93-112.Tao Hongb<strong>in</strong>, Brueck H, Dittert K, Kreye C, L<strong>in</strong> Shan,Sattelmacher B. 2006. Growth and yield formationof <strong>rice</strong> (Oryza sativa L.) <strong>in</strong> the water-sav<strong>in</strong>g groundcover <strong>rice</strong> production system (GCRPS). Field CropsRes. 95:1-12.Thompson J. 1999. Methods for <strong>in</strong>creas<strong>in</strong>g <strong>rice</strong> water useefficiency. In: <strong>Rice</strong> <strong>Water</strong> Use Efficiency WorkshopProceed<strong>in</strong>gs. Cooperative Research Centre for Susta<strong>in</strong>able<strong>Rice</strong> Production, Leeton, New South Wales,Australia. p 45-46.Thompson JA. 2002. <strong>Water</strong> <strong>management</strong> of <strong>rice</strong> <strong>in</strong> southernNew South Wales, Australia. In: Bouman BAM,Hengsdijk H, Hardy B, B<strong>in</strong>draban PS, Tuong TP,Ladha JK, editors. <strong>Water</strong>-wise <strong>rice</strong> production. LosBaños (Philipp<strong>in</strong>es): International <strong>Rice</strong> ResearchInstitute. p 63-67.Tims<strong>in</strong>a J, Connor DJ. 2001. Productivity and <strong>management</strong>of <strong>rice</strong>-wheat systems: issues and challenges. FieldCrops Res. 69:93-132.Tripathi RP, Kushawa HS, Mishra RK. 1986. Irrigationrequirements of <strong>rice</strong> under shallow water table conditions.Agric. <strong>Water</strong> Manage. 12:127-136.Tuong TP. 1999. Productive water use <strong>in</strong> <strong>rice</strong> production:opportunities and limitations. J. Crop Prod.2:241-264.Tuong TP, Bouman BAM. 2003. <strong>Rice</strong> production <strong>in</strong> waterscarce environments. In: Kijne JW, Barker R, MoldenD, editors. <strong>Water</strong> productivity <strong>in</strong> agriculture: limitsand opportunities for improvement. Wall<strong>in</strong>gford(UK): CABI Publish<strong>in</strong>g. p 53-67.Tuong TP, Wopereis MCS, Marquez J, Kropff MJ. 1994.Mechanisms and control of percolation losses <strong>in</strong><strong>irrigated</strong> puddled <strong>rice</strong> fields. Soil Sci. Soc. Am. J.58:1794-1803.Tuong TP, Bouman BAM, Mortimer M. 2005. More <strong>rice</strong>,less water: <strong>in</strong>tegrated approaches for <strong>in</strong>creas<strong>in</strong>g waterproductivity <strong>in</strong> <strong>irrigated</strong> <strong>rice</strong>-based systems <strong>in</strong> Asia.Plant Prod. Sci. 8:231-241.53
Uphoff N. 2007. Agroecological alternatives: capitalis<strong>in</strong>gon exist<strong>in</strong>g genetic potentials. J. Dev. Studies43:218-236.Van der Gon HAC, Van Bodegom PM, Houwel<strong>in</strong>g S,Verburg P, Van Breemen N. 2000. Comb<strong>in</strong><strong>in</strong>g upscal<strong>in</strong>gand downscal<strong>in</strong>g of methane emissions from <strong>rice</strong>fields: methodologies and prelim<strong>in</strong>ary results. Nutr.Cycl. Agroecosyst. 58:285-301.Ventura W, Watanabe I. 1978. Growth <strong>in</strong>hibition due tocont<strong>in</strong>uous cropp<strong>in</strong>g of dryland <strong>rice</strong> and other crops.Soil Sci. Plant Nutr. 24:375-389.Ventura W, Watanabe I, Castillo MB, dela Cruz A. 1981.Involvement of nematodes <strong>in</strong> the soil sickness of adryland <strong>rice</strong>-based cropp<strong>in</strong>g system. Soil Sci. PlantNutr. 27:305-315.Wang Huaqi, Bouman BAM, Dule Zhao, Wang Changgui,Moya PF. 2002. Aerobic <strong>rice</strong> <strong>in</strong> northern Ch<strong>in</strong>a:opportunities and challenges. In: Bouman BAM,Hengsdijk H, Hardy B, B<strong>in</strong>draban PS, Tuong TP,Ladha JK, editors. <strong>Water</strong>-wise <strong>rice</strong> production. LosBaños (Philipp<strong>in</strong>es): International <strong>Rice</strong> ResearchInstitute. p 143-154.Wassmann R, Neue HU, Lant<strong>in</strong> RS, Makarim K, ChareonsilpN, Buendia LV, Renneberg H. 2000. Characterizationof methane emissions from <strong>rice</strong> fields <strong>in</strong>Asia. II. Differences among <strong>irrigated</strong>, ra<strong>in</strong>fed, anddeepwater <strong>rice</strong>. Nutr. Cycl. Agroecosyst. 58:13-22.Westcott MP, V<strong>in</strong>es KW. 1986. A comparison of spr<strong>in</strong>klerand flooded irrigation for <strong>rice</strong>. Agron. J. 78:637-640.Wei Zhang, Si-tu Song. 1989. Irrigation model of watersav<strong>in</strong>g-high yield at lowland paddy field. In: InternationalCommission on Irrigation and Dra<strong>in</strong>age,Seventh Afro-Asian Regional Conference, 15-25October 1989. Tokyo, Japan. Vol. I-C:480-496.Wickham TH, S<strong>in</strong>gh VP. 1978. <strong>Water</strong> movement throughwet soils. In: Soils and <strong>rice</strong>. Los Baños (Philipp<strong>in</strong>es):International <strong>Rice</strong> Research Institute. p 337-357.Wopereis MCS, Kropff MJ, Bouma J, van Wijk ALM,Woodhead T, editors. 1994. Soil physical properties:measurement and use <strong>in</strong> <strong>rice</strong>-based cropp<strong>in</strong>g systems.Los Baños (Philipp<strong>in</strong>es): International <strong>Rice</strong> ResearchInstitute, 104 p.Wopereis MCS, Kropff MJ, Maligaya AR, Tuong TP.1996. Drought-stress responses of two lowland<strong>rice</strong> cultivars to soil water status. Field Crops Res.46:21-39.Xue Changy<strong>in</strong>g, Yang Xiaoguang, Bouman BAM, DengWei, Zhang Qiup<strong>in</strong>g, Yan Weixiong, Zhang Tianyi,Rouzi Aji, Wang Huaqi, Wang Pu. 2007. Effects ofirrigation and nitrogen on the performance of aerobic<strong>rice</strong> <strong>in</strong> northern Ch<strong>in</strong>a. Submitted to Field CropsResearch, January 2007.Yang Xiaoguang, Bouman BAM, Wang Huaqi, WangZhim<strong>in</strong>, Zhao Junfang, Chen B<strong>in</strong>. 2005. Performanceof temperate aerobic <strong>rice</strong> under different waterregimes <strong>in</strong> North Ch<strong>in</strong>a. Agric. <strong>Water</strong> Manage.74:107-122.Zwart SJ, Bastiaanssen WGM. 2004. Review of measuredcrop water productivity values for <strong>irrigated</strong>wheat, <strong>rice</strong>, cotton and maize. Agric. <strong>Water</strong> Manage.69:115-133.54


![International Standards' Organization â Rice Specification [ISO 7301]](https://img.yumpu.com/36696862/1/190x245/international-standards-organization-a-rice-specification-iso-7301.jpg?quality=85)