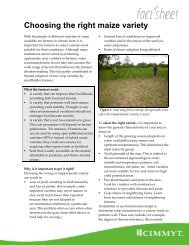
Fig. 1.2. <strong>Water</strong> balance of a lowland <strong>rice</strong> field. C = capillary rise, E = evaporation, I = irrigation, O = overbund flow, P =percolation, R = ra<strong>in</strong>fall, S = seepage, T = transpiration.pore volume, and to a large <strong>in</strong>crease <strong>in</strong> micropores(Moorman and van Breemen 1978). A typicalvertical cross-section through a puddled <strong>rice</strong> fieldshows a layer of 0–10 cm of ponded water, a puddled,muddy topsoil of 10–20 cm, a plow pan thatis formed by decades or centuries of puddl<strong>in</strong>g, andan undisturbed subsoil (Fig. 1.2). <strong>Rice</strong> roots areusually conta<strong>in</strong>ed with<strong>in</strong> the puddled layer and aretherefore quite shallow. The plow pan reduces thehydraulic conductivity and percolation rate of <strong>rice</strong>fields dramatically.Because of its flooded nature, the <strong>rice</strong> field hasa water balance that is different from that of drylandcrops such as wheat or maize. The water balanceof a <strong>rice</strong> field consists of the <strong>in</strong>flows by irrigation,ra<strong>in</strong>fall, and capillary rise, and the outflows bytranspiration, evaporation, overbund flow, seepage,and percolation (Fig. 1.2). Capillary rise is theupward movement of water from the groundwatertable. In nonflooded (aerobic) soil, this capillaryrise may move <strong>in</strong>to the root zone and provide a cropwith extra water. However, <strong>in</strong> flooded <strong>rice</strong> fields,there is a cont<strong>in</strong>uous downward flow of water fromthe puddled layer to below the plow pan (called“percolation”; see below) that basically preventscapillary rise <strong>in</strong>to the root zone. Therefore, capillaryrise is usually neglected <strong>in</strong> the water balanceof <strong>rice</strong> fields.Before the crop actually starts grow<strong>in</strong>g, water<strong>in</strong>put is already needed for wet land preparation.After puddl<strong>in</strong>g, the field is usually left fallow andflooded for a few days (or 1 to 4 weeks) before theseedl<strong>in</strong>gs are transplanted. The amount of waterused for wet land preparation can be as low as100–150 mm when the turnaround time betweensoak<strong>in</strong>g and transplant<strong>in</strong>g is a few days only orwhen the crop is direct wet seeded. However, <strong>in</strong>large-scale irrigation systems that have poor watercontrol, the turnaround time between soak<strong>in</strong>g andtransplant<strong>in</strong>g can go up to 2 months and water <strong>in</strong>putsdur<strong>in</strong>g this period can reach 940 mm (Tabbalet al 2002). After crop establishment, the soil isusually kept ponded with a 5–10-cm layer of wateruntil 1–2 weeks before harvest. Dur<strong>in</strong>g both theturnaround time and the crop growth period, wateroutflows are by overbund runoff, evaporation, seepage,and percolation. Dur<strong>in</strong>g crop growth, wateralso leaves the <strong>rice</strong> field by transpiration. Of allwater outflows, runoff, evaporation, seepage, andpercolation are nonproductive water flows and areconsidered losses from the field. Only transpirationis a productive water flow as it contributes to cropgrowth and development.When ra<strong>in</strong>fall raises the level of ponded waterabove the height of bunds, excess ra<strong>in</strong> leaves the<strong>rice</strong> field as surface runoff or overbund flow. Thissurface runoff can flow <strong>in</strong>to a neighbor<strong>in</strong>g field,but, <strong>in</strong> a sequence of fields, neighbor<strong>in</strong>g fields willpass on the runoff until it is lost <strong>in</strong> a dra<strong>in</strong>, creek,or ditch.Evaporation leaves the <strong>rice</strong> field directly fromthe ponded water layer. Transpiration by <strong>rice</strong> plants
Table 1.1. Total seasonal water <strong>in</strong>put and daily seepage and percolation rates from lowland <strong>rice</strong> fields with cont<strong>in</strong>uouslyponded water conditions. Data collected from field experiments and from farmers’ fields <strong>in</strong> Ch<strong>in</strong>a and the Philipp<strong>in</strong>es.Total seasonal water Seepage andSite <strong>in</strong>put by ra<strong>in</strong> plus percolation Referencesirrigation (mm) rate (mm d −1 )Zanghe Irrigation System, Hubei, Ch<strong>in</strong>a• Field experiment 750 to 1,110 4.0 to 6.0 Cabangon et al (2001, 2004)• Farmers’ fields 650 to 940 1.6 to 2.8 Dong et al (2004), Loeve et al (2004a,b)• Irrigation system level 750 to 1,525 4.0 to 8.0 Dong et al (2004), Loeve et al (2004a,b)Shimen, Zhejiang, Ch<strong>in</strong>a Cabangon et al (2001, 2004)• Early <strong>rice</strong> 850 to 950 1.0 to 6.0• Late <strong>rice</strong> 575 to 700 1.0 to 6.0Guimba, Philipp<strong>in</strong>es Tabbal et al (2002)• Experiment 1988 2,197 18.3• Experiment 1989 1,679 12.5• Experiment 1990 2,028 16.4• Experiment 1991 3,504 32.8Muñoz, Philipp<strong>in</strong>es, 1991 1,019 to 1,238 5.2 to 7.0 Tabbal et al (2002)Muñoz, Philipp<strong>in</strong>es, 2001 600 1.1 to 4.4 Belder et al (2004)Talavera, Philipp<strong>in</strong>es 577 to 728 0.3 to 2.0 Tabbal et al (2002)San Jose, Philipp<strong>in</strong>es Tabbal et al (2002)• Experiment 1996 1,417 9.6• Experiment 1 1997 1,920 15.2• Experiment 2 1997 2,874 25.8withdraws water from the puddled layer. S<strong>in</strong>ce theroots of <strong>rice</strong> plants generally don’t penetrate thecompacted layer, the contribution to transpirationfrom the subsoil is mostly absent. S<strong>in</strong>ce evaporationand transpiration are difficult to measure separately<strong>in</strong> the field, they are usually taken together as “evapotranspiration.”Typical evapotranspiration ratesof <strong>rice</strong> fields are 4–5 mm d –1 <strong>in</strong> the wet season and6–7 mm d –1 <strong>in</strong> the dry season, but can be as highas 10–11 mm d –1 <strong>in</strong> subtropical regions (Tabbalet al 2002). Dur<strong>in</strong>g the crop growth period, about30–40% of evapotranspiration is evaporation (Boumanet al 2005, Simpson et al 1992).Seepage is the subsurface flow of waterunderneath the bunds of a <strong>rice</strong> field. With wellma<strong>in</strong>ta<strong>in</strong>edbunds, seepage is generally small. In atoposequence of <strong>rice</strong> fields, seepage loss from onefield may be offset by <strong>in</strong>com<strong>in</strong>g seepage from anotherfield located higher up. Considerable seepagecan occur from top-end fields and from bottom-endfields that border dra<strong>in</strong>s, ditches, or creeks. Seepagerates are affected by the soil physical characteristicsof the field and bunds, by the state of ma<strong>in</strong>tenanceand length of the bunds, and by the depth of thewater table <strong>in</strong> the field and <strong>in</strong> the surround<strong>in</strong>g dra<strong>in</strong>s,ditches, or creeks (Wickham and S<strong>in</strong>gh 1978).Percolation is the vertical flow of water to belowthe root zone. The percolation rate of <strong>rice</strong> fieldsis affected by a variety of soil factors (Wickhamand S<strong>in</strong>gh 1978): structure, texture, bulk density,m<strong>in</strong>eralogy, organic matter content, and salt typeand concentration. Soil structure is changed by thephysical action of puddl<strong>in</strong>g. In a heavy-textured,montmorillonitic clay, sodium cations and a highbulk density are favorable for effective puddl<strong>in</strong>gto reduce percolation rates. The percolation rate isfurther <strong>in</strong>fluenced by the water regime <strong>in</strong> and aroundthe field. Large depths of ponded water favor highpercolation rates (Sanchez 1973, Wickham andS<strong>in</strong>gh 1978). In a field survey <strong>in</strong> the Philipp<strong>in</strong>es,Kampen (1970) found that percolation rates werehigher for fields with deep groundwater tables (> 2m depth) than for fields with shallow groundwatertables (0.5–2 m depth). In practice, seepage andpercolation flows are not easily separated becauseof transition flows that cannot be classified as eitherpercolation or seepage (Wickham and S<strong>in</strong>gh 1978).Typical comb<strong>in</strong>ed values for seepage and percolationvary from 1–5 mm d –1 <strong>in</strong> heavy clay soils to25–30 mm d –1 <strong>in</strong> sandy and sandy loam soils (Boumanand Tuong 2001). Some examples of seepageand percolation rates measured at different sites are
- Page 2: Water Management in Irrigated Rice:
- Page 5 and 6: PrefaceWorldwide, about 79 million
- Page 10 and 11: given in Table 1.1. Water losses by
- Page 14 and 15: Distribution (%)1009080706050403020
- Page 16 and 17: The plant-soil-water system22.1 Wat
- Page 18 and 19: Ψ Air-100 MPaDemandLeafXylemStemRo
- Page 20: tive to water deficit than cell enl
- Page 23 and 24: Water input (mm)4003503002502001501
- Page 25 and 26: Table 3.1b. Yield, water input, and
- Page 27: Grain yield (t ha -1 )98A2002 20037
- Page 30 and 31: Table 3.5. Water input (I = irrigat
- Page 32 and 33: Practical implementationTemperate e
- Page 34 and 35: Practical implementationSpecific in
- Page 36 and 37: Table 3.8. Comparison of water use
- Page 38: Flooded yield (t ha -1 )87A65432102
- Page 41 and 42: consumption (Hamilton 2003). Many t
- Page 44 and 45: Irrigation systems55.1 Water flows
- Page 46 and 47: the main system is supply-driven, f
- Page 48 and 49: Table 5.1. Area, water use, and tot
- Page 50 and 51: Appendix: InstrumentationDetailed d
- Page 52: 0.5 cm in diameter and spaced 2 cm
- Page 55 and 56: Bronson KF, Singh U, Neue HU, Abao
- Page 57 and 58:
Lampayan RM, Bouman BAM, De Dios JL
- Page 59:
Uphoff N. 2007. Agroecological alte


![International Standards' Organization â Rice Specification [ISO 7301]](https://img.yumpu.com/36696862/1/190x245/international-standards-organization-a-rice-specification-iso-7301.jpg?quality=85)