3 - Centre National de Recherches Météorologiques - Météo France
3 - Centre National de Recherches Météorologiques - Météo France
3 - Centre National de Recherches Météorologiques - Météo France

You also want an ePaper? Increase the reach of your titles
YUMPU automatically turns print PDFs into web optimized ePapers that Google loves.
Researchand<strong>de</strong>velopment:annual report2007
Table of contentsWeather forecasting mo<strong>de</strong>ls page 4Synoptic NWPMeso scale NWPCyclonic ForecastingThe AMMA campaign page 16Use of data collected during the AMMA campaignFirst results from studies led within the AMMA campaignStudies of meteorological process page 20Cyclogenesis and previsibility studiesMeso scale eventsClimate and climate changes studies page 28Atmosphere and environment studies page 32Hydro-meteorologyOceanography (mo<strong>de</strong>lling & instrumentation)Atmospheric environmentAtmospheric chemistry and air qualityAvalanches & snow cover studiesInstrumentation for research page 48Aircraft instrumentationOn site instrumentation and tele<strong>de</strong>tectionCommunication & Promotion page 54Appendix page 56
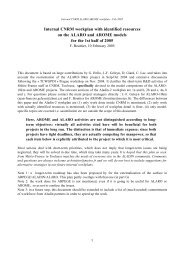
Several papers in the following annual report<strong>de</strong>scribe important aspects of the currentresearch whose aim is to improve theNumerical Weather Prediction systemARPEGE. Four actions <strong>de</strong>serve particularattention :- the improvement of the atmospheric mo<strong>de</strong>l,including a significant increase in the horizontaland vertical resolutions were ma<strong>de</strong>possible by the new computer Nec SX 8Rwhich is operational since the beginning of2007. In addition to a spectacular improvementin the ARPEGE performances, this <strong>de</strong>velopmentcan be consi<strong>de</strong>red as a first steptowards the next increase in resolution whichwill make possible, as from 2009, a directcoupling between ARPEGE and the AROMEhigh resolution mo<strong>de</strong>l.- the assimilation of new observations hasbeen the subject of an intense activity, in particularfor the observations produced by theMetOp satellite. Very promising results havebeen obtained with the assimilation of theIASI soun<strong>de</strong>r. A specific effort is <strong>de</strong>voted tothe assimilation of observations related tothe water cycle. Recent progress have ma<strong>de</strong>the assimilation of the GPS radio possibleoccultationdata in an operational context,with a very positive impact over the Southernhemisphere.- the ensemble forecast is a relatively newresearch domain at CNRM. The <strong>de</strong>velopmentof new methods for the perturbation of theinitial conditions has been achieved in 2007.Presently, Météo-<strong>France</strong> operates a state ofthe art ensemble forecast which feeds up theTIGGE Grand Ensemble. TIGGE has been setup by the THORPEX program of WMO in or<strong>de</strong>rto initiate aca<strong>de</strong>mic and applied researchwhich focuses on the use of multi-mo<strong>de</strong>lensembles for probabilistic predictions.- the <strong>de</strong>velopment of an ensemble assimilationsystem proved itself to be a particularlypromising method to evaluate background2 . Research and <strong>de</strong>velopment: annual report 2007
errors <strong>de</strong>pending on the current meteorologicalsituation. Recent results show very goodperformances on relevant error statistics withonly 6 members. This performance makes itpossible to envisage the operational implementationof this technique in a very nearfuture.Improving the ARPEGE mo<strong>de</strong>l does not onlymeet operational aims. Most <strong>de</strong>velopments,either on physics or on dynamics, are done inclose cooperation with teams <strong>de</strong>veloping thelimited area mo<strong>de</strong>ls ALADIN, Méso-NH andAROME as well as with teams <strong>de</strong>veloping climatemo<strong>de</strong>ls. At the same time, <strong>de</strong>velopmentsare also un<strong>de</strong>r way to inclu<strong>de</strong> the same externalizedscheme for continental and oceanicsurfaces in all these different mo<strong>de</strong>ls.Additionally, it must be emphasized that theARPEGE mo<strong>de</strong>l is also a powerful researchtool which is a core component to investigatecyclogenis and fronts dynamics, as it isshown in this report.Éric BrunHead of Research at Météo-<strong>France</strong> Eric Brun, head of CNRM, duringhis opening lecture at the atmospheremo<strong>de</strong>lling workshop, in January 2007.3 . Research and <strong>de</strong>velopment: annual report 2007
Numerical Weather Prediction2007 saw the first quasi real time experimentation of the AROMEprototype which should be operational by the end of 2008. Theresearch teams not only worked hard on AROME but they alsoimplemented a new spatial resolution for ARPEGE and for ALADIN.Moreover, data assimilation systems have been improved, andspecific forecast tools for aeronautic needs have been <strong>de</strong>veloped.In the meantime, cyclone forecasting ma<strong>de</strong> some significant progress.Synoptic NWPAssimilation of MetOp dataThe Metop satellite, launched in October2006 by EUMETSAT, is the first Europeancontribution to the constellation of operationalpolar-orbiting satellites. The instrumentsonboard MetOp, innovating for some, in thecontinuity of existing instruments for others,provi<strong>de</strong> data which have started to be assimilatedin the numerical weather predictionmo<strong>de</strong>ls at Météo-<strong>France</strong>.The ATOVS instruments (AMSU-A, MHS, HIRS)measure radiances which can be directly linkedto atmospheric temperature and humidity.These data are now a useful addition tothose originating from American satellites inthe operational mo<strong>de</strong>ls (see Figure). TheASCAT scatterometer observes winds at theocean surface in the continuity of the ERSscatterometer, but with a swath twice asbroad. The most prominent instrument onMetOp is the Michelson Interferometer in theinfrared spectrum, IASI, <strong>de</strong>veloped by CNES incollaboration with EUMETSAT. The amount ofdata collected by IASI is more than a hundredtimes greater than that provi<strong>de</strong>d by soun<strong>de</strong>rsfrom the previous generation such as HIRS, thusresulting in a finer <strong>de</strong>scription of the atmosphericvertical structure. The assimilation of ASCATand IASI data is planned for 2008. Finally, theGRAS instrument will soon provi<strong>de</strong> GPS radiooccultationmeasurements similar to thoseMétéo-<strong>France</strong> recently started to assimilate.Beyond the application to numerical weatherprediction at short to medium range, thedata collected by IASI will contribute to a betterknowledge of the atmospheric compositionin minor constituents of which radiativeproperties are of utmost importance for theclimate. 1Assimilation of GPS radio occultation datafor Numerical Weather PredictionSatellite observations of the Earth’s atmospherecollected, thanks to the GlobalPositioning System (GPS), are now used beneficiallyat Meteo-<strong>France</strong> to improve numericalweather forecasts. The radio-navigation signalssent by the American GPS satellites located at a20200 km altitu<strong>de</strong> are refracted by the Earth’satmosphere. The atmospheric refraction measuredby GPS receivers in lower orbit (between400-1600 km altitu<strong>de</strong>) enables then to characterizethe temperature and water vapour distributionsin the atmosphere.In 2006, the USA/Taiwan FORMOSAT-3/COS-MIC mission launched six such GPS radiooccultation receivers. Numerical weather forecastexperiments conducted at Meteo-<strong>France</strong>have shown that the bending angle data collectedby these satellites, as well as similardata collected by the German satellitesCHAMP and GRACE, helped improve numericalweather forecasts by reducing the errors inthe estimated initial state of the atmosphere.The largest improvements were observed inthe traditionally un<strong>de</strong>r-observed regions(Southern hemisphere) and those regionswhere the addition of high vertical resolutiondata is critical to help improve the atmospheric<strong>de</strong>scription in the mo<strong>de</strong>l (tropopauseregion).As a result of this study, Meteo-<strong>France</strong>’s globalnumerical weather prediction mo<strong>de</strong>l ARPEGE,as well as the limited-area mo<strong>de</strong>l ALADIN overEurope and over La Reunion Island, have beenoperationally assimilating GPS radio occultationbending angle data since September2007. 2ARPEGE : seamlessglobal to mesoscaleforecasting systemThe global data assimilation and forecastingsystem of Météo-<strong>France</strong>, Arpege, as well asthe hydrostatic Aladin mo<strong>de</strong>ls which are coupledto it, change and improve continuously.The following paragraphs thus summarize theobservation system extension and the new<strong>de</strong>velopments in data assimilation or in theparameterization schemes.The overall framework within which all thesechanges are integrated also un<strong>de</strong>rgoes someevolutions. Foremost, a change of verticalresolution will be applied to all the Arpegeand Aladin mo<strong>de</strong>ls: the atmosphere will berepresented with 60 vertical layers instead ofthe 46 currently in operation. It has been chosen,in this instance, to focus the vertical refiningaround the altitu<strong>de</strong>s 10-12 km in or<strong>de</strong>rto better represent the jet-streams. To betterrepresent jet-streams, the vertical refining willbe focussed around the 10-12 km altitu<strong>de</strong>s.They influence many aspects of the weatherevolution. Precision in the vertical computationsis improved by activating a numericalscheme <strong>de</strong>veloped at ECMWF in Reading.Furthermore, the Arpege horizontal resolutionis also increased. Everywhere around theglobe, it tends to be less than 100 km, an<strong>de</strong>ven smaller than 50 km around La RéunionIsland. In the Europe-North Atlantic broadarea, Arpege has a finer resolution thanECMWF mo<strong>de</strong>l, with an average resolutionsmaller than 20 km from Iceland to theCaspian Sea. Resolution reaches 15 km over<strong>France</strong>. The horizontal resolution changescontinuously, therefore avoiding breaks thatresult from lateral coupling. This new resolutiongives <strong>de</strong>tails of the internal structure ofstorms, as illustrated by the figure, with veryrealistic cloud systems.These changes have been extensively testedduring the last three months of 2007 andbecame operational early in 2008. 34 . Research and <strong>de</strong>velopment: annual report 2007
1 Data coverage from AMSU-A soun<strong>de</strong>rs used in operations in the ARPEGEmo<strong>de</strong>l assimilation, over a 6 hour assimilation period (MetOp is in blue).23 Geometry of the GPSradio occultation technique:the atmosphere refracts theradio signal sent bya GPS transmitter;the refraction angleobserved by a GPS receiverenables to characterizethe atmospheric refractivein<strong>de</strong>x at the tangentpoint (T).4 The 08/11/2007 strong North Sea storm which amplified all day long.The related cold front, well marked, un<strong>de</strong>rgoing further internal fine scaleperturbations that caused severe damages in the North of <strong>France</strong> (compositeradar reflectivity composite, top left panel). The Arpege operational version(bottom left panel) does not represent such fine structures, but it did forecaststhe storm. On the other hand, the new version of Arpege (right panels) furtherforecasts the front organization and it suggests the internal perturbation, both inits dynamical components (bottom) and in its cloud structure (top). Top rightpanel: 3 layer composite cloud cover, high level clouds (H), mid-level clouds (M)and low-level ones (B). Bottom: wind (barbs, kt) and relative vorticity (shading)at about altitu<strong>de</strong> 1500 m. A maximum vorticity band is a good indicator of afrontal zone, while a spotty maximum outlines a vortex. Contour interval: warmcolours 5 10 -5 s -1 from light red, 2,5 10 -5 s -1 below, cold colours, negative values.PEARP 16/01/2007 18TUvalid. 18/01/2007 18TU (+48h)1. 3. 5. 10. 15. 20. 25. 30. 35. 40.mgp Example of a 48 h uncertainty forecast by the upgra<strong>de</strong>d global PEARP fromthe 16/01/2007 18 UTC, for the 18/01/2007 18 UTC. On that day, a strongstorm hit the North Sea and nearby south-eastern countries. Contours are500 mbar geopotential height (a pressure-like field, altitu<strong>de</strong> about 5.6 km,contour interval 10 damgp) forecast by the ensemble mean. Shading showsthe uncertainty as the standard <strong>de</strong>viation of the differences between ensemblemembers (interval: 5 mgp). Far from being uniform, uncertainty grows for specificareas shown in red and where it turns out that active bad weather systemsare often located.A first upgra<strong>de</strong>of the Arpege ensembleprediction system(PEARP)PEARP, for Arpege ensemble forecasting inFrench, is Météo-<strong>France</strong> ensemble predictionsystem, initially <strong>de</strong>veloped by theForecast Department. It is an ensemble targetedtowards short range probabilistic predictions,that is for the following next 3days.On top of an unperturbed control forecast,PEARP consists in 10 more forecasts whoseinitial conditions are subtly non-randomlymodified. The differences between the evolutionsin time of the 11 forecasts provi<strong>de</strong> ameasure of the uncertainty and enable tooutline the probability distributions of thepredicted parameters. In the operationalversion, the perturbations that are used toprepare the various initial states are onlycomputed within a domain restricted toNorth-Atlantic and Europe. CNRM initialaction on PEARP has been to change theseperturbations. Firstly, they are, from now on,computed over the whole globe. Secondly,part of the forecast uncertainty comes fromthe past, through the evolution of perturbationsfrom previous runs during the periodpreceding the initial forecast time.Finally, a small part of the uncertainty aboutthe knowledge of the initial state is <strong>de</strong>rived5 . Research and <strong>de</strong>velopment: annual report 2007from the latest variationnal analysis and isused to adjust the amplitu<strong>de</strong> of the final perturbationsthat are then ad<strong>de</strong>d to that analysis.This is the first step of an evolution thataims to <strong>de</strong>velop a state-of-the-art probabilisticforecast system, a step mostly directedtowards improving Météo-<strong>France</strong> contributionto the WMO supported TIGGE project ofcollecting global ensemble forecast. Thisnew version of PEARP became operational infebruary 2008. 4
Estimation of forecasterrors with a smallensemble of forecastsand an optimized spatialfilteringAssimilation systems such as the Arpège,Aladin and Arome mo<strong>de</strong>ls enable to correctforecasts with observations. This is done byaccounting for forecast error statistics. To estimateforecast errors, an appealing approachis to simulate the time evolution of errors byusing an ensemble of perturbed assimilations.The i<strong>de</strong>a is to add perturbations whichsimulate uncertainties at play, and to makethem evolve through the analysis and forecaststeps.The ensemble size is a crucial factor toobtain an estimate which is both robust andnot too costly. However, using optimizedspatial filtering techniques allows the require<strong>de</strong>nsemble size to be reduced in or<strong>de</strong>r toreach a given accuracy (or vice versa toincrease the accuracy for a given ensemblesize). The i<strong>de</strong>a is to calculate a local spatialaverage of statistics, which allows the statisticalsample size to be strongly increased.These notions are illustrated in the figurewith four estimates of the error variance mapof vorticity near 500 hPa. Panel (a) correspondsto a reference, which indicates thatthe errors are larger over the Atlantic andPacific Oceans, and also in the SouthernHemisphere. Panel (b) is an estimate froman ensemble of 6 random realizations afteran optimized spatial filtering. The resultingestimate is more accurate than the raw estimationsfrom 6 or even 220 realisations(panels (c) and (d) respectively).An operational implementation of thesetechniques is consi<strong>de</strong>red for 2008, in or<strong>de</strong>rto <strong>de</strong>scribe the <strong>de</strong>pen<strong>de</strong>nce of errors on theongoing weather situation. 5Study of alternativeformulation forIFS/ARPEGE/ALADIN/AROMEdynamic kernelThe non-hydrostatic (NH) dynamical kernel ofour Numerical Weather Prediction tool is oneof the key elements of the new AROME system,currently un<strong>de</strong>r tests for a future operationaluse (the other elements being thephysics and the data assimilation). In parallelto this use at fine scales in small limited areadomains, other types of applications areconsi<strong>de</strong>red for the future. Work is un<strong>de</strong>rwaywith the ECMWF to see if the kernel is relevantto the global IFS mo<strong>de</strong>l in NH mo<strong>de</strong>. A cooperationwith the HIRLAM group is also in progressfor large limited-area domains.Such configurations <strong>de</strong>part significantly fromthe AROME one in many respects (geometry,inclusion of physics and algorithmic choices,...).Robust and accurate algorithms arerequired for a possible use of the NH dynamicalkernel for this wi<strong>de</strong> range of applications.For this, research mainly involved theincrease of the robustness for large timestepsthrough a revision of the discretisationof some non-linear terms, and the improvementof the intrinsic accuracy through theimplementation of a preliminary version withthe discretisation of vertical finite elements. Alonger-term work about the possible replacementof the prognostic NH variable set isun<strong>de</strong>rtaken with the aim of a more naturalinclusion of finite elements. 610 m winddata assimilationinsi<strong>de</strong> ALADIN10 m wind observations assimilation is arather tricky/difficult task. As a matter of fact,wind near the ground <strong>de</strong>pends a lot on smallscale orography that can be quite differentfrom large scale mo<strong>de</strong>l orography. Besi<strong>de</strong>s,data are also influenced by small scaleground parameters such as vegetation type,height. At last, a wind measurement in mountainousareas can represent a phenomenumthat has a time limitation is limited in timeand is of little importance for large scales.However, for limited area mo<strong>de</strong>ls whose surfacecharacteristics are closer to reality,these observations can bring useful informationto a data assimilation system. Becauseof the high temporal and spatial cover(cf figure a); we tried to test their impactinsi<strong>de</strong> the limited area mo<strong>de</strong>l ALADIN. Forthat, first we selected stations, which presented,over the test period (4 month), astrong correlation with values forecasted bythe ALADIN mo<strong>de</strong>l.The main impact of these observations islocated insi<strong>de</strong> the atmospheric boundarylayer as shown in figure b, the vertical crosssection shows that the impact is importantbelow mo<strong>de</strong>l level 35, that is to say at 1.5 km.The only relevant improvement of 10 m windobservations is the reduction of the groundpressure bias insi<strong>de</strong> ALADIN, which is a knownflaw of that mo<strong>de</strong>l. That effect is possiblethanks to the correlation of the mo<strong>de</strong>l errorsbetween surface pressure and wind. 76 . Research and <strong>de</strong>velopment: annual report 2007
ab5c Forecast error variances of vorticity (in 10 -9 s -2 ) near 500 hPa.Panel (a): reference.Panel (b): filtered estimate from 6 random realizations.Panels (c) and (d): raw estimates from 6 or 220 realizations, respectively.The filtered estimated is the closest one to the reference.ad6Valeurs Propres20-2-4-6-870 20 40 60 80 100 120 An example of the NH dynamical kerneleigenfrequencies, analytically diagnosed for thecase of a particular vertical finite-elementdiscretisation with 60 irregularly-spaced levels.Green: logarithm of the real part;red: imaginary part (x10000). The appearance of aweak imaginary part indicates that the systemwould be unstable with this particulardiscretisation.With this kind of analysis for the responseof the system it is possible to anticipateits behaviour without heavy <strong>de</strong>velopments.b a : 10 m wind observations available for each analysis.b : Vertical Cross section over <strong>France</strong> showing differencebetween two analysis at 12 h 00, one with 10 m windobservations, the other one without7 . Research and <strong>de</strong>velopment: annual report 2007
Meso scale NWPSince september 2007, the AROME mo<strong>de</strong>luses initial conditions provi<strong>de</strong>d by its owndata assimilation system instead of thoseproduced by the ALADIN-FRANCE operationalsuite.This system is based on the ALADIN-FRANCE3D-Var scheme that is operationally runningat Météo-<strong>France</strong> at regional scale since June2005. It uses high temporal and spatial frequencyobservations (RADAR measurementsfor example) to the best possible advantage,and a rapid forward intermittent assimilationcycle in or<strong>de</strong>r to compensate the lack of temporaldimension in the 3D-Var scheme.Observations every 3 hours (instead of 6 inALADIN), are assimilated using the previousmo<strong>de</strong>l forecast as a background to produce anew estimate for wind, temperature, humidityDoppler radars observations allow to <strong>de</strong>scribethe tri-dimensional structure of precipitationsand of air flow within a precipitatingsystem with a high temporal and spatialresolutions. Consequently, these data willplay a crucial role in the retrieval of AROME’sanalyses, which will be the starting point toforecast severe weather. For this purpose,studies are currently un<strong>de</strong>r progress in or<strong>de</strong>rto take into account radars from the Frenchnational network ARAMIS in the AROME assimilationsystem. As a first step, observationoperators have been <strong>de</strong>veloped to simulateradial velocities and reflectivities using themo<strong>de</strong>l’s variables.The assimilation of Doppler winds in theAROME 3Dvar has been validated for severalconvective cases and is still being evaluatedon a daily basis in a pre-operational configu-The AROME mo<strong>de</strong>luses its own assimilationUse of radar datain AROMEand surface pressure fields. The others fieldsare cycled from the background.Observations that are assimilated in the systemare currently those of the ALADIN-FRANCEoperational suite. Works will be soon completedon the use of other types of observationssuch as wind measurements by Dopplerradars.This data assimilation system has been firstlytested on different precipitating cases. A dailyassimilation cycle has been performed sinceSeptember 2007. Forecast evaluation, using,for example, standard scores against observations,shows a general benefit of the use ofthe AROME analysis during the first 12 hourforecast ranges. After 12 hours, the influenceof lateral conditions becomes more importantthan the initial conditions one. 8ration. It has been found that, when somefavourable sampling conditions are present,short term forecasts of precipitations areimproved thanks to a more realistic analysisof convergence structures in the boundarylayer (figure).The assimilation of reflectivities is more complexbecause microphysical variables are notconsi<strong>de</strong>red as control variables in AROME,and because of the difficulty to linearizewater cycle processes. A 1D statistical inversionmethod, which allows to retrieve relativehumidity profiles from reflectivities, isfirstly applied by using the mo<strong>de</strong>l state in thevicinity of the observation as a probablesource of information. These profiles arethen directly assimilated in the 3Dvar.Encouraging results have been obtained sofar and work is still in progress. 9Validationof the Aromemesoscale mo<strong>de</strong>l in testThe mesoscale Arome mo<strong>de</strong>l is currently onits final phase. During the year 2007, thenumerical suite saw several important evolutionsfor the production of fine scale forecasts.First, thanks to the computingresources of the supercomputer NEC, fromearly January 2007, it was possible to enlargethe size of the domain in or<strong>de</strong>r to cover thewhole of Metropolitan <strong>France</strong>.Then, during the year 2007, practical experimentationsmanaged in the framework of thePARME (support to the implementation) projectwith forecasters coming from regional aswell as central services allowed to <strong>de</strong>tectsome youthful <strong>de</strong>faults of the mo<strong>de</strong>l. Some ofthem are already or on the way to besolved. For example, some dynamical tuningsnot well fitted to the horizontal scale of Aromehave been revisited and some improvementsof the physics have been evaluated such as anew scheme for the shallow convection. Theobjective validations such as comparisons offorecasts with respect to observations alsoallowed to <strong>de</strong>tect several systematic bias.Some of them found a solution such as theimplementation of a specific scheme for thecanopy that has proved to improve the scoresof the 2 metres temperature and of the 10metres wind. Others, such as the overestimationof the heavy rainfall need to be re-examined.Finally, the implementation of theassimilation at the end of September 2007ends a year full of changes for the Aromemo<strong>de</strong>l.To conclu<strong>de</strong> at the close of 2007, one couldsay that the quality of the forecasts <strong>de</strong>pendson the type of parameters and on the weathertype. Objective comparisons with respect toobservations are of the same level of accuracyas the ones in the Aladin mo<strong>de</strong>l. The experimentationsdone by forecasters also showedsome successes, in particular, the triggeringof diurnal convection or as drawn in the figurebelow, in the cloudiness forecast. The nextchanges that will occur before switching tooperations will contain, in particular, the assimilationof the Doppler wind data. 108 . Research and <strong>de</strong>velopment: annual report 2007
2555220210522202222221555251522222222525102525255252522252222222255220.50.10.1220.10.520.10.50.5252222525-1 - 0.5 0.5 - 2 2 - 5 5 - 10 10 - 15 15 - 20 20 - 30 30 - 40 40 - 55 55 - 75 75 - 100 100 - 1500°0°ICMSHAROM+0012 - - 0 - field : PRECIPA50°N0.50.50.150°N150.10.510100.1Cumulated rainfallsbetween 00 and 12 UTCDecember the 8 th , 2007:raingauge measurements (a),simulated by an AROME forecaststarting at 00 UTC and usinginitial conditions provi<strong>de</strong>d by theALADIN analysis (b), and theAROME analysis (c).0.10.50.10.50.50.50.10.50.50.1150.50.50.50.10.10.50.50.50.50.10.50.10.50.50.50.10.10.10.510100.50.10.50.1b0.1 0.5 2 5 10 15 20 30 40 55 75 100 150 2500° ICMSHAROM+0012 - - 0 - field : PRECIPA100.5a81520101015100.10.10.50.5 Rain-band associated to a coldfront that has occurred in Northern<strong>France</strong> November the 8 th , 2007, at18 UTC:(a) composite reflectivity pattern,divergence analyses at 950 hPa<strong>de</strong>duced from the AROMEassimilation system (b) withand (c) without radial velocities(blue-green contours <strong>de</strong>noteconvergence; in (b): red squaresshow radars that have been takeninto account, blue dots radialvelocity profiles that have beenconsi<strong>de</strong>red in the analyses).0.50.50.10.50.1100.50.5150.52 20.50.50.10.50.50.50.50.10.50.10.10.10.10.10.190.150°Na0.50.50.5cSatellite imagein the visible channelfor the 07 thof August 2007at 12 UTC.b10cSuperimposedthe 12 hours forecast ofthe Arome mo<strong>de</strong>l in testbased on the 07 thof August 2007at 00 UTC for the totalcloudiness parameter.9 . Research and <strong>de</strong>velopment: annual report 2007
Tests of a turbulentcanopy schemein AROMEA new Surface Boundary Layer (SBL)scheme <strong>de</strong>veloped by GMME has been evaluatedin AROME. This scheme, namedCANOPY, is integrated within the surfacescheme. It consists in adding 6 verticallevels between the soil and the lowestmo<strong>de</strong>l level (which is currently at 17.5 m inAROME). 2 metres and 10 metres diagnosticsare computed using a turbulencescheme on these 6 ad<strong>de</strong>d levels. Contrary toprevious surface boundary layer diagnostics,CANOPY scheme affects all the resultsof the numerical simulation. In<strong>de</strong>ed, fluxessend by the surface to the atmosphere arechanged.The scheme has been evaluated during2 months: January and July 2007, over South-Eastern <strong>France</strong>. The comparison with the 351observation stations over the domain isimproved as showed in figures (a) and (b) :2 meters temperature bias and root meansquare errors are reduced. AROME SBL scoreshave now a quality at least equivalent or betterthan the ALADIN ones. 11Impact of the useof a new shallowconvection schemein AROMEThe horizontal resolution of AROME (2.5 km)is not sufficient to explicitly resolve all typesof clouds, and a subgrid representation ofcumulus clouds and fractional stratocumulusis still nee<strong>de</strong>d. A new shallow convectionscheme has been <strong>de</strong>veloped in AROME, called“EDKF” (Eddy-Diffusivity-Kain-Fritsch) toimprove the mixing in the dry or wet convectiveboundary layers, associated to the subgridthermals. This scheme is based on themass-flux scheme of Soares et al (2004)improved by a formulation of the cloudyentrainment/<strong>de</strong>trainment of the originalMeso-NH scheme (Bechtold et al., 2000). Anon-local mixing is also applied to the wind,in addition to the mixing yet realized by theturbulent scheme via the eddy-diffusivityapproach.This new parameterization is currently testedwith AROME daily runs and shows significantimprovements on boundary layerclouds. A positive impact is also the removalof “herringbone” patterns on the low levelwind which is frequently produced inconvective boundary layers with weak winds(figure 12). This noisy dynamical structurewas relative to an insufficient mixing in thesimulated boundary layer, inducing typical“rolls”, especially at kilometric resolutions,when eddies are partly resolved and partlyparameterized. The new EDKF convectionscheme contributes to the mixing relative tothe thermals, modifying both the thermodynamicaland dynamical profiles. 12Local forecastingof low visibilityconditions on airportAccurate forecasts of the onset and burn-off offog or low clouds matter a great <strong>de</strong>al for airportssince the frequency of landings and taking-of issignificantly reduced with low visibility conditions.COBEL-ISBA is a single column numericalmo<strong>de</strong>l (<strong>de</strong>veloped jointly with Laboratoire d’aérologieand Université Paul Sabatier) whichaims at forecasting fog and low clouds situations.It is in operational use at the Paris-Charles <strong>de</strong> Gaulle airport since 2002.In 2007, research activities have mainly focusedon the initial conditions of temperature andhumidity of this mo<strong>de</strong>l. These are given by anassimilation scheme which combines localobservations and a guess, i.e. a forecast fromthe previous forecasting cycle. It has beenshown that the vertical influence of observationson the initial profiles follows a strong diurnalcycle.As a consequence, a new assimilation scheme,which takes more into account this variability,has been <strong>de</strong>veloped : an Ensemble KalmanFilter (EnKF). The correlation between humidityand temperature uncertainties in the guess hasalso been accounted for. This work also showedthe impact of the initialization of fog andlow clouds, and steps have been taken toimprove it.In 2008, work on the assimilation scheme willbe pursued, using the numerous data from thefield campaign “Paris-FOG”, in which COBEL-IBSA took part by providing daily forecasts. Themo<strong>de</strong>l is being installed on two other airports :Paris-Orly and Lyon-Saint Exupéry. Our goal is tomake COBEL-ISBA available for operational useat the Lyon-Saint Exupéry airport by the winterof 2008-2009. 13Targeted uplink of georeferenced weather informationfor commercial aircraftsSelected and launched as part of the 6 thFramework Programme of the EuropeanCommission, FLYSAFE aims at <strong>de</strong>fining andtesting new tools and systems which willcontribute towards the safety of flights ofall aircraft. This high-level objective is toprovi<strong>de</strong> crews with <strong>de</strong>cision aids on thethree “threats” which play a major role inacci<strong>de</strong>nts, amongst which adverse atmosphericconditions. Météo-<strong>France</strong>, the MetOffice, the DWD (Deutsche Wetter Dienst),the DLR (Deutsche Zentrum für Luft andRaumfahrt) and University of Hannoverhave <strong>de</strong>veloped ground-based nowcastingsystems (WIMSs: Weather InformationSystems) focussed on weather phenomenonsthat have an impact on aviation:Cumulonimbus, In-flight icing, Clear AirTurbulence, Wake vortices. The WIMS productsare georeferenced weather objectsthat <strong>de</strong>scribe hazardous areas with a polygonassociated to several meta-informationssuch as the severity of the confi<strong>de</strong>ncein<strong>de</strong>x associated to the forecast. A GroundWeather Processor concentrates the WIMSproducts and answers aircrafts requests.The GML-based exchange mo<strong>de</strong>l that hasbeen put in place and the associated webfeaturesare compliant with the specificationsof the Open Geospatial Consortium,which will contribute to the interoperabilityand ease the operational implementation.This system will be evaluated in 2008 withtwo flight-test campaigns in which theSAFIRE ATR42 will be involved. 1410 . Research and <strong>de</strong>velopment: annual report 2007
3K4,03,02,01,011SUDE005a100959012Module : min=0.0785159468651 max=7.88577312231 moy=3.5888221783635430°5454,0 m/s50°N0,08530 3 6 9 12 15 18 21 24 27 30ÉchelleSUDE005334,03,02,09031,00,00 3 6 9 12 15 18 21 24 27 30Échelle T2m scores for January (a)and for July (b) 2007:AROME-Reference (pink),AROME-Canopy (blue), root meansquare errors on the top, biasat the bottom.b8554343340.1 - 1 1 - 2 2 - 3 3 - 4 4 - 5 5 - 7 7 - 10 10 - 1543423334a13Module : min=0.024394646287 max=7.46915210783 moy=3.182012593330°4,0 m/s354454450°N432343 3332324233b Fog can dramatically reduce airport traffic :persistent fog on the London-Heathrow airport,December 2006. Photo by Tim Ocken<strong>de</strong>n, Associated Press.223433323312233332344434243354423422 Situation of the 30 th of July 2007 at 14 h TUin the North-West of <strong>France</strong> forecasted withAROME. Module and vector of wind near theground in the standard version of AROME(without EDKF) (a) and with EDKF (b). FLYSAFE overall concept1411 . Research and <strong>de</strong>velopment: annual report 2007
New generation observationsand meso-scale mo<strong>de</strong>lfor aeronautical icing risk <strong>de</strong>tectionDevelopmentfor a rain occurrencewarning productThe present work is conducted within thescope of FLYSAFE, a 4 year Integrated Projectof the 6 th framework of the EuropeanCommission started in February 2005. Inor<strong>de</strong>r to increase aircraft safety, one of themain objectives of the FLYSAFE project is toimprove weather information supplied toflight crew members. In the frame of FLYSAFE,Météo <strong>France</strong> is currently improving its nowcastingtool for the <strong>de</strong>tection of in-flight icingareas called SIGMA.Innovative SIGMA <strong>de</strong>velopments inclu<strong>de</strong> theuse of new generation observations such asvolumetric radar images and high resolutionMeteosat Second Generation satellite imagery,as well as the new Météo-<strong>France</strong>mesoscale non hydrostatic NumerocalPrediction Mo<strong>de</strong>l AROME. SIGMA algorithmhas been re<strong>de</strong>signed to be able to takeA thun<strong>de</strong>rstorm nowcastingsystem for improvingcommercial flights safetyThe aim of the European project Flysafe isto improve the New generation IntegratedSurveillance System for commercial flightsby 2015. The three risks addressed aremeteorological factors, collision with theterrain and collision between aircrafts.Among the meteorological phenomenaaddressed, thun<strong>de</strong>rstorms are handledthrough the <strong>de</strong>velopment of a prototype“Weather Information Management Systemfor Cbs”, which is led in cooperation withthe German DLR, the French ONERA, theBritish Met Office and the University ofHanoverMétéo-<strong>France</strong> with DLR addresses two spatialscales: the so-called Terminal ManoeuvringArea (TMA) and the regional (i.e.European) scale. The goal is to i<strong>de</strong>ntify, to<strong>de</strong>scribe and to forecast thun<strong>de</strong>rstorms at aone hour range using an object representation,with a high refreshed rate. For the TMAadvantage of these new observation inputdata elaborated by CMS ( <strong>Centre</strong> <strong>de</strong> météorologieSpatial) and CMR (<strong>Centre</strong> <strong>de</strong> météorologieRadar).Owing to these new observations, moreemphasis is put on observations comparedto NWP input data, and supercooled liquidwater diagnostic is now enhanced.In parallel to the improved observations, thenew NWP mo<strong>de</strong>l AROME produces humidityand temperature fields with a much betterspatial resolution as well as new microphysicsfields which are very useful for diagnosticsand the forecast of super cooled liquidwater areas.Work on calibration and evaluation of the newSIGMA algorithm will carry on in 2008 with twoflight tests campaigns to be held in Februaryand August 2008 in the scope of FLYSAFE. 15scale, the data used is mainly the advancedAramis radar network data: 3D scans andtheir 2D synthesis, and dual polarizationdata for hail <strong>de</strong>tection; Doppler winds areused for <strong>de</strong>tecting large wind shear. Theforecast of maximum thun<strong>de</strong>rstorm cell topis based on thermodynamic profile analysis.For the European scale, a radar mosaicis used, which inclu<strong>de</strong>s data from neighbouringcountries, while handling their timeshift. Regarding the evaluation, diagnosedthun<strong>de</strong>rstorm objects are checked againstcloud-to-ground lightning data, and againstthun<strong>de</strong>rstorm objects diagnosed usingsatellite data. Forecast thun<strong>de</strong>rstormsobjects are diagnosed using a newapproach which allows for uncertainty intime and in space.During 2008, a further evaluation will implyon-board radar data collected during aflight test experiment. 16In or<strong>de</strong>r to open a rain occurrence warningservice, we have settled and assessed a rainnowcasting suite. The service is specific toeach of the 38.000 French municipalities. Itcombines a warning message one hourbefore it rains, and gives more <strong>de</strong>tailedinformation on the forecast rain time series.The forecast method is based on rain patternsmovements analysis using a radarmosaic, followed by an extrapolation of thenational rain <strong>de</strong>pth radar estimate. Rain<strong>de</strong>pth are translated in space without achange in magnitu<strong>de</strong>. Using the rain <strong>de</strong>pthestimate allows to benefit from its pixel-specificquality data, and the observation qualitycan hence be dynamically translated inservice quality.It was evaluated with 4 months of data,using the actual rain <strong>de</strong>pth estimate as thereference. The criteria used were userorientated,and their median values werecomputed among all the municipalities;the false alarm rate amounts to 37 %,which is acceptable; the non-<strong>de</strong>tectionrate is remarkably low (3 %) and the meananticipation before rain starts is 25minutes, which is below the objective. Thisnowcast is actually difficult because itaddresses quite low levels of rain. As thequality is not homogeneous over the country,this leads to open the service for only alimited part of the territory.Plans for 2008 inclu<strong>de</strong> the use of animproved rain <strong>de</strong>pth estimate, on <strong>de</strong>epeningand enlarging the evaluation, and onimprovement addressing the remainingshortcomings. 1712 . Research and <strong>de</strong>velopment: annual report 2007
15 SIGMA icing diagnostic for the 7 th ofDecember 2007 at 13 UTC, at 800 hPa,showing an area of mo<strong>de</strong>rate to severeicing conditions in red, an area ofmo<strong>de</strong>rate icing conditions in orangeand light icing risk in yellow.16 Mean values of anticipation over rain start for the rain warning product.Color scheme : black < 30’ < blue < 25’ < green < 20’ < yellow < 15’ < red. Flysafe and thun<strong>de</strong>rstorms :enabling pilot to safely avoidthun<strong>de</strong>rstorms. On June 2005, 23 rd ,at 13 h 45, near Paris, aircrafts(tracks shown in red) have a difficulttime moving around thun<strong>de</strong>rstorms(shown as green, yellow and redpixels) before landing or evenentering it, especially for those inthe middle of the bottom halfbecause they did not get an earlyenough accurate picture of thethun<strong>de</strong>rstorms locations.1713 . Research and <strong>de</strong>velopment: annual report 2007
Cyclonic forecastingA specific cyclone initializationMétéo-<strong>France</strong> Regional <strong>Centre</strong> based in LaRéunion island watches over the south-westIndian ocean cyclones, an international dutyentrusted by WMO. Numerical mo<strong>de</strong>lling hasbecome an essential tool to forecast cyclones.The mo<strong>de</strong>l initialization uses huge amountof data, mainly satellite measurements.However, data actually used in the cyclonebody are very sparse (figure a) because ofcloud, rain or strong wind contamination.Thus, the cyclone structure and intensityanalysis is/are very difficult. Dvorak analysis,that forecasters perform by using satelliteimagery, gives reliable estimates of themain cyclone characteristics. Forecastersuse satellite imagery for (a) Dvorak analysiswhich gives main characteristics of a lowatmospheric pressure system.Based on some of these estimated parameters,analytical mo<strong>de</strong>ls can compute the correspondingthree-dimensional cyclonestructure. Pseudo-observations, <strong>de</strong>ducedfrom the latter, are assimilated in the Aladin-Réunion mo<strong>de</strong>l since December 2007. Theyconsi<strong>de</strong>rably improve cyclone analyses andforecast positions (figure b). Great benefitsare also visible on intensity forecasts.Forecasts about intensity also greatly benefitfrom them.In the years to come, the use of satellite measurementsin cloudy or rainy conditions willspread on. Another important progress forcyclone forecast is to improve the ocean <strong>de</strong>scription,since the ocean is the main energysource for the cyclone <strong>de</strong>velopment. 18The effect of La Reunion Islandon the tropical cyclone Dina (2002)The intense tropical cyclone Dina directly affectedLa Réunion Island on 22 January 2002, causingimportant material damages. This event isan interesting case study to investigate theinteractions between the steep orography of LaReunion Island and a cyclone.For this purpose, two simulations wereconducted with Meso-NH mo<strong>de</strong>l zooming onLa Reunion at a 4 km horizontal resolution:• the first named “Island” with La ReunionIsland,• the second named “Ocean” in which LaReunion Island has been replaced withocean.Both simulations give very similar tracks ofcyclone Dina; “Island” shows a very slightnorthward <strong>de</strong>flection, which has beenobserved in reality but in a more pronouncedway. The island seems to reduce naturaloscillations existing in the eyewall: thecyclone intensity for “Island” is then weaker.Big differences can be seen on the windfield with, for “Island”, weaker winds and amarked subsi<strong>de</strong>nce on the lee of the island.When the strongest winds reached theisland, the stream goes over the islandrather than around it. This excites an orographicwave, which is associated with theintrusion of stratospheric air, as shown bycomparing figures 1a and 1b. This simulatedwave, associated with maximum winds, isconsistent with the observation of strongwinds which have <strong>de</strong>vastated forests in theCilaos cirque, yet sheltered.In addition to the un<strong>de</strong>rstanding of thesemechanisms, high-resolution simulationsare very useful to estimate cyclonic windsand rainfalls over the whole island. Meso-NH has been able to simulate realistic characteristicsof a mature tropical cyclone; in afuture work, we will focus on an earliestcyclone life stage: the cyclogenesis. 19Upper ocean layerresponse to cyclonicconditionsIn spite of significant improvements of hurricanestracks prediction during the lastyears, their intensities are still affected byimportant uncertainties. The poor resolutionand the lack of coupled ocean-atmosphereprocesses in current mo<strong>de</strong>ls are the mainreason for this shortcoming.Hurricanes extract most of their energy fromthe heat stored in the ocean upper-layersthrough the surface heat exchanges. The turbulentmixing induced by wind, waves andcurrents is also an important source of oceaniccooling which has a direct impact on hurricaneintensity.The upper ocean response to the hurricane<strong>France</strong>s in 2004 has been studied using anocean mixed-layer mo<strong>de</strong>l in the Antillesregion (figure a). The comparison of thesimulated sea surface temperatures (SST)with the satellite SST data highlights astrong cooling on the right si<strong>de</strong> of the hurricanetrack and gives a good validation ofthis mo<strong>de</strong>l (figure b).The consequences of such an upper oceancooling on hurricanes life cycle will beshortly investigated with a coupled oceanatmospheremo<strong>de</strong>l. 2014 . Research and <strong>de</strong>velopment: annual report 2007
10°S20°S a - Ground projection of the 26 th of February 2007 at 00 UTC observations :white dots symbolize available observations, black ones those actually used bythe Aladin-Réunion analysis; red crosses locate pseudo-observations whichcorrespond to the cyclone GAMEDE (three-dimensional wind vortex – at 100and 200 km rings and at 10 m, 850, 700, 500 hPa levels – and the mean sealevel pressure at the centre).b - Mean direct cyclone position errors as a function of range of four mo<strong>de</strong>lsover the period 29 th January 2007 at 0000 UTC - 15 th March 2007 at 1200 UTCincluding Dora, Enok, Favio, Game<strong>de</strong>, Indlala tropical systems. Samples are thesame for every mo<strong>de</strong>l and vary from 76 to 50 elements <strong>de</strong>pending on therange. The comparison between "Aladin-Réunion 2008", which uses the newcyclone initialization, and "Aladin-Réunion 2007", which does not, illustratesthe benefits of this technique.ababErreur <strong>de</strong> position (km)1850°E 60°E 70°E250225200175150125100Aladin 200875Aladin 200750Arpege Tropiques(a) <strong>France</strong>s cyclone path25CEPMMTfrom 30/08 to 04/09/2004,00 6 12 18 24 30 36 42and comparison (b) of observedÉchéances (h)and forecasted sea surfacetemperature (SST).ab20ab19 a - Vertical cross section of horizontal wind velocity (colouredisosurfaces in m/s) and wind vectors on 22/01/2002 at 2200 UTCat La Reunion Island location, for the experiment “Ocean” in whichthe island has been replaced by the ocean.b - As in figure (a) but for the experiment “Island”,that means with La Reunion Island orography.15 . Research and <strong>de</strong>velopment: annual report 2007
AmmaAfter the intensive observations periods in 2006, data collectedduring the AMMA campaign were analyzed all along 2007. A firstassessment by the scientific community was ma<strong>de</strong> during theKarlsruhe conference in autumn. The first results are very attractive …Use of data collectedduring the AMMA campaignObservationof the Cold Tongueduring the AMMA/EGEEexperimentsEvery year the Gulf of Guinea is the seat ofan intense cooling along the Equator: this isthe well-known Atlantic Cold Tongue (ACT).This signal is well <strong>de</strong>veloped in the easternpart of the Tropical Atlantic Basin where thethermocline is close to the surface. This coolingbegins usually in May and the seasonalvariations of the sea surface temperatures(SSTs) reach 5 to 7 °C on average. As soon asthis cold anomaly is formed, its northernboundary is in contact with the warm watersof the northern part of the Gulf of Guinea:this generates important north to south SSTgradients as well as a strong discontinuity ofthe sea surface fluxes.One of the main objectives of theAMMA/EGEE program is to i<strong>de</strong>ntify themechanisms which set up the ACT and thecoupling processes between the ACT and theAfrican monsoon. The first results obtainedfrom this program concern the strong SST differencesobserved between 2005 and 2006.These two years are very contrasted in termof ACT formation, since the 2005 ACT is theearliest for the past 25 years; conversely the2006 ACT is one of the latest. Moreover, thistime shift can be related to the <strong>de</strong>lay of theAfrican monsoon observed in 2006 comparedto 2005.The analysis indicates that the ACT coolingin 2005 was sud<strong>de</strong>nly increased after astrong and early wind burst, associated withthe tra<strong>de</strong> winds from the southern hemisphere.This event induced an intense mixingof surface waters with col<strong>de</strong>r waters from theupper thermocline south of the Equator. Thecentral Atlantic also experienced strongwinds as early as April 2005, which largelypreconditioned the surface mixed layersover the whole basin.The VHF windprofiler during AMMAcampaignBetween April 2006 and November 2007,the VHF radar which operated on theNangatchori site (Benin), in or<strong>de</strong>r to provi<strong>de</strong>high-resolution observations of the WestAfrican Monsoon.Every hour, this instrument measured thewind profile above its location from 1.6 to10 km height with a 375 m vertical resolution,giving, in particular, a <strong>de</strong>tailed analysisof the African Easterly Jet and of easterlywaves around 4 km height. Together withlow level phenomena observed by the UHFprofiler, these events have a great influenceon the precipitations occurring in the regionand their consequences on agriculture,health and economical issues.Besi<strong>de</strong>s, the observation of waves in a verylarge spectral range has given importantinformations on the energy budget and onthe momentum transport, thus bringingcomplementary elements about the largescalecirculation and the structure of theatmosphere which characterize of the West-African Monsoon.Finally, the radar reflectivity and the signalwidth on the spectrum allowed an estimationof the atmospheric turbulence. Extractionof the humidity component from theseparameters has contributed to finely tunethe estimation of the water vapour and tocomplete radiometric measurements.The VHF profiler has given very satisfactoryresults during most of its stay in Benin.Hourly measurements have been systematicallycontrolled and sent to the data base ofAMMA Campaign. They inclu<strong>de</strong> the threewind components, radar reflectivity and turbulentdissipation rate. The year 2008 willbe <strong>de</strong>dicated to the scientific exploitation ofthe radar data combined with other remotesensinginstruments installed on the samesite.Humidity biascorrection ofradioson<strong>de</strong>s duringthe AMMA campaignDuring AMMA SOP, the daily number ofradiosoundings performed over WesternAfrica and transmitted on the GlobalTelecommunication System (GTS) was multipliedby 3, but some son<strong>de</strong>s showed systematicbiases.The first objective evaluation showed importantdry humidity biases for stations havingused Vaisala RS80 type radioson<strong>de</strong>s, whichrepresents half of the stations of the AMMAdomain. The station of Niamey (Niger) performed8 soundings / day during the 2 periodsof intensive observations of June,2006 (IOP1, June 20-30, 2006 and IOP2,August 1-15, 2006). During these 2 IOPsVaisala RS92 (good quality) were alternativelylaunched (00, 06, 12, 18 UTC) withVaisala RS80 (03, 09, 15, 21 UTC).The impact of this staggered sampling isvisible in the fig. 1 at Niamey: the dottedline exhibits a serrated shape, where theunrealistic very low values of CAPE correspondto the diagnosis computed from rawRS80 data. A statistically based correctionmethod using the staggered sampling atNiamey is able to diagnose the differentialhumidity bias between the 2 types of Vaisalason<strong>de</strong>s. This bias is plotted in fig. 2, whereone can see 2 maxima: one in the low troposphere(up to 15 %) and the other one inupper troposphere (above 20 %). The solidline in fig.1 corresponds to the CAPE temporalseries with corrected RS80 data; this firstcorrection produces a much more consistentseries. This method was applied to differentsites and validated with in<strong>de</strong>pen<strong>de</strong>nt coinci<strong>de</strong>ntGPS data.After an extensive validation of the methodology,a correction of the whole AMMAdatabase will be performed.1 2 316 . Research and <strong>de</strong>velopment: annual report 2007
4°N 320°104°S- 12Altitu<strong>de</strong> MSL (km)0 4 8 12 16 20Amma - VHF - Nangatchori : FF (m/s)8.07.06.05.04.03.02.0 Evolution of thewind speedmeasured by theVHF profilerbetween 14/06and 23/07/2006.Strong timevariations occurringbetween 2.5 and5 km height areclearly indicated.8°S4°NApril May June July August- 2- 30.081.00.014.6 18.6 22.6 26.6 30.6 4.7 8.7 12.7 16.7 20.714.6.2006 00:00 - 23.7.2006 23:59aCAPE400030000°0.04(J.kg -1 )2000100004°S8°S Hovmüller diagrams of the difference between 2006 and 2005 forthe sea surface temperatures (top) and for the wind stress (bottom).Note that SST differences of nearly 3 °C appear soon after a strongwind burst coming from the southern hemisphere in May 2005.Range (km)1512963022 septembre 2006 - Vol 72 - Leg1 FL 25014.2 14.3 14.4 14.5 14.6 14.7 14.8 14.9Time (hour)14.345114.344814.344114.343014.342814.390914.390814.390714.390514.3904Images (capteurs 2DC, taille 25 µm) (images <strong>de</strong> surface > 0,125 mm 2 )Permet <strong>de</strong> connaitre l’équilibre entre givrage/aggrégation14.425414.425214.424714.424314.424114.500814.500614.500514.500314.500222.9.2006 H = 14.8600 : 14.87022.9.2006 H = 14.9100 : 14.92022.9.2006 H = 14.9200 : 14.93010.00010.00010.0000 cm-3 µm-11.0000.1000.0100.00- 0.04- 0.0810 cm-3 µm-11.0000.1000.0103b-10001 2 3 4 5 6 7 8 9 10 11 12Day of August 2006T (°C)- 60- 40- 200- 5- 10- 15- 20- 25- 30Distribution dimensionnelle<strong>de</strong>s particulesObservation <strong>de</strong> spectres bimodauxcaractérisés par <strong>de</strong>s processus<strong>de</strong> croissance différents(givrage/aggrégation)0.001 0.001 0.00110 100 1000 10 000 10 100 1000 10 000 10 100 1000 10 000Diamètre (µm)Diamètre (µm)Diamètre (µm)0200- 4 - 800 cm-3 µm-120 40 60 80 100RH (%)1.0000.1000.010- 16- 4- 20- 8Nighttime- 124- 12- 8- 8- 4- 4- 20- 16- 12- 8- 4 a - Time evolution of theCAPE computed every 3 hoursfrom radiosounding ascents atNiamey. The solid line is forcorrected data, the dashed linefor uncorrected data. Sha<strong>de</strong>dbackground for night, whitebackground for day.b - Night humidity bias(in shading) of the Vaïsala RS80son<strong>de</strong>s relative to RS92 son<strong>de</strong>sat Niamey. The axes aretemperature and relative humidityas observed by RS80 son<strong>de</strong>s.Superposed dashed linescorrespond to 1 st and lastpercentiles (10 % and 100 %cumulative distribution functionisolines respectively). Saturationline relative to ice has beensuperposed (thin line with dots). Vertical cross-section of radar reflectivity(colours) characterizing the ice content and thesize of particles as observed by the zenith andnadir antenna of the RASTA radar onboardFrench Falcon 20 within a Cb anvil. The otherscurves correspond to microphysics in situmeasurements.%4Observationof anvils duringthe AMMA SOPThe stratiform and cirriform parts formed atthe rear of the convective parts of tropicalmesoscale convective systems last fromseveral hours up to several days. Thesewi<strong>de</strong>spread anvils have an importantimpact at large scale, and may modulatethe monsoon components due to theirradiative forcing.The AMMA Specific Period of Observations(SOP) in 2006 allowed for the 1 st time todocument the internal properties of tropicalanvils by combining remote sensing measurements(radars, lidars) from surface, aircrafts(microphysics, RALI) and from space(CloudSat, CALIPSO). The objective is,through the treatment of those measurements,to document the dynamical, microphysicaland radiative properties of theseanvils and cirrus clouds at different scales,and to evaluate their impact on the complexWest African monsoon system.The exploitation of these data have alreadyallowed to document several anvils case17 . Research and <strong>de</strong>velopment: annual report 2007studies and the calibration/evaluation ofthe RASTA radar. The comparison of Cloudsatdata with RASTA radar revealed theoccurrence of multiple scattering effects inspaceborne measurements. This result mayhave important implication to quantitativelyexploit the Cloudsat measurements and toelaborate climatologies of cloud properties(Bouniol et al. 2007). 4
5 Time-latitu<strong>de</strong>diagram of ECMWFanalysis precipitablewater (colours inkg.m -2 ), meansea-level pressurefiltered to removediurnal variability(black iso-contoursin hPa) and 925 hPadaily wind (blackarrows in m.s -1 )averaged over0-10 E for 15 Mayto 30 June 2006. Spatial structure of the first variability mo<strong>de</strong> for daily 2 m temperature, calculatedfrom NCEP reanalysis data (1950-2007).6First results from studiesled within the AMMA campaignMonsoon flux pulsationin West Africa:a fine-scale mo<strong>de</strong>of intra-seasonalvariabilityThe establishment of the monsoon flux overWest Africa has not been extensively exploredand previous studies have focused on relativelylarge time-scales (> 10 days) and spatial(> 2°) scales. For the first time, we focus hereon the variability at higher frequency.When the West African monsoon sets in, iterativenorthward excursions of the monsoon fluxare frequent. Quasi-periodic northward excursionsof highly precipitable water are evi<strong>de</strong>ntnorth of 14 N in ECMWF analysis (fig. 5). Thesepenetrations last for about two days. They followa maximum of intensity of the heat low(extension and minimum of pressure) and areconcomitant with an intensification of themonsoon flux (fig. 5). Such pulsations are partof the intra-seasonal variability. They are better<strong>de</strong>fined at the beginning and at the end ofthe monsoon than during the monsoon itself(when interaction with convection leads to differentcharacteristics). These pulsations arestationary or westwardly propagative <strong>de</strong>pendingon their interaction with easterly waves.The following mechanism is proposed toexplain such pulsations: the <strong>de</strong>velopment ofdry convection induces an increase of the heatlow and of the relative vorticity and mayexplain such pulsations. This leads to an aspirationof the monsoon flux that brings moistureand which explains the increase inprecipitable water. The monsoon flux alsobrings cooler air which tends to <strong>de</strong>stroy theheat low.Future works will analyse mesoscale simulationsand observations in or<strong>de</strong>r to confirmthe proposed mechanisms. Moreover, thefactors that can modulate the characteristicsof such pulsations will be explored.5Variabilityof the African Heat Lowand its link withmid-latitu<strong>de</strong>sIn the frame of the AMMA project, a particularregard has been <strong>de</strong>voted to the Saharian thermal<strong>de</strong>pression (Heat Low), especially duringthe 2006 summer measurement campaign.The climatic approach of the phenomenonallows to replace the 2006 season among thelast 50 years seasonal observations.By using an Empirical Orthogonal Functionmethod on the daily datas from NCEP andECMWF reanalyses, we i<strong>de</strong>ntified a robustmo<strong>de</strong> of variability of the 2 m temperatureover North Africa. This mo<strong>de</strong> presents a characteristictime of 20 to 30 days and an East-West dipolar spatial structure, opposing thecoastal Morocco and Mauritania region withcentral Libya (see figure).By isolating the successive maxima andminima during the 58 last years (1950-2007), we reconstructed the global dailyatmospheric fields leading the extrema ofthis mo<strong>de</strong>. These composite fields show arelation between the Heat Low and mid-latitu<strong>de</strong>conditions. In<strong>de</strong>ed, the 4 summer weatherregimes established by CERFACS, whichare equally distributed in average, are fairlywell discriminated when Heat Low phasesare consi<strong>de</strong>red. The positive phase (col<strong>de</strong>rwestern part) corresponds, in 75 % of thecases, to a blocking or NAO- regimes whilethe negative phase corresponds to NAO+ orAtlantic ridge in the same proportions.Knowledge of the links between Heat Lowand weather regimes may allow an increaseof the prediction potential in this region,particularly if, in the same time, the role ofthe Heat Low in the monsoon behavior isassessed more <strong>de</strong>eply. 6Validation of convectiveparametrizationschemes on westernAfrica with theALADIN-CLIMAT mo<strong>de</strong>lIn large-scale mo<strong>de</strong>ls, mean effect of convectiveprocesses on a grid-mesh is computed ina simplified representation called convectiveparametrization. The behaviours of differentconvective parametrization schemes availablein the global ARPEGE-CLIMAT mo<strong>de</strong>l arestudied, focussing on western Africa.Then, comparisons are ma<strong>de</strong> between finemeshsimulations in which convection isexplicitely computed (non-hydrostatic Méso-NH simulation with a 5 km horizontal gridmesh)and simulations run on the samehorizontal area, with the same initial andlateral conditions, with the ALADIN-CLIMATLimited Area Mo<strong>de</strong>l (LAM), in which convectiveprocesses are parameterized. The caseun<strong>de</strong>r study is that of a squall line observedon western Africa in August 1992 during theHapex-Sahel experiment.The results obtained in an ALADIN-CLIMATsimulation with a 125 km horizontal gridmeshexhibit the different behaviours of thetested parametrization schemes and theimproved precipitation pattern obtainedwith some of these schemes. Developmentof relevant diagnostics and tests on thehorizontal grid-mesh used in the LAM areplanned, before applying the methodologyto cases observed during the AMMA fiel<strong>de</strong>xperiment (summer 2006).These studies participate in improving currentand un<strong>de</strong>r <strong>de</strong>velopment parametrizationschemes. 718 . Research and <strong>de</strong>velopment: annual report 2007
7RR−Conv (mm/h) + MOCON + vent 700 hPa− (21−08−1992/00 h)HX125 / ECH = 18 h5˚10˚20˚20˚11RR−Conv (mm/h) + CAPE (J/KG) + vent 700 hPa− (21−08−1992/00 h)HX125int / ECH = 18 h5˚10˚20˚600000050006000700030004000110100020003000400050007000600050003000200015˚22321112332122115˚10003000200040005000600070003000400050006000700 070004000500 060003000400020003000400015˚ a) Explicit precipitation field simulatedwith the 5 km horizontal grid-meshmo<strong>de</strong>l over western Africa (colours).Arrows: winds at 650 hPa. 21 August1992, 18 UTC.b) Convective precipitation field(colours) and winds at 700 hPasimulated with ALADIN-CLIMATover the same domain. Standardversion of the physical package(ARPEGE-CLIMAT V4).Convection triggering is <strong>de</strong>terminedby the parameter <strong>de</strong>scribed bythe red isolines.c) Convective precipitation field(colours) and winds at 700 hPasimulated with ALADIN-CLIMATover the same domain. Improvedversion of the physical package.Convection triggering is <strong>de</strong>terminedby the parameter <strong>de</strong>scribed bythe red isolines.ab10˚421311211231231233410˚5˚10˚5˚10˚1.5 4.0 0.0 0.5 1.0 2.0 3.0 8.0 0 1 2 3 4 5 6 7 88700030 00600040002000500080003000700060004000200050001000300020006000400010005000300020006000400010005000100030001000200020010˚c Comparative maps of visible albedos for MSG (top left) and MODIS (top right) for the period from 12 to 26 July 2006 for the AMMAzone. The magnitu<strong>de</strong> of relative errors (bottom left) is explained by the relative bad/good ? quality of MODIS product (bottom right).The SAF programme on Land Surface Analysis:an operational production exten<strong>de</strong>d to AfricaThe SAF (Satellite Application Facility) programmeon Land Surface Analysis (LSA) producesoperationally surface variables from theobservations of MSG and EPS EUMETSATsatellites. LSA SAF is placed un<strong>de</strong>r the controlof EUMETSAT who gave responsibility for pilotingand for the production to the Institute ofMeteorology of Portugal. The consortiumencompasses 8 cooperative entities with 4representing <strong>National</strong> Meteorological Services(Belgium, Finland, <strong>France</strong>, Portugal). The projectwill move into its operational phase inMarch 2007.The project inclu<strong>de</strong>s 5 types of products (operational,internal operational, candidate operational,<strong>de</strong>monstrative, experimental) generated atthe nominal spatial resolution of MSG.Operational products only are available forpublic access over the MSG disk (www.landsaf.meteo.pt).They are the albedo, the surfacetemperature, the short-wave and long-waveradiation fluxes, and the snow cover.CNRM is responsible for albedo and down-wellingsurface short-wave radiation flux. Their validationis achieved through a comparison within situ measurements and equivalent satellite19 . Research and <strong>de</strong>velopment: annual report 2007products. As for Europe, this latter was exten<strong>de</strong>dto spatial domains, the kriging networkRADOME for radiation flux and MODIS imageryfor albedo. An utilization of the albedo withinSURFEX was initiated. An special effort wasma<strong>de</strong> for a validation over Africa, taking benefitfrom in situ data from the AMMA programme.In 2008, it will consist to initiate the mergingbetween MSG and EPS data, with, as a firstgoal, to extend the geographic coverage tohigh latitu<strong>de</strong>s for all products, and to combineoptimally the geostationary and polar observationsfor albedo over the MSG disk. 8
MeteorologicalprocessOne cannot un<strong>de</strong>rstand and forecast meteorological processwithout an excellent knowledge of the atmospheric mechanisms.All along 2007, works on cyclogenesis went on, some significantprogress were ma<strong>de</strong> around carbon cycle mo<strong>de</strong>lling, …Cyclogenesis and previsibility studiesCritical regions of upper-troposphericdisturbances regenerationMid-latitu<strong>de</strong> synoptic-scale anomaliesappear in the upper troposphere and evolvealong the jet streams. These upper-troposphericanomalies are usually strongly stretcheddue to the action of the <strong>de</strong>formationfield of the jet along which they evolve, leadingto a loss of their energy. However, thesame anomalies can be temporarily regeneratedif they cross the jet. Jet crossing occurspreferentially in specific points along the jetaxis, called critical points, as shown by thefigure.In each figure panel, the same green triangleappears. It is a remarkable point of the jetand more precisely it is a saddle point of anew key field called effective <strong>de</strong>formationwhich is represented by its positive values inlight red shading. Two simulations using abarotropic mo<strong>de</strong>l on the sphere are compared,one with all the terms (the nonlinearcase) and the other with linear terms only(the linear case). In the nonlinear case, theperturbation is first strongly stretched on thesouthern si<strong>de</strong> of the jet, then it crosses thejet around the critical point. At this moment,the perturbation is characterized by acontraction stage leading to an increase ofkinetic energy. In the linear case, the perturbationremains on the southern si<strong>de</strong> of thejet, it does not cross the jet and it keepsstretching which results in a strong loss ofkinetic energy.To conclu<strong>de</strong>, the un<strong>de</strong>rlined mechanism<strong>de</strong>pends on the combined effects of the effective<strong>de</strong>formation and nonlinearities and is notrelated to any linear instability. 1Towards an objective methodto <strong>de</strong>fine humidity anomaliesSynoptic-scale <strong>de</strong>pressions can be <strong>de</strong>scribedwith the potentiel vorticity field, thatsummarizes all the dry dynamical aspects,and a field that quantifies humidity.Whereas moisture is classically consi<strong>de</strong>redas modulating the growth of North-Atlantic<strong>de</strong>pressions, the effect of water –more preciselyits phase changes– on Mediterraneanstorms seems to be much more central. A<strong>de</strong>scription aiming at a better un<strong>de</strong>rstandingof the evolution of these synoptic systemsmust therefore inclu<strong>de</strong> informationabout moisture.Newly <strong>de</strong>fined methodologies at CNRM,namely wavelet <strong>de</strong>composition for extractingtropopause folds, have been exten<strong>de</strong>dto humidity fields: specific or relative humidityor even other <strong>de</strong>rived fields. Finding allthe anomalies in a field requires two steps:firstly, the large-scale environment shouldbe separated from all the anomalies, each ofwhich has then to be isolated from theothers. The first step has been refined inor<strong>de</strong>r to relax some assumptions ma<strong>de</strong> onthe anomalies properties, that hold forupper-level potentiel vorticity but are notrelevant for moisture fields. This leads toadd a small portion of the large-scale of thetotal field to the small-scale in or<strong>de</strong>r to buildthe "anomalies" field.In the near future, effort will be ma<strong>de</strong> to usethis field to <strong>de</strong>fine individual anomalies. 2The wavelet extractionimproves the coherenceof potential-vorticitystructuresMid-latitu<strong>de</strong> storms often result from theinteractions between a low-level vortex andan upper-level one. The inversion of potentialvorticity provi<strong>de</strong>s a technique to attributethe meteorological fields (wind andtemperature) to each vortex, and to studytheir interactions. The results <strong>de</strong>pend on thetechnique used to extract these vortices. Weshow hereafter that the new objectivemethod of extraction based on wavelettheory gives a structure that is more coherentin time than the more classical and subjectivemonopolar extraction.If an anomaly is extracted at some initialtime, its evolution may be predicted as thedifference between the simulation with theinitial anomaly and the simulation withoutit. The result is a predicted anomaly. At thesame final moment of the forecast, anotheranomaly may be extracted from the predictedtotal field. If the anomaly interacts onlywith its environment, both anomalies mustbe similar. This criterium is a way to assessthe performance of the extraction. From thefigure, it is obvious that the wavelet anomalies,predicted and extracted, are quite similar,which is not true for the monopolaranomalies, which is much dispersed by themo<strong>de</strong>l simulation. This property makes thewavelet extraction preferable for the study ofthe interactions leading to storms and alsofor its numerical applications. 320 . Research and <strong>de</strong>velopment: annual report 2007
170 Nonlinear (left) and linear (right)evolution of a synoptic-scaleperturbation moving alonga jet with a critical point representedby a black triangle about 25° W, 54° N.Upper and lower panels correspond to 36 hand 48 h after the initial time. Blue contoursare the jet wind speed isolines (interval:10 m/s for values greater than 20 m/s).Light red shading, black arrows and heavyblack isolines represent respectively regionsof positive effective <strong>de</strong>formation(interval: 5 10 -10 s -2 ), the dilatation axesand the perturbation vorticity(interval: 2.5 10 -4 s -1 , dashed and solidcontours for negative and positive values).20303020Non linéaire, T = 36 hLinéaire, T = 36 h30-50 -40 -30 -20 -10 0 -50 -40 -30 -20 -10 0702030302050502030302020303020Non linéaire, T = 48 h30Linéaire, T = 48 hab Several <strong>de</strong>compositions of thespecific humidity field at 850 hPa,01/12/2001, 00 UTC,contour interval : 1g/kg.(a) total field (blue below 10g/kg,red above 10g/kg);(b) 8-day high pass filtered fieldcomponent (blue below -1g/kg,red above 1g/kg);(c) small scale wavelets componentof the field (same contouring as in b),(d) the set of all anomalies extractedwith the fully exten<strong>de</strong>d algorithm(same contouring as in b).2cd Coherence between the predictedanomalies (left) and the extracted anomaliesat the same time (right) for the waveletextraction (top) and for the monopolarextraction (bottom). The study focuseson the upper-level vortex associatedwith the 27 December 1999 storm.The initial extractions are ma<strong>de</strong> fromthe fields on the 27 th at 06 UTC, and fromthose in the 6 h forecast so thatthe final extractions are ma<strong>de</strong> on the 27 that 12 UTC. The shown fields are:the relative vorticity of the anomalyat the 350 hPa level (interval 5 10 -5 s -1 ,positive in orange shading, negative in blueshading), and the geopotential of itsenvironment at 350 hPa (interval 20 damgp,bold line). With the wavelet method,the anomaly are more coherent thanthe monopolar one.321 . Research and <strong>de</strong>velopment: annual report 2007
4Routine20 juin 2007 à 21 h TU Top chart.Blue shading: areas of need calculated forthe case of 2007 June 21 at 00 h UTC,taking into account both the sensitivity ofthe forecast to its initial conditions and theuncertainty on the guess;Red shading: same sensitivities plus thatto the analysis of routine radiosoundings(RS). These areas are valid 15 hoursbefore the event (forecast valid for June21 at 12 UTC in the region shown with adotted circle).Obs.débutObs.milieuObs.fin20 juin 2007 à 21 h TU 21 juin 2007 à 00 h TU 21 juin 2007 à 03 h TU Histogram.Prediction of the error variance reductionfor the function with respect to which thesensitivity calculations were performedand due to the addition of the adapted RS(% of the reduction induced bythe assimilated routine network againstthe first guess). These ad<strong>de</strong>d RS were<strong>de</strong>ployed with a variable <strong>de</strong>lay withinthe assimilation time window, as shownin the legend of the histogram (middleand end, respectively).Réduction <strong>de</strong> variance d´erreur (%)40.7838.8436.8934.9533.0131.0629.1227.1725.2323.2820 juin 2007 à 21 h 21 juin 2007 à 00 h 21 juin 2007 à 03 hobs.début obs.milieu obs.finDate <strong>de</strong> référence : 21 juin 2007 à 00 h TU Bottom charts.Areas of residual need resulting from theassimilation of the exten<strong>de</strong>d network:routine RS plus additional RS drawnin the same colour (orange, greenor purple) and with the same name(obs.start, obs.mid or obs.end) than onthe histogram. The valid time is givenon the figure. Dashed red contours <strong>de</strong>pictthe areas where uncertainty is reduceddue to the exten<strong>de</strong>d network.Prediction of the benefit of optimally located observationsAdaptive observation consists in the additionof observations in so-called sensitiveareas computed to improve (locally) a numericalweather prediction. Linear techniques(using adjoint calculations) have been <strong>de</strong>signedto investigate the sensitivity of forecaststo their initial conditions (ie. analysis,or the observations being assimilated tocompute the former).To <strong>de</strong>sign the most profitable <strong>de</strong>ployment ofadditional observations, a quantitative tool isused in ARPEGE that compares the expectedbenefits from a variety of simulated additionalobservation networks (see histogram onthe figure). The method (called KFS) computesan estimate of the uncertainty residingin the analysis (which is the initial conditionsof the forecast of interest). Part of the co<strong>de</strong>comes from ECMWF.The national CYPRIM project focuses on largescale aspects of Mediterranean cases representativeof heavy rainfall events. The firststeps of the KFS computation <strong>de</strong>al with theroutine observations only. These results maybe used to <strong>de</strong>sign the extra <strong>de</strong>ployments tobe evaluated during the last steps of the KFS.The figure shows the expected benefit ofthree <strong>de</strong>ployments (10 soundings each, all22 . Research and <strong>de</strong>velopment: annual report 2007simulated, displayed on the histogram). It furthershows the zones of needs where theaddition of these observations is likely to bebeneficial to the quality of the forecast. Thisshows a June 2007 case, using only TEMP(radiosoundings, RS) observations. The locationsof the 3 <strong>de</strong>ployments are similar, theydiffer primarily by the <strong>de</strong>ployment time:either early (case shown), middle or late inthe 4D-Var assimilation time window. Thelatest <strong>de</strong>ployment promises the highestimpact, which is consistent with the 4D-Vartheory. 4
Vertical cross section of the vertical velocity (in m.s -1 )after 3000 s integration for orographic trappedwaves induced by the hill in a west to east flow.On the left with the previous/former advectionschemes, on the right with the new ones.6 0005 4004 8004 2003 6003 0002 4001 8001 2006 00(min : -0.445E + 01, max : 0.590E + 01)2.0001.8001.6001.4001.2001.0000.8000.6000.4000.2000.100-0.100-0.200-0.400-0.600-0.800-1.000-1.200-1.400-1.600-1.800-2.00000 6 700 13 400 20 100 26 800 33 500WWT m/sTime = 3 00065 Sensitivity experiments to the low-level flow speed:Cold pool (virtual potential temperature in colour scale, K), 24 h accumulatedprecipitation (purples lines: 50, 250, 500 and 750 mm; the maximumis indicated), updrafts (red areas, > 1m/s) and downdrafts (yellow areas,< -0.5m/s) at 1000 m, wind vectors at 10 m (black arrows, m/s) after48 h for the reference simulation (REF) and for the experiences of sensitivityto the wind speed of the low-level flow with a slower jet (WIN10)or a faster one (WIN20). The relief is represented in grey scale above 500 m.Meso scale eventsA new advection scheme for Meso-NHMeso-NH, is a research mo<strong>de</strong>l used to simulatereal and aca<strong>de</strong>mic mesoscale flows,with a scale resolution currently rangingfrom 50 km to 10 m, which, until now, usedstandard transport algorithms, associatedto a “leap-frog” time stepping scheme. Butthe drawback was a strong time step limitationwhich prevented getting accurateresults. Therefore, one major objective wasto increase the time step of Meso-NH with ahigher quality advection scheme.A new Eulerian advection scheme has beensuccessfully implemented for scalar variables,associated with a “forward in time”temporal scheme for the advection termsand a fourth or<strong>de</strong>r centred advectionscheme for momentum. The impact is highlypositive in terms of accuracy and stability(figure). But the increase of the time stepshould become more efficient once the“leap-frog” temporal scheme will have evolvedto a new temporal scheme for the overallmo<strong>de</strong>l. 5I<strong>de</strong>alized mo<strong>de</strong>lling framework for quasi-stationary convective systemsSouth-eastern <strong>France</strong> is prone to heavy precipitationinduced by quasi-stationarymesoscale convective systems. An i<strong>de</strong>alizedmo<strong>de</strong>lling framework has been set-up inor<strong>de</strong>r to study the sensitivity to low-levelconditions on the location and the intensityof these systems.Atmospheric simulations are performedwith the MESO-NH research mo<strong>de</strong>l at 2.5 kmfor an i<strong>de</strong>alized moist unstable flow, andusing real topography. Thus, an unstablelow-level jet pointing towards the Cévennesis imposed.The reference simulation succeeds in simulatinga quasi-stationary convective system.Precipitations spread from the Sea to theMassif Central. The evaporation of part ofthe (falling) precipitation induces a coldpool un<strong>de</strong>r the system. The low-level jetimpinges the leading edge of this cold pool,inducing upward motions that trigger newconvective cells.The characteristics of the low-level flow overthe Sea (humidity, wind speed, instability)are varied. The figure shows the sensitivityto the wind speed: the slower the flow, themore upstream the system is located. Also,the drier the environment is or the more unstablethe flow, the more upstream the systemis located. Different lifting mechanisms23 . Research and <strong>de</strong>velopment: annual report 2007compete to explain the specific location ofthe systems (orographic forcing, cold pool,low-level convergence due to relief).In future work, we will continue to explore thepredictability associated to these systemsthrough this i<strong>de</strong>alized framework by investigatingmore systematically the low-level conditions;the impact of the relief and theMediterranean Sea will be assessed too.6
The programme ECOCLIMAP-II:a new land cover classification over EuropeThe ECOCLIMAP programme encompasses aland cover classification and a database ofsurface parameters inferred from the classificationbased on look-up tables.A new classification of the vegetation inareas thematically and functionally homogeneoushas been achieved over Europe. Theinitial classifications are Corine2000 at100 m for most of the domain and GLC2000at 1 km (Global Land Cover 2000, 1 year ofSPOT/VEGETATION data) for the rest of thedomain. They have been split, based on anautomatic classification, consi<strong>de</strong>ring 7 years(1999 to 2005) of data of the vegetationin<strong>de</strong>x SPOT/VEGETATION with a disregardthis time to climate zoning. This has led to273 classes. The criteria account for in<strong>de</strong>pen<strong>de</strong>ntfactors from vegetation cover likethe climate or the agriculture mo<strong>de</strong>s imple-mented at the regional level. An in<strong>de</strong>pen<strong>de</strong>ntvalidation consi<strong>de</strong>red the statistical datasets issued from agricultural practices in<strong>France</strong>.The classes are disaggregated in one or severalfractions of vegetation types from ISBA.This work relies in the new version on thesearch of pure pixels at 1 km of a vegetationtype. The variable to disaggregate is the leafarea in<strong>de</strong>x, which is less contaminated by soileffect than the vegetation in<strong>de</strong>x. The leaf areain<strong>de</strong>x and albedo are the more relevant variablesof ECOCLIMAP. In the new version, theyare <strong>de</strong>rived from the combination of the 1 kmproducts MODIS and VEGETATION (Europeanproject CYCLOPES).The follow-on of this work is the implementationof test cases in SURFEX in or<strong>de</strong>r to assess theimpact of the new database ECOCLIMAP. 7Spatial variation of atmospheric CO 2 :the CarboEurope RegionalExperiment Strategy CERESContinental carboncycle mo<strong>de</strong>llingA new option of the CNRM land surfacemo<strong>de</strong>l, ISBA (Interactions between Soil,Biosphere and Atmosphere) was <strong>de</strong>velopedin or<strong>de</strong>r to represent the terrestrial componentof the carbon cycle. The new mo<strong>de</strong>l,referred to as ISBA-CC (Carbon Cycle) simulatesthe main carbon fluxes exchanged betweenthe continental surface and theatmosphere (photosynthesis, autotrophicrespiration and heterotrophic respiration),as well as the stocks and the fluxes of carbonin the vegetation and in the soil.The mo<strong>de</strong>l was validated for 26 sites of theFLUXNET network located at middle and highlatitu<strong>de</strong>s of the Northern Hemisphere, whichprovi<strong>de</strong> measurements of energy, water andcarbon fluxes. The mo<strong>de</strong>l reproduces wellthe main properties of the diurnal andannual cycles, as well as intra-seasonal andinter-annual variability. It also favourablycompares with other terrestrial carbonmo<strong>de</strong>ls, among which the ORCHIDEE mo<strong>de</strong>lof IPSL.The ISBA-CC mo<strong>de</strong>l will further be coupledwith the general circulation mo<strong>de</strong>l of CNRM,ARPEGE-Climat, along with the other componentsof the carbon cycle, to simulate thefeedbacks between the carbon cycle and theclimate. 9A methodology to simulate the spatial variationof CO 2 within the Atmospheric boundarylayer (ABL) based on observations has been<strong>de</strong>veloped during the CarboEurope RegionalExperiment CERES. This year, a lot of effort hasbeen <strong>de</strong>voted to the numerical interpretationof the data collected during the CERES 2005field campaign.Five atmospheric meso scale mo<strong>de</strong>ls, includingan interactive simulation of CO 2 betweenthe surface and the atmosphere, have beenevaluated against a large variety of data (figure8): flux of CO 2 close to the surface, ABL diurnalevolution in the Lan<strong>de</strong>s forest, spatial variationof CO 2 in the ABL as observed by the PiperAztec instrumented aircraft. The 5 meso scalemo<strong>de</strong>ls showed a good ability to simulate CO 2assimilation over a wheat field (a). However, alarge scatter was found in the simulations ofCO 2 observed by the aircraft within the ABL (c)as a result of large differences noted in thesimulation of the ABL evolution (b).Two new experiments have been conductedduring April and September 2007 in or<strong>de</strong>r tosample different meteorological conditions andcrop <strong>de</strong>velopments. 824 . Research and <strong>de</strong>velopment: annual report 2007
Land cover classificationECOCLIMAP-II overEurope with 273 classes.78 An inter comparison of 5meso scale atmosphericmo<strong>de</strong>ls against observationscollected in June, 6 duringCERES 05:(a) comparison withobservations of CO 2over a wheat field,(b) with the vertical profileof potential temperatureobserved withinthe Lan<strong>de</strong>s forest(c) with the variation of CO 2in the ABL monitoredwith/by the instrumentedPiper Aztec aircraft.abc9Corrélation au carré - NCARB CENT - LE (moyennes mensuelles)1.00.8r2 (-)0.60.4Square correlations between the monthlymeans of the latent heat flux (LE, top) andof the net carbon flux (NEE, bottom) measuredin 26 FLUXNET sites and simulated by ISBA-CC(blue circles) and by ORCHIDEE (red diamonds).r2 (-)0.20.01.00.80.60.40.20.0GU HE HV SO VI WB FL HY NO AB BR BX LD ME TH WE SKo SKy CP PO BVS BVC UP LW SHCorrélation au carré - NCARB CENT - NEE (moyennes mensuelles)GU HE HV SO VI WB FL HY NO AB BR BX LD ME TH WE SKo SKy CP PO BVS BVC UP LW SH25 . Research and <strong>de</strong>velopment: annual report 2007
Taux <strong>de</strong> détection100806040200-0,5-1-1,5H + 1SIRSIR_ASSIR_RECAL00 20 40 60 80 100Taux <strong>de</strong> fausses alertesValeur économique Ve0,10,80,60,40,2H + 1SIR_BRUTSIR_ASSIR_REC0,00,0 0,2 0,4 0,6 0,8 100Alpha ROC diagrams (left) and cost/lossdiagrams (right) for the first hourlyforecast and for each mo<strong>de</strong>ls:brut mo<strong>de</strong>l (SIR_BRUT), mo<strong>de</strong>l withstatistical adaptations (SIR_AS)and mo<strong>de</strong>l with in situ measurements(SIR_RECAL). For SIR_RECAL andthe 0 °C threshold, we obtain a hit rateequal to 90 %, a false alarms equalto 10 % and a great economic interestof the mo<strong>de</strong>l for small cost/loss ratios.10Evaluation of a numerical mo<strong>de</strong>lfor the simulation of surface temperatureinstalled for “Aeroports <strong>de</strong> Paris”Thanks to a great collaboration between ADPLABO and the Studies Department of Météo-<strong>France</strong> in Paris, a numerical mo<strong>de</strong>l for thesimulation of surface temperature over twotaxiways of PARIS-CDG airport was tested.This mo<strong>de</strong>l was used with predicted data(from the ARPEGE French meteorologicalmo<strong>de</strong>l) in or<strong>de</strong>r to evaluate its behaviour inoperational conditions. In particular, it wastested during the 2004-2005 and 2005-2006winters on the taxiways of Paris-CDG airportthanks to the in situ measurements from ADPLABO. In or<strong>de</strong>r to evaluate the so-called SIRmo<strong>de</strong>l in operational conditions of uses, themo<strong>de</strong>l was run in real time with predictedatmospheric data, and real time road temperaturemeasurements during the 2006-2007winter.Two different ways of evaluation were investigated.The first one was done through simpleFor some meteorological situations, on therunway of Nice airport, sud<strong>de</strong>n wind shifts areobserved, turning abruptly from a western toan eastern sector, or conversely. This phenomenonstrongly disrupts the air traffic controlof Nice airport and leads to turbulences thatcan be dangerous for aircrafts.A first study was conducted using the mesoscaleresearch mo<strong>de</strong>l MESONH, with a 500meters mesh version, on a representative dayof this phenomenon. By comparing the verticalstructure of the predicted winds and thediverse available observations (low layers andplane soundings), we notice that MESONHsucceeds in representing a phenomenonrather alike the one that occurred, but not atthe right location (a gap of about 20 kilometersfor the eastern wind zone) and with a wrongtiming (4 hours in advance for Nice). We thenstatistics scores, such as Root Mean Square,bias,… for each hourly time step. With a negligiblebias, a good RMS for the first 6 hourlyforecasts (between 0.5 and 1.5 °C) <strong>de</strong>spite a<strong>de</strong>crease of up to 2 °C for the 24 h forecast,the global results are satisfactory. The secondway to evaluate the numerical mo<strong>de</strong>l is to testits interest for frozen soil risk management.For each hour, contingency tables associatedwith hit rates and false alarms are producedwhich give an estimate of the economic valueof the mo<strong>de</strong>l as a function of cost/loss ratio.This one largely <strong>de</strong>pends on the user needs.By the way, the curves that were obtained givean i<strong>de</strong>a of the interest of the mo<strong>de</strong>l. The benefitsseem important for the 6 first hours forecast,and <strong>de</strong>crease progressively when theforecast term increase. Nevertheless, it seemsto be a good first step for using such a mo<strong>de</strong>las a help for frozen risk management. 10Mesoscale studies of wind shiftsover the Nice regionused a prototype of the AROME mo<strong>de</strong>l, whichwill become at the end of 2008 METEO-FRANCEoperational mesoscale mo<strong>de</strong>l (2,5 kilometersmesh). Nine globally similar meteorologicalsituations over the Nice region were simulated,some leading to wind shifts on the airport platformand some not. In a majority of the treatedcases, the opposition streams zones are realistic.The location of the wind shifts is not alwaysprecise, but we do think that the AROME mo<strong>de</strong>lmight drag the forecaster’s attention to a possibleoccurrence of the phenomenon more efficientlythan ALADIN, the current operationalmo<strong>de</strong>l.At the end of 2008, the AROME mo<strong>de</strong>l willbenefit from a specific observations analysis.We expect further improvements of the forecastof the Nice wind shift phenomenon. 11Three-dimensionalmeasurements of stablestratified turbulenceAtmospheric turbulence is often subject tonegative buoyancy effects due to a stableatmospheric stratification. Although theeffect is globally stabilizing, the resultingdynamics and structure are still only partiallyelucidated due to the complexity of the phenomenaand to the difficult access to fullyturbulent regimes by either direct numericalsimulations or laboratory experiments.In this situation in particular, the effects ofviscosity become important quite rapidly. Inthe laboratory (wind-tunnels, hydraulic tanksor flumes) recently <strong>de</strong>veloped non-intrusiveoptical methods make possible the measurementof two-dimensional turbulent velocityfields. However, in the fully turbulent regimesof interest in stratified environments, thesetechniques have not been applied due to thestrong variations in optical indices of refractioninherent to the <strong>de</strong>nsity stratificationwhich significantly distort the optical paths (asimilar problem is also encountered for earthbasedtelescopes).Another challenge is to be able to measurethe three-dimensional velocity field to better<strong>de</strong>scribe and un<strong>de</strong>rstand the three-dimensionaland anisotropic dynamics. It also enablesdirect measurement of the Lagrangian dispersion,crucial for mo<strong>de</strong>lling dispersion ofgaseous pollutants (for example aircraftwakes).For this purpose, a rapid three-dimensionalparticle image velocimetry (PIV) techniquewas <strong>de</strong>veloped in collaboration with IMFT(Toulouse) and researchers in the USA, whicheliminates the in<strong>de</strong>x of refraction problemsand yields time-resolved three-dimensionaland three-component velocity field measurementswith a spatial resolution as good asthe two-dimensional technique. One suchexample in a regime which is still highlythree-dimensional and turbulent is shown infigure. 1226 . Research and <strong>de</strong>velopment: annual report 2007
11 MESONH predicted 10 meters windon 12 march 2005 at 13.30 UTC(wind speed in m/s). The wind shiftphenomenon is realistically simulated,but with a gap in space and time patterns.12 Uvelocity field measured in a stratified turbulent flow27 . Research and <strong>de</strong>velopment: annual report 2007
Climate andclimate changes studiesThe 4 th IPCC report published in 2007 ma<strong>de</strong> medias and governmentsaware of the large scale climate changes already observed,or which should happen by the end of this century. Meteo-<strong>France</strong>scientists remained very active in this area, and worked mainly onregional climate forecast, extreme events, links between tropicaland extra- tropical climate and much more…Development of CNRM’scoupled global climatemo<strong>de</strong>lThe IPCC fourth assessment report (2007) wasbased on global climate simulations performedby about 20 research institutes. CNRMwas able to participate to this project by usingCNRM-CM global coupled mo<strong>de</strong>l. This mo<strong>de</strong>lconsists of Arpège-Climat AGCM, OPA OGCM,Gelato sea ice mo<strong>de</strong>l and Trip river routingmo<strong>de</strong>l.This complex coupled system is constantlyimproved and tested. In 2007, the 1860-2000period was simulated with an updated versionof CNRM-CM, in which ocean-atmosphere heatexchanges were better represented. More over,the effect of atmospheric sulphate particles onclimate was consi<strong>de</strong>red in a more realistic way.In contrast with greenhouse gases, these particlestend to cause a cooling of the ocean andland surface, which can be particularly strongon the regional scale. Other simulations for thesame period were run, in which land usechanges were taken into account. Morerecently, the impact of volcanic eruptions wasintroduced in Arpège-Climat un<strong>de</strong>r the form ofparticles in the lower stratosphere, allowing tosimulate the Pinatubo event (1991) more realistically.This improved version of CNRM-CM was adaptedto run on Météo-<strong>France</strong>’s new supercomputer,and will allow to perform severalIPCC-like climate simulations within ENSEM-BLES European project by early 2008. Then,CNRM-CM will experience <strong>de</strong>ep changes until2009, in or<strong>de</strong>r to account for the most recentupdates of its different components.New couplings will be introduced with the carboncycle, ice sheets and atmospheric chemistry,in or<strong>de</strong>r to obtain an even more realisticearth system mo<strong>de</strong>l. This next generationmo<strong>de</strong>l will serve as a tool to contribute to thenext IPCC set of climate simulations. 1Tropical cyclogenesisindices in the IPCC AR4simulationsFuture evolution of tropical cyclonic activity isof major importance for the scientific communitybut its uncertainty is so high that the latestIPCC report could merely state the lack ofconsensus on this topic.For some time now, methods have been <strong>de</strong>velopedin or<strong>de</strong>r to measure the probability oftropical cyclone formation in climate mo<strong>de</strong>ls.One of these mo<strong>de</strong>ls was finalized at CNRMfrom existing indices largely used by the scientificcommunity. The refinement that we introducedin the calculation consisted in gettingrid of the 26 °C sea surface temperature (SST)threshold which accuracy whose relevance forthe actual climate will become questionable inthe future.We calculated our in<strong>de</strong>x for 15 out of the 19 A2scenarios (among the most severe ones) performedin the frame of the IPCC. Mo<strong>de</strong>ls reproducea realistic global distribution of theobserved in<strong>de</strong>x <strong>de</strong>spite some marked biases.When assessing the future climate, answersdiffer greatly from one mo<strong>de</strong>l to another, somuch so that no conclusion can be drawnregarding the sign of the ten<strong>de</strong>ncy. This highspread among the mo<strong>de</strong>ls can also be found inthe spatial structure of the SST anomaly calculatedby the different simulations.Several years will probably be nee<strong>de</strong>d before areliable ten<strong>de</strong>ncy can be <strong>de</strong>duced for the tropicalcyclonic activity. Concerning our work for2008, we will implement a new set of simulationswith the ARPEGE/Climat mo<strong>de</strong>l in whichwe will prescribe the SST anomalies from thedifferent IPCC simulations; the un<strong>de</strong>rlying i<strong>de</strong>abeing to measure the part of these anomaliesin the spread of the responses. 2Tropical influence onextratropical variabilityThe IRCAAM project, fun<strong>de</strong>d by the French<strong>National</strong> Research Agency and coordinated byCNRM, mainly aims at un<strong>de</strong>rstanding if andhow the inter annual and/or intra seasonalmo<strong>de</strong>s of atmospheric tropical variabilitycontrol the extra tropical climate, particularlyover Europe and the Mediterranean basin. Inaddition to statistical analysis, the project isbased on original numerical experiments inwhich the tropical dynamics of the globalArpège-Climat mo<strong>de</strong>l is controlled through a3D nudging towards the ERA40 reanalyses.Though highly i<strong>de</strong>alized, such experiments arenot disconnected with the issue of long-rangedynamical forecasting. The ultimate objectiveis to assess to what extent improved forecastswithin the Tropics (where the persistence ofsea surface temperature - SST - anomalies ismaximum) could also increase skill scores inthe mid-and-high latitu<strong>de</strong>s. The first case studiesachieved for the boreal summer seasonshow encouraging results (see figure).They show that inter annual anomalies in tropicalcirculation are likely to drive planetarywaves that can propagate polewards and thusmodify in a realistic way (i.e. in agreement withatmospheric analyses and observations) theextra tropical circulation simulated by theArpège-Climat mo<strong>de</strong>l. 328 . Research and <strong>de</strong>velopment: annual report 2007
Global mean ocean temperature. HadISST observationsprovi<strong>de</strong>d by UKMO/Hadley <strong>Centre</strong> (black curve).IPCC-AR4 simulation by CNRM-CM3.1 (blue).Simulation by CNRM-CM3.2 (green).Yellow, orange and red: same mo<strong>de</strong>l, but withland use changes and different ocean initial conditions.1Température <strong>de</strong> surface <strong>de</strong> l’océan (°C)19.51918.51817.517Océan global20C3M/Commit20C3M+Aer2OC3M+Aer+L.use 12OC3M+Aer+L.use 22OC3M+Aer+L.use 3Had.C.Data16.51860 1880 1900 1920 1940 1960 1980 2000Années Computation of tropical cycloneformation probability for the ERA40 reanalysis.2 3JJAS 1997-clim V200 (m/s)ERA40No nudging/obs SST R=-0.03ab Observed (a) and simulated (b,c,d) 200 hPameridional wind anomalies averaged between Juneand September 1997. Three ensembles ma<strong>de</strong>of 30 simulations are compared:b) control experiment without nudgingand driven by observed SST,c) experiment nudged within the Tropicsand driven by climatological SST,d) experiment nudged within the Tropicsand driven by observed SST. R is the spatial correlationbetween observed and simulated anomalies northof 30° N. Green contours show the 1971-2000climatology of the 200 hPa zonal wind (differentfor the experiments with and without nudging).Tr nudging/clim SST R=-0.60Tr nudging/obs SST R=-0.71cd-4 -3 -2 -1 1 2 3 429 . Research and <strong>de</strong>velopment: annual report 2007
52010520510555510a Ratio between the numberof summer heat wave days(number of days when temperatureis 5 °C above normal for more than5 consecutive days) for 2021-2050and the corresponding number inthe reference period 1961-1990.Scenarios A1B (a), A2 (b) and B1 (c).bc530°40°50°7 6 5 4 3 2 150°40°30°50°540°40°22552551054350° 0°10° a : map of the warming en °Cb : drying in mm/d for the end of the 21 st century (2070-2099 period versus 1961-1990)in summer (June-July-August)20°30°30°Indices of extreme events over <strong>France</strong> in the latestregional scenarios 2021-2050The IPCC 4 th assessment report has requiredcoupled ocean-atmosphere simulations thathave enabled to produce a third generation ofregional scenarios for <strong>France</strong>. After doublingcarbon dioxi<strong>de</strong> experiments (late 1990 s) andA2 and B2 scenarios of Gicc programme (early2000 s), a new set of three scenarios A1B, A2and B1 has been ma<strong>de</strong> recently available. Forthe first time, these simulations address thequestion of the climate for the first half of the21 st century.For the forthcoming next <strong>de</strong>ca<strong>de</strong>s, the mainconcern is not a mo<strong>de</strong>rate mean warming, butthe evolution of the frequency of extreme phenomena.From the above mentioned threeFollowing the last two IPCC reports (2001,2007), the Mediterranean area has been pointedout as one of the main “hot spots” for a climatechange during the 21 st century. Thevarious global climate mo<strong>de</strong>ls also agree verywell about that area. This leads to robustresults concerning the general warming anddrying of the Mediterranean basin. Thesechanges will be stronger in summer.To obtain high-resolution information aboutthe climate change in this area, the CNRM hasbeen <strong>de</strong>veloping for some years a high-resolutionregional version of the ARPEGE/OPA coupledmo<strong>de</strong>l. This Atmosphere-Ocean RegionalClimate Mo<strong>de</strong>l (AORCM) is the first mo<strong>de</strong>lwhich takes into account the air-sea couplingat high resolution for the Mediterranean area.The two coupled mo<strong>de</strong>ls are ARPEGE and OPAas for the CNRM-CM3 IPCC global mo<strong>de</strong>ls buttheir spatial resolution over the area of interestsimulations at 50 km resolution over <strong>France</strong>, wehave estimated the frequency of summer heatwaves (figure 4), the intensity of heavy rainfalland the duration of dry spells for the period2021-2050. Amidst the spread of mo<strong>de</strong>l responseswhich result from the unpredictableinter-annual variability, three characteristic featuresarise, which were emphasized for the endof 21 st century in Imfrex: increase in heat wavesand droughts, paradoxical increase (sincemean precipitation <strong>de</strong>creases) in intensity forthe events above 20 mm/day.Studies on these data will carry on, in or<strong>de</strong>r toupdate the results about strong winds and surfacehydrology. 4Climate change simulationof the Euro-Mediterranean area using a <strong>de</strong>dicatedatmosphere-ocean regional climate mo<strong>de</strong>lis enhanced to 50 km in the atmosphere andto 10 km in the sea. A 140-year simulation(1960-2099) has been carried out with themo<strong>de</strong>l following the A2 SRES hypothesis forthe 21 st century.A high-resolution <strong>de</strong>scription of the warmingand drying of the Mediterranean and southernEurope area is obtained thanks to the simulation(figure a). This mo<strong>de</strong>l also allows to quantifythe warming, saltening (figure b) and sealevel rise of the Mediterranean Sea. The futureof the Mediterranean regional coupled climatemo<strong>de</strong>ls will take place in the European CIRCEproject with the inter-comparison of 6 differentAORCMs. This will lead to a better assessmentof the climate change uncertainty range for theMediterranean basin.These AORCMs are also seen as key numericaltools in the framework of the future HyMExproject. 5Heavy precipitationMediterranean eventsin a future climate,a preview…The national CYPRIM project, started in2005, provi<strong>de</strong>s a multidisciplinary frameworkaimed at heavy precipitation events(HPE) studies. One objective of CYPRIM is toassess the evolution of the related hazardlinked with the climate change. The worksummarized here is a better i<strong>de</strong>ntification ofthe present climate and the <strong>de</strong>velopment ofan objective automatic <strong>de</strong>tection of suchevents for future climate simulations. It hasbeen achieved through a collaboration between3 CNRM sections within 3 differentgroups.The main task has involved combining rainfalldata from the Météo-<strong>France</strong> network togetherwith a reference data bank of weather fields(ERA40) obtained at ECMWF. A set of 1210significant precipitation events has been collectedand their large-scale environment havethen been constructed using statistical automaticclassification algorithms. This yieldsweather patterns related to the various zonesof the average climatology of rainfall in thearea. A close look at the statistical relationshipreveals that only 2 weather patterns arelinked to HPE. The meteorological ingredientsthat characterize HPE can then be highlighted.They lead to an algorithm that enables to<strong>de</strong>tect favourable conditions that can lead toHPE from the dynamical information alone.The number of cases <strong>de</strong>tected does notchange much between now and the end ofthe century (A2 emission scenario). In thefuture climate composite of HPE, only thewarm moist influx seems to take a more systematicpreferred south westerly orientation(see figure).High resolution simulations of present andfuture climate cases will allow <strong>de</strong>tailed examinationof possible evolutions of the localrainfall amounts or of the HPE structure.630 . Research and <strong>de</strong>velopment: annual report 2007
50°2 1 0,5 0,2-0,2-0,5 -1 -250°2238.840°40°212038.638.430°30°1938.2350° 0°10°20°30°40°50°38181960 1980 2000 2020 2040 2060 2080 2100 Time series of the sea surface temperature (°C, in red) and of the seasurface salinity (psu, in blue) for the whole Mediterranean basin6ERA40 1960-20022.0721.91.81.71.61.51.41.31.21.110.90.80.70.610 m/s1.621.61.51.41.3A/B/7431 mm450.0400.0350.0300.0250.0200.0150.0100.0250.0225.0225.000600.0 24 h accumulated surfacerainfall simulated byMESO-NH (A/) and 500 hPageopotential and moistureflux from the ARPEGEClimate/OPAMED system (B/)for a simulated HPE in thefuture climate.1.2550.0Arpege-Climat Medit. 2070-2099 Heavy precipitation cases field composites, in the present climate from theERA40 reanalysis (top panel) and in the future (A2) climate from the Arpege-Climat Mediterranean SAMM mo<strong>de</strong>l (bottom). Fields are the geopotential heightat 500 mbar (brown contours), the wind at 925 mbar stronger than 5 ms -1(blue arrows), and the moisture flux magnitu<strong>de</strong> at 925 mbar (sha<strong>de</strong>d areas).1.110.90.80.70.6500.0450.0400.0350.0300.0250.0200.0150.0100.0150.00Climate downscaling with Meso-NH for heavy precipitation eventsThe evolution of the frequency and intensityof heavy precipitation events is still an openquestion and cannot be simply assessedthrough a direct use of climate mo<strong>de</strong>l outputs.To address this question, downscalingapproaches are currently <strong>de</strong>signed. As forinstance, within the framework of theCYPRIM project, an hybrid downscaling (orstatistico-dynamical downscaling) methodis used to address whether frequency orintensity of Mediterranean Heavy PrecipitationEvents (HPEs) might change in afuture climate.This statistico-dynamical downscaling isbased on a two-step method: i) firstly, somecases are selected from an ensemble of environmentspropitious to HPEs for the actual climate(1960-2000) and for the future one(2070-2099) as simulated by the climate scenariosand ii) secondly, the cases are simulatedwith a fine scale non-hydrostatic mo<strong>de</strong>lwhich is particularly well suitable for thesimulation of processes leading to the formationof heavy precipitation events. The statisticalmethod that i<strong>de</strong>ntifies propitiousenvironment is based on a clustering of the500 hPa geopotential field combined withcriteria on the low-level moisture flow. It hasbeen applied to the ARPEGE Climate/OPAMED outputs to i<strong>de</strong>ntify twenty casesequally partitioned between the present andfuture climate. Then, these cases are simulatedwith the MESO-NH mo<strong>de</strong>l at 2.5 km forthe finest domain and using as initial andboundary conditions the ARPEGE Climate/OPAMED outputs.31 . Research and <strong>de</strong>velopment: annual report 2007For each of the 20 cases, MESO-NH producesheavy precipitating systems with 24 h accumulatedprecipitation above 100 mm andreaching in some cases more than 400 m.These results confirm that the statisticalselection is relevant to i<strong>de</strong>ntify propitiousenvironment for heavy precipitation and thatthe dynamical downscaling is able to reproduceprecipitating systems typical ofMediterranean heavy precipitation events.Results about the evolution of heavy precipitationevents and their environment are beingfinalized, given close attention to the evolutionof key ingredients for the <strong>de</strong>velopmentof heavy precipitation events such as moistureflux, precipitable water, low-level jet andthe available convective instability. 7
Atmosphereand environmentstudiesIn 2007, several <strong>de</strong>velopments were carried out concerninghydrometeorology, oceanography, nivology, reduced visibility ormo<strong>de</strong>lisation of atmospheric chemistry... Some notable progresswere ma<strong>de</strong> on discharge forecasts thanks to SIM improvements,on fog un<strong>de</strong>rstanding, … Moreover, air quality ensemble forecastand <strong>de</strong>sert dusts forecasts were two major innovations of the last12 months.Hydro-meteorologySea-air coupled processesduring heavy precipitating eventsFor the strongly precipitating events that frequentlyoccur over the Mediterranean basinduring the autumn, the Mediterranean Seais an important source of heat and moisture.The sea can also sometimes contribute toamplify the flood due to the sea-level riseand the generation of a strong swell, generatedby the strong winds that accompany theheavy rainfall.To study the impact on the oceanic mixedlayer of heavy precipitation and strong seawinds observed in these situations, as wellas the feedbacks on the atmosphericevents, a full 2-way ocean-atmosphere cou-pling has been <strong>de</strong>signed between theatmospheric mo<strong>de</strong>l MESO-NH, through itssurface scheme SURFEX, and an oceanic 1Dmo<strong>de</strong>l (Gaspar et al.,1990). Applied to threeheavy precipitation events (Au<strong>de</strong> 12-13November 1999, Gard 8-9 September 2002and Hérault 3 December 2003) at a 2.4 kmhorizontal resolution, the coupled systemreproduces fine scale oceanic responses. Asignificant <strong>de</strong>epening and cooling of theoceanic mixed layer are thus found un<strong>de</strong>rthe strong winds associated with the precipitatingsystems. An impact of the precipitationis also shown through a <strong>de</strong>crease of thesalinity induced by fresh water inputs andthe building-up of inner mixed layers relativelylittle salted. Compared with a simpleone-way forcing, the 2-way interactive couplingtends to mo<strong>de</strong>rate the two boundarylayers responses, without modifying thehigh-resolution and short range forecast ofheavy precipitating events.This study constitutes a first step in finescaleair-sea coupled mo<strong>de</strong>lling and producesoutcomes for a future campaign fieldon the hydrological cycle of the Mediterranean(HyMeX). 1Improvement of the hydrological transfersin the surface mo<strong>de</strong>l ISBAA good representation of hydrological transfersis necessary for a good simulation ofrunoff and water transfers to the rivers. Oneoption, amongst others, to improve the ISBAsurface scheme consists in introducing adiminution of the saturated hydrologicalconductivity with <strong>de</strong>pth. This parametergoverns the speed of the water transfers inthe soil, its diminution being linked to thecompactation of the soil with <strong>de</strong>pth.After some very encouraging applications atthe scale of the Rhône basin and at globalscale, this modification has been tested inthe application SAFRAN-ISBA-MODCOU atthe French scale. After several one-dimensionaltests, the calibration of correspondingparameters has been <strong>de</strong>fined. Usingthe observed discharge observations atsome 200 stations, the parameters werecalibrated to reproduce as faithfully as possiblethe observed discharge.The validation showed that the improvementwas significant over most stations(increase of the Nash criterion). The impacton the root reservoir wetness is almost neutral,while the humidity of the sub-root reservoiris increased, allowing a betterrepresentation of floods and low flows. Thisnew calibration improves the overall qualityof the SAFRAN-ISBA-MODCOU runs. It will beused either in the framework of dischargeforecast or on impact studies of climatechange. 232 . Research and <strong>de</strong>velopment: annual report 2007
FsolAtmosphèreSolFirSurfex (schèma <strong>de</strong> surface)ConvectionPMélangeverticalSSTColonnesd'eau<strong>de</strong> merVentτu, τvHModèle Méso-NH(Lafore et al, 1998)LE = ζ x EModèle océanique 1D(Gaspar et al, 1990)Océan The principles of the MESO-NH(SURFEX) / 1D oceanic mo<strong>de</strong>l coupling:the variables exchanged at the air-seainterface are the radiation fluxes (Fsoland Fir), the turbulent fluxes (τ, H, LE)and the precipitation rate (P).Bathymètrie1108Obs.AvantAprèsLa Garonne à Lamagistère(2002-2003)mm/d6Improvement of the dischargeof the Garonne at Lamagistère(Haute-Garonne) duringthe winter 2002/2003.4202Novembre Janvier MarsDate33 . Research and <strong>de</strong>velopment: annual report 2007
Extension of the reanalysisof the hydrometeorological system SIMThe hydrometeorological system SIM(Safran-Isba-Modcou), used operationally atMétéo-<strong>France</strong> since 2004, permits a continuousand real-time monitoring of soil waterresources over <strong>France</strong>.In or<strong>de</strong>r to <strong>de</strong>tect anomalies concerningwater resources availability and to allow abetter qualification of a specific hydrologicalseason, the reanalysis of the mo<strong>de</strong>l is dailyused as reference. In 2007, the reanalysis ofthe SIM mo<strong>de</strong>l has been exten<strong>de</strong>d over thewhole 1970-2006 period using ERA40(1957-2001) atmospheric reanalysis ofECMWF and observations from the Météo-<strong>France</strong> climatologic network.The extension of the temporal period coveredby the reanalysis will be continued in2008. This work will permit to obtain a climatologyof the mo<strong>de</strong>l covering the years1958-2008 with an innovative dataset of 50years of soil water resources at a 8 km spatialresolution all over <strong>France</strong>.This reanalysis will be important for futurestudies, especially for assessing the impactof climatic changes on the hydrologicalresources. 3Ensemble stream-flow predictionsusing the SAFRAN-ISBA-MODCOU chainThe hydrometeorological suite SAFRAN-ISBA-MODCOU (SIM) simulates the distributedsurface hydrologic budget and theassociated streamflows for the whole metropolitan<strong>France</strong>. SAFRAN is a meteorologicalanalysis system, ISBA is a land surfacemo<strong>de</strong>l, MODCOU a hydrological mo<strong>de</strong>l(<strong>de</strong>veloped by the Ecole nationale supérieure<strong>de</strong>s Mines of Paris) which simulatesthe flows over 800 French rivers places.The availability of this chain allowed newresearch on daily streamflow prediction, basedon the ensemble prediction system of ECMWF.For that, precipitation forecasts are disaggregatedat the scale of <strong>France</strong> (to take into accountorography and forecast biases). The ISBA-MODCOU mo<strong>de</strong>l runs for each member of theensemble forecast. The performances of theensemble streamflow forecast were testedover a period of more than one year.Performances are satisfactory, <strong>de</strong>spite a lackof spread at short time scale, especially forprecipitation. The ensemble streamflowforecast will allow to improve the forecastterm and the pre alert for the operationalservices. A test using the short term ensembleforecast from the ARPEGE mo<strong>de</strong>l showedan improvement for short term forecasts,especially for small basins.In the future, tests of the system will becontinued. The emphasis will be put on theimprovement of the mo<strong>de</strong>l initial state,using an assimilation of the observed discharge.4Soil moisturemonitoring: mo<strong>de</strong>llingversus satellite and insitu observationsSurface soil moisture can be estimated byusing microwave remote sensing data. Thisquantity is simulated by land surfacemo<strong>de</strong>ls. Automatic probes allow the continuousmonitoring of soil moisture profiles,in situ. To compare soil moisture estimatesgiven by various techniques improves theun<strong>de</strong>rstanding and the mo<strong>de</strong>lling of biophysicalprocesses.The satellite mission SMOS (L band radiometer)will provi<strong>de</strong> surface soil moistureestimates from space with a sampling timeof 2-3 days and a spatial resolution of 20 to60 km. A number of existing soil moistureproducts <strong>de</strong>rived from satellite observationshave the potential to be used in synergywith SMOS. The C band wind scatterometerdata (ERS-Scat, ASCAT onboard METOP) orthe C and X band passive microwave data(AMSR-E onboard Aqua), already provi<strong>de</strong>surface soil moisture estimates, at a similarspatial resolution. ASCAT onboard METOP(an operational instrument) will enableEUMETSAT to issue global soil moisture productsat a similar sampling frequency asSMOS. In situ soil moisture observations areavailable for south-western <strong>France</strong> : SMOS-MANIA (2007-2013) is a network of 12RADOME weather stations equiped to measuresoil moisture and temperature profiles(-5, -10, -20, -30 cm).The comparison of in situ data with simulations(SIM) and the available remote sensingproducts (see figure) permits to crossvalidatethe satellite products with themo<strong>de</strong>l and to verify the representativenessof in situ data. 534 . Research and <strong>de</strong>velopment: annual report 2007
31.2Indice d'humidité du sol1.00.80.60.40.20.0Indice moyen <strong>France</strong>MoyenneQuintiles 20 et 80 %Mini - max (1970-2005)2003J F M A M J J2003A S O N DMean soil water in<strong>de</strong>x (SWI)over <strong>France</strong> for the year 2003and comparison with statisticson the 1970-2005 periodSIM vs. AMSR (VUA)4° W 2° W 0° 2° E 4° E 6° E 8° E550° N4m 3 /s2 0001 5001 000Daily streamflow at "la Seine à Paris (pont d'Austerlitz)"Débit opérationnelObservationsQ90 climMédiane climQ10 clim48° N46° N44° N500SIM vs. ERS4° W 2° W 0° 2° E 4° E 6° E 8° E05 12 19 26 2 9March 2001April Ensemble streamflow predictionfor the 2001 flood in Paris.Observations: black,simulation with SAFRAN analysis: red,ensemble prediction: dashed lines,green: climatological thresholds50° N48° N46° N44° NCorrelation maps between the surface soilmoisture simulated by SIM over <strong>France</strong>and 3 satellite products, for the 2003-2005period.From top to bottom: AMSR-E (AmsterdamUniversity), ERS-Scat (Vienna University),AMSR-E (NASA, version 3-B03).SIM vs. AMSR (NSIDC)4° W 2° W 0° 2° E 4° E 6° E 8° E50° N48° N46° N44° N-1 -0.3 -0.6 -0.4 -0.2 0 0.2 0.4 0.6 0.8 135 . Research and <strong>de</strong>velopment: annual report 2007
Oceanography(mo<strong>de</strong>lling and instrumentation)Sea surface salinitymeasurementThe <strong>Centre</strong> <strong>de</strong> Meteorologie Marine (CMM)will take part in the validation and calibrationof ESA SMOS satellite (Soil Moisture OceanSalinity) which will be launched in 2009.The GLOSCAL (Global Ocean SalinityCalibration and Validation) project aims tostudy the Sea Surface Salinity data (SMOSdata, AQUARIUS data, in situ data) in collaborationwith the national and internationalscientific community. The Sea Surface Salinityis important for a better un<strong>de</strong>rstanding of theclimate.For this purpose, drifting buoys fitted withconductivity sensors were <strong>de</strong>ployed off theAmazon river in the framework of PLUMANDand AMANDES campaigns, and in Biscay Bayfor CAROLS experiment. The <strong>de</strong>ployment ofbuoys off the Amazon river had two aims: ascientific one (to analyse the salinity variabilityin surface <strong>de</strong>-salted waters) and an instrumentalone (validation in tropical oceans).The aim is to have about thirty buoys to beready to be <strong>de</strong>ployed when SMOS will belaunched. 6E-Surfmar:European surface marineobservation programmeSince 2003, the surface marine meteorologicalobservation has been organized in Europein the framework of Eucos, a compositeobservation programme of Eumetnet. Météo-<strong>France</strong> ensures the lea<strong>de</strong>rship ofE-Surfmar, a programme which gathers observationsfrom VOS (Volunteer ObservingShips) recruited by EMS as well as from driftingand moored buoys. The programme issteered by two advisory groups: one for shipsand one for buoys. In 2007, its budget wasabout 820 k€.Whereas the number of observations carriedout by conventional ships are ever and ever<strong>de</strong>creasing, those collected by automatedstations installed aboard European shipshave doubled over the past 5 years. On average,observations have increased from 300to 700 a day in the North Atlantic and in theMediterranean Sea.By the end of 2007, about 100 drifting buoys,fun<strong>de</strong>d by the programme, reported morethan 2200 observations of air pressure andsea surface temperature per day, a levelnever reached before.E-Surfmar is mainly concerned with the automationof the observation, the <strong>de</strong>crease ofproduction cost, the improvement of its qualityand the reduction of transmission <strong>de</strong>lays.In 2007 the Iridium satellite system showedits potentialities compared to Argos in reportingdrifting buoys data ashore. The <strong>de</strong>cisionto progressively extend this communicationsystem to all the drifting buoys was thereforetaken. 7Participationin the InternationalPolar Year (IPY)Meteo <strong>France</strong> contributes to the InternationalPolar Year (IPY 2007-2009) through theE-SURFMAR programme.E-SURFMAR fun<strong>de</strong>d some buoys which were<strong>de</strong>ployed in the framework of the InternationalArctic Buoy Program (IABP), a regionalaction group of the DBCP (Data BuoyCooperation Panel). Two buoys were air<strong>de</strong>ployed during the Summer 2006. Sevencheaper ones were put on the sea ice duringthe Summer 2007 by the German researchvessel POLARSTERN. By December 2007,eight out the nine buoys were correctly working,transmitting their hourly data througheither the Argos system satellite or theIridium one.The main objective is to take advantage ofthis campaign to contribute to the <strong>de</strong>nsificationof the air pressure measurement networkin this area and to quantify its impactthrough further studies.In September 2006, the sailing-ship TARA V(ex-ANTARCTICA) which began a two-yeardrift in the sea ice of the Arctic Ocean sinceSeptember 2006, was also equipped with anautomatic weather station. 9Use of Iridium for transmission of surface marine dataThe tests realized in 2007 to use Iridiumsatellite system to transmit drifting buoysdata were successful. The system is reliable,quick and cheap. By the end of 2007, about20 SVP-B drifting buoys fitted with a SBD(Short Burst Data) transmitter were in operationin various ocean: Arctic Ocean, NorthAtlantic Ocean, Black Sea, South AtlanticOcean, and Indian Ocean. Every hour, thedata are received at CNRM/CMM in Brest,co<strong>de</strong>d in FM18-BUOY messages and sentonto the GTS within less than 10 minutes.Forty-five Iridium buoys, fun<strong>de</strong>d by the E-SURFMAR programme, have been purchased.Next year, they will be <strong>de</strong>ployed at seatogether with Argos buoys. Future or<strong>de</strong>rs forthe E-SURFMAR network should be Iridiumbuoys only.In 2007, CMM also <strong>de</strong>veloped a minimalship borne Automatic Weather Station (AWS)to meet E-SURFMAR requirements i.e. measuringthe atmospheric pressure at least.This AWS, so called Baros, is fitted with abarometer, a GPS and a SBD Iridium beacon.This prototype was put on board the Frenchtrawler Jericho. It has been working perfectlysince the beginning of November 2007. Datahave been sent in real time onto the GTS inFM13-SHIP messages. Four more stations<strong>de</strong>voted to E-ASAP ships not yet equippedwith an AWS, are being produced. 836 . Research and <strong>de</strong>velopment: annual report 2007
6 Salinity buoys: drifting buoysfitted with conductivity sensors7Drifting buoys (measuringatmospheric pressure)trajectories in the Eucosarea in November 2007 Buoy on the sea iceBuoys trajectories in November2007 (in red E-SURFMAR buoys)9 Iridium buoy at sea.8 DBCP Iridium Pilot Project Map(Status 19 December 2007)37 . Research and <strong>de</strong>velopment: annual report 2007
The moored buoys10The open ocean buoys Brittany (moored by2 100 meters <strong>de</strong>pth) and Gascogne (mooredby 4 500 metres <strong>de</strong>pth) are maintained incooperation with the United Kingdom MetOffice.In addition, Météo-<strong>France</strong> is operating openocean moored buoys in four other places: twooff the French West Indies by 5 500 metres<strong>de</strong>pth and two others in the MediterraneanSea by 2 300 metres <strong>de</strong>pth. The buoys weigh3.7 tonnes, and measure 2.8 metres in diameterand 6 metres overall height. The hourlyobservations are transmitted in real time viathe METEOSAT satellites. 10From MERSEA to My Ocean : towards an integratedEuropean system for operational oceanographyThe aim of the European MERSEA Project(2004-2008), fun<strong>de</strong>d by the EuropeanCommission and coordinated by IFREMER, isto <strong>de</strong>velop and to <strong>de</strong>monstrate, in pre-operationalconditions, an integrated Europeansystem for operational oceanography, in responseto the GMES requirements. This systemis composed of analysis and forecastcentres for the global ocean (un<strong>de</strong>r MercatorOcean’s responsibility) and for regional seas(Mediterranean Sea, North-Eastern Atlantic,North and Baltic Seas, Arctic Ocean), as wellas satellite and in-situ data centres providingthe necessary observations.Météo-<strong>France</strong> contributes to MERSEA throughresearch activities performed at CNRM aboutatmospheric forcing fields and the impact ofhigh resolution global ocean analyses on seasonalprediction, <strong>de</strong>monstration activities performedin the Marine Forecast andIn classical atmospheric circulation mo<strong>de</strong>ls,the estimation of air-sea turbulent fluxes(wind stress, sensible and latent heatfluxes) relies on the use of « bulk » formulationstogether with air-sea parameters an<strong>de</strong>xchange coefficients for wind, temperatureand humidity.In 2007, a new parameterisation of the neutralexchange coefficients named ECUME(Exchange Coefficients from Unified MulticampaignsEstimates) was set up using theALBATROS dataset (http://dataserv.cetp.ipsl.fr/FLUX/) which gathers all the measurementscollected during several cruisesover the past ten years, in close collaborationbetween CNRM and IPSL. This parameterisationis particularly consistent as itprovi<strong>de</strong>s an analytical formulation for all theexchange coefficients (for wind, tempera-Oceanography Division about the use of surfacecurrent forecasts for sea state and oil driftprediction, and <strong>de</strong>velopment and productionactivities performed at CMS about sea surfacetemperature satellite observations.In 2007, the CNRM has <strong>de</strong>monstrated anddocumented the positive impact of newly<strong>de</strong>veloped turbulent fluxes parameterisationson the global ocean circulation simulation.At CMS, the processing of new satellitemulti-sensor sea surface temperature products,covering the Atlantic Ocean, has beenimplemented, and they are now ma<strong>de</strong> availableto MERSEA users.In 2008, the transition from MERSEA to MyOcean (2008-2011) will take place. This newproject, fun<strong>de</strong>d by the European Commission,will transfer into operational exploitationthe system <strong>de</strong>veloped in the frameworkof MERSEA. 11ECUME: a new parameterisationfor air-sea turbulent fluxesture and humidity) <strong>de</strong>rived from turbulentfluxes estimates using simultaneous measurementstogether with homogeneousmethods, while covering the wi<strong>de</strong>st range ofwind and of atmospheric stratificationconditions.A first evaluation of this parameterisationwas carried out in the MERSEA IntegratedProject framework using the global oceanmo<strong>de</strong>l OPA, <strong>de</strong>veloped at LOCEAN. Thisparameterisation is now being evaluated inatmospheric mo<strong>de</strong>ls ranging from theARPEGE-Climat mo<strong>de</strong>l to the meso-scaleAROME and Meso-NH mo<strong>de</strong>ls. Two recentstudies have in<strong>de</strong>ed <strong>de</strong>monstrated thebenefit of using this parameterisation in theMeso-NH mo<strong>de</strong>l for the simulation of boththe intense Mediterranean rainfall eventsand of hurricanes. 12Replacementof a buoy inMediterraneanSea in February2007.Laboratory experimentson Internal ti<strong>de</strong>Internal gravity waves in oceans, as well asin the atmosphere, interact with large-scaleprocesses. In the ocean, the counterpart ofthe drag force for mountain waves is theamount of energy extracted from the barotropicti<strong>de</strong> due to the formation of the internalti<strong>de</strong>. This conversion rate is an essentialinformation if the role of the internal ti<strong>de</strong> inmixing the abyssal water masses is to beun<strong>de</strong>rstood.Rough estimates of this conversion rate areavailable, based on satellite data (Munk andWunsch, 1998). These data also reveal thatthe energy conversion mostly occurs at topographicfeatures, but many questions relativeto internal ti<strong>de</strong>s generation,propagation and dissipation remain to besolved.In this context, laboratory experiments onthe generation of internal tidal over a seamountare performed. The tidal problem ismapped to an oscillating ridge in a staticfluid. The Schlieren synthetic technique andthe Particle Image Velocimetry techniqueprovi<strong>de</strong> measurements of the <strong>de</strong>nsity andvelocity fields induced by the waves.The toolbox integrated into the numericalmo<strong>de</strong>l Symphonie <strong>de</strong>veloped by theLaboratoire d'Aérologie in or<strong>de</strong>r to analyseinternal ti<strong>de</strong>s energetic transfers must nowbe validated. These studies will improve ourun<strong>de</strong>rstanding of the thermohaline circulation,which works on a temporal scale of athousand years. Therefore, they also contributeto climate research.1338 . Research and <strong>de</strong>velopment: annual report 2007
12 Multi-sensor sea surface temperature field obtained on 1 st December 2007,combining infra-red and microwave observations from geostationary and polarorbiting satellites.111314 Neutral exchange coefficients for the wind (Cdn), temperature (Chn),and humidity (Cen) issued from the ECUME parameterisation (red line),as a function of the wind gradient between the sea surface and 10 mheight. Each dot represents a value provi<strong>de</strong>d by the ALBATROS dataset.Several (among the most commonly used) bulk parameterisations arealso drawn. Density fieldinduced byinternal ti<strong>de</strong>beams72 hours drift observed with a buoy (black) and simulated by Mothy with only the wind forcing (brown) or when the currentsof a monthly climatology are ad<strong>de</strong>d (green), or the MFS analysis (red), or the Mercator-Ocean PSY2V2 analysis (blue).On the left : drift started on the 13 th October 2007 and we note a good agreement with the Mothy drift using the climatology whereasthe oceanic systems reproduce badly the liguro-provencal current.On the right : the drift start on the 16 th November 2007 near the Balearics Isles and the Mercator currents are here the most accurate.Observed and forecasted oil spill driftinter-comparison in the Mediterranean SeaIn the framework of its national and internationalduties, Météo-<strong>France</strong> operates theMothy drift mo<strong>de</strong>l. It is composed of a 2Docean mo<strong>de</strong>l (computation of currents due towind and ti<strong>de</strong>s) and of a mo<strong>de</strong>l simulatingthe behaviour in the ocean of oil spills (orobject).However, in some cases, the low frequencyoceanic circulation can become the main instigatorof the drift. One Météo-<strong>France</strong> of theparticipations to the European project MER-SEA (Marine Environment and Security for theEuropean Area) consisted precisely in theassessment of this contribution.Thus, an experiment in the MediterraneanSea has been organized during the autumn2007 with French (Cedre, Ifremer), Norwegian(Met.No) and Cypriot (UCY) services in or<strong>de</strong>rto <strong>de</strong>ploy buoys emulating a surface oil spill :3 near Cyprus and 8 off Toulon in the SouthEast of <strong>France</strong>. The experiment lasted formore than 3 weeks and allowed to collectprecious data on oil spill drift in a sea wherethe drift forecast systems have not often been39 . Research and <strong>de</strong>velopment: annual report 2007validated while its dynamic is very complex(variable currents associated with smallti<strong>de</strong>s). The Norwegian (OD3D), the Cypriot(MedSlik) and the French (Mothy) drift systemswill be inter-compared and the differentoceanic operational systems will be tested(Mercator (<strong>France</strong>), MFS (Italy) and CYCOFOS(Cyprus)).Studies with these data started in Novemberand will continue once the Mersea project isover, to improve the existing systems.14
15 Instrumentation for humidity and temperature measurementsinstalled on Toulouse Météopole during the Toulouse-Fog campaign.This <strong>de</strong>vice allowed measurements at 0.5, 1, 2, 5 et 10 m height.Atmospheric environmentField experiments <strong>de</strong>dicated to fog:from Paris-Fog to Toulouse-FogRisk maps of mistand fog: “CARIBOU”The short-term forecasting of fog is a difficultissue which has a large societal impact. Forexample, adverse visibility conditions are aproblem for the security of air transportationor traffic.CNRM-GAME has ma<strong>de</strong> significant efforts toimprove the knowledge of the mechanismsinvolved in the life cycle of fog. Research isgoing on to improve fog forecasting bynumerical mo<strong>de</strong>ls, and particularly, whatinfluence have both surface heterogeneitiesand aerosol on fog.The PArisFOG experiment has been performedduring the 2006-2007 winter season toobserve simultaneously all these processes.The project is based on an experimentalsetup that gathers instruments from differentresearch laboratories (IPSL, CEREA andCNRM). Instruments have been <strong>de</strong>ployed atSIRTA from November 2006 to April 2007.Data from the PArisFOG field experimenthave been validated and are available onthe web server http://parisfog.sirta.fr/ .Unfortunately, technical problems ma<strong>de</strong> itimpossible to collect enough observationsof microphysical parameters during Paris-Fog. However, it is necessary to improve ourknowledge on the microphysical propertiesof fog, in or<strong>de</strong>r to <strong>de</strong>fine, for example, newintegrated system for road traffic. A newfield experiment, called Toulouse-Fog, hasbeen <strong>de</strong>ci<strong>de</strong>d for the 2007-2008 winter season.Toulouse-Fog mainly focussed onmicrophysical parameters on fog layers.These data will allow to investigate thedynamical, microphysical and radiativeevents which contribute to the formationand dissipation of fog. Improved physicalparameterizations validated against datafrom Paris-Fog and Toulouse-Fog will also be<strong>de</strong>fined and inclu<strong>de</strong>d in future numericalweather prediction mo<strong>de</strong>ls. 15Fog ensemble prediction systemOver main international airports, air traffic isvery <strong>de</strong>nse. Consequently, low visibilityconditions, occurring with fog and lowclouds, strongly influence the airport managementand safety. The economic issuesrelated to the reduction of visibility overthese airports are huge for the civilian andcommercial aviation tra<strong>de</strong>s.A Local Ensemble Prediction System (LEPS)has been <strong>de</strong>signed for the prediction of lowvisibility events at Paris-Roissy Charles <strong>de</strong>Gaulle airport to optimise airport managementand flight scheduling. The ensembleprediction system has been built around thenumerical prediction mo<strong>de</strong>l COBEL-ISBA. Thislocal single column mo<strong>de</strong>l, <strong>de</strong>veloped for theprediction of fog, is operational at Roissy airportsince 2005. LEPS is an original systemwhich provi<strong>de</strong>s confi<strong>de</strong>nce in<strong>de</strong>xes for localfog forecasts. These probabilistic forecastsplace the user at the centre of the <strong>de</strong>cisionmaking process. As a consequence, userscan use the LEPS forecasts to minimise hisoperating losses related to fog occurrences.In conclusion, LEPS is a reliable predictionsystem for forecasting low visibility events atCharles <strong>de</strong> Gaulle airport. Moreover, the systemis portable and can be installed at anyother airports. The system is an efficienttool and a valuable help for both managementand safety for the civil aviation in theaeronautic area. 16Since the end of June 2007, risk maps ofmist and fog are produced in an operationalway at Météo-<strong>France</strong>. These maps show anestimation of the risk of occurrence of thesephenomena, elaborated by merging satelliteobservations (MSG cloud type images, bySAF-NWC), surface analyses (DIAGPACK analyses)and radar data (radar quantitativeprecipitation estimation PANTHERE).The cloud type images, produced by CMSfrom the geostationary satellite MSG data,supply a spatialized information about thepresence of low clouds, in case of no cloudylayers at higher levels, obviously.The DIAGPACK surface analyses, elaborate<strong>de</strong>very hour by optimal interpolation usingALADIN fields as guess and all availableground observations, aim at fitting at bestthe latter ones and so supply fields closer tothe observations.The 2 m relative humidity and 10 m windfields stemmed from these analyses, inassociation with the PANTHERE radar quantitativeprecipitation estimation, allow to discriminate,within the cloud type image,between “low clouds” being in contact ornot with the ground. So, the risk of occurrenceof mist and fog, that is visibility globallylower than 5000 m, is estimated allover the French metropolitan territory, with a3 km spatial resolution and a one-hour timestep.Currently, the main limit of the product is alack of quantification of the fall in visibilityencountered within risk areas. A study is inprogress in or<strong>de</strong>r to associate a class of visibilitywith the notion of risk. 1740 . Research and <strong>de</strong>velopment: annual report 2007
17Forecast exampleForecast hoursObservations on the airpor tConfi<strong>de</strong>nce in<strong>de</strong>xProbability6h 8h 10h 12h 14h 16h 18hCertainP>90%FogLikely50=
Atmospheric chemistry and air qualityTaking into account uncertaintiesin mesoscale dispersion mo<strong>de</strong>llingPonctual source atmospheric dispersionmo<strong>de</strong>lling is based on three main components:the meteorological parameters (wind,vertical stability…), the representation of theemission source, and the numerical representationand parameterization of transportand of the possible physical, chemical orradiological processes involved. Each ofthese components has its own uncertainties,and it is an objective to better take them intoaccount when estimating the impact of anacci<strong>de</strong>ntal pollution release.Simulations were performed with the Perlesystem, used at Météo-<strong>France</strong> in operationsfor mo<strong>de</strong>lling the dispersion of pollutants atshort distance, in or<strong>de</strong>r to illustrate the uncertaintiesconnected with the meteorologicalforcings and with the representation of theemission source. In the first case, the ensembleweather prediction based on the Arpègemo<strong>de</strong>l has been used as input to Perle; thisDesert dusts are atmospheric particles withsizes ranging between 1 and 10 micrometers,produced by wind erosion in arid andsemi-arid areas. As everyone has alreadyexperienced, this aerosol can be transportedover thousands of kilometres, beforebeing <strong>de</strong>posited again. In addition to stronghealth and air quality impacts, <strong>de</strong>sert dustsaffect several sectors: operations of thearmed forces, visibility, as well as, for instance,satellite imagery…Forecasts of dust concentrations and <strong>de</strong>positionfluxes are thus much nee<strong>de</strong>d in or<strong>de</strong>rto anticipate major events and take welladaptedprecautions. Research activities atMeteo-<strong>France</strong> in collaboration with LISAhave allowed to set up an operational dustforecast service. Since November 2007,daily dust forecasts are provi<strong>de</strong>d for up tofour days in advance. The 3D chemistry andOperational forecastsof <strong>de</strong>sert dustsprediction ensemble provi<strong>de</strong>s 11 meteorologicalscenarios obtained from slightly differentinitial conditions. The variability of thesimulations of dispersion reveals a very highsensitivity of the results to weather conditionsin certain types of weather. It was alsoshown that perturbations to the specificationof the source term led to very different evolutionsof the pollutant plume, and therefore tomarkedly different potential consequences.This is a concern, as these characteristics aregenerally not precisely known in the event ofa real acci<strong>de</strong>nt.A prototype has been implemented on PCcluster and on the super-computer of Meteo-<strong>France</strong>. It already allows to appreciate, inpost-acci<strong>de</strong>ntal mo<strong>de</strong>, the variability of dispersionscenarios provi<strong>de</strong>d by Perle usingensemble weather prediction or whenmaking alternative assumptions on the characteristicsof release source. 19transport mo<strong>de</strong>l Mocage is used for thisapplication and it takes into account dustsemissions from the two major worldwi<strong>de</strong>sources: the Sahara <strong>de</strong>sert and Saudi Arabiaon the one hand, China on the other hand.Dusts are transported and <strong>de</strong>posited bywinds and rain forecasted by Météo-<strong>France</strong>operational meteorological suites, Arpegeand Aladin.After a <strong>de</strong>tailed validation activity and severalmonths of testing in near-real time, theoperational dust configuration of Mocageallows to provi<strong>de</strong> a reliable and robust forecastservice to users. In particular, all theFrench air quality regional networks getMétéo-<strong>France</strong> dusts forecasts nee<strong>de</strong>d tointerpret observed peaks of PM10, fromthe national air quality platform Prév'Air(http://www.prevair.org/) of the French Ministryof Environment. 20Towards the useof "backtracking" toolsfor operational crisismanagementDuring a crisis management, in particular ofthe nuclear kind , it is of prime interest to beable to <strong>de</strong>termine the origin in space and intime of an atmospheric pollution, which hasbeen <strong>de</strong>tected at one or several locations ofa measurements network. If the question"where is the air mass coming from?" can beanswered rapidly with lagrangian trajectories,it is only in recent years that moresophisticated "backtracking" tools haveemerged. These tools correspond to theintegration backwards in time of 3D dispersionmo<strong>de</strong>ls, providing “retro-plumes”. Themethods used share theoretical conceptswith meteorological data assimilation;“backtracking” can be used for instance to<strong>de</strong>termine the 3D "field of view" of a givensite, at any given time in the past. TheCTBTO, in charge of monitoring the treatybanning nuclear tests, has recently askedWMO to add to its missions the operationalsupport in “backtracking”.Météo-<strong>France</strong>’s CNP is one of WMO’s eightRSMCs worldwi<strong>de</strong>. In 2007, CNP has beeninvolved in an exercise in support to CTBTO.During one week, retro-plumes were calculatedon alert and provi<strong>de</strong>d in near-real-timeto the CTBTO in Vienna. The CTBTO was responsiblefor cross-checking the results fromthe different RSMCs, and for <strong>de</strong>termining thelikely characteristics of the fictitious source(s).Within Météo-<strong>France</strong>, calculationswere ma<strong>de</strong> with the "reverse" configurationof the chemistry-transport mo<strong>de</strong>l Mocage.The figure presents an example of validationof retro-plumes computed with Mocage bycomparison with reference data from theCTBTO.Such exercises of "backtracking" will be carriedout regularly and, in the event of a realcrisis, RSMCs could be asked for support forboth plumes (direct) and retro-plumes(inverse) results. The "direct" and "inverse"configurations of Mocage will be available inpermanent operational mo<strong>de</strong> at the CNP in2008. 2142 . Research and <strong>de</strong>velopment: annual report 2007
19 Dispersion as a function of varying release heights.For the case of the fire of the Buncefield oil <strong>de</strong>pot (England,December 2005), the dispersion on the horizontal (left)and on the vertical (right) is shown 5 hours after the startof the release in 5 colours corresponding to 5 different initial heights :between 0 and 100 (red), between 100 and 250 m (pink),between 250 and 500 m (green), between 500 and 1000 (blue)and between 1000 and 2000 m (dark blue).20 An exceptional event of trans-AtlanticSaharan dust transport onto Martinique(M on the map) in mid-May 2007. Intersection (blue) and union (violetand blue) between retro-plumes computedby Mocage and by the CTBTO, for a situationin June 2007 at two sites located in Antarcticaand Argentina.2143 . Research and <strong>de</strong>velopment: annual report 2007
22ab50 hPa wind analyses (reference)Impact of ozone assimilationon wind velocity at 50 hPa (%)c10 m/s 10 m/s10080604020105-5-10-20-40-60-80-10050 hPa wind analyses (ozone assimilation) 50hPa horizontal wind (in m.s -1 ) in averagefor the period January 23 to January 31, 2006.Experience without assimilation of ozone (a), experiencewith assimilation ozone (b) and percentage differencebetween the two experiments (c).Dynamical impactof ozone assimilation in ARPEGEEnsemble Air QualityForecast for EuropeThe assimilation of satellite measurements ofchemical constituents allows to build reliablespatial and temporal distributions for keyatmospheric gases, such as ozone. It is nowexpected to retrieve some information onatmospheric dynamics from the <strong>de</strong>formationof the structures of ozone in the lower stratospherewhere its lifetime is sufficiently long.This information, additional to the one containedin operational meteorological observations,can potentially improve numericalweather forecasting, particularly in high altitu<strong>de</strong>,in areas with poor meteorological coverageor for medium-range forecasts.In or<strong>de</strong>r to characterize this impact, we haveused two tools: the first one is a <strong>de</strong>dicatedchemical assimilation suite, which is basedon the chemistry-transport mo<strong>de</strong>l Mocage ofMétéo-<strong>France</strong> and on the Palm software ofCERFACS; the other one is an extension of theoperational NWP suite ARPEGE, which assimi-late simultaneously meteorological andozone data. Specifically, the 4Dvar algorithmof ARPEGE was used to assimilate stratosphericozone observations from the AURA/MLSsoun<strong>de</strong>r together with meteorological observationsconsi<strong>de</strong>red in current operations atMétéo-<strong>France</strong>. In our experimental context,the variable "ozone" is treated as a passivetracer in ARPEGE while its first-guess, an in<strong>de</strong>pen<strong>de</strong>nt3D field analysis of ozone, is provi<strong>de</strong>dfor each assimilation cycle by Mocage-Palm.For the first time to our knowledge, the assimilationof actual ozone satellite measurementsin the NWP suite ARPEGE has showna non-neutral dynamical impact, althoughrelatively small at this stage. The mainimpact is a slight improvement in the predictionof wind beyond 24 hours at 50 hPa(~ 20 km) in the tropical region. Further studiesare on-going. 22Simulating the impact from transport meanson atmospheric chemistry and climateWithin the European research programQUANTIFY whose aim is to study the effectsof terrestrial, sea and aircraft transport onthe atmosphere and the climate, theARPEGE-Climat mo<strong>de</strong>l of CNRM has beenadapted to take into account these features.A main difficulty is to link small-scale phenomena(e.g. contrails from aircraft for instance)to the global scale represented byARPEGE-Climat. To bridge this gap, a “fuel”tracer is ad<strong>de</strong>d to the mo<strong>de</strong>l, with a lifespanvarying from 50 minutes (typical for boats)to 2 hours, around 10 km of altitu<strong>de</strong> (whichcorresponds to the dispersion of contrailsgenerated by airplanes). Thus, ARPEGE-Climat consi<strong>de</strong>rs the radiative effect oftransport by altering cloudiness. The chemi-cal impact is also taken into account bymodifications of the simplified chemistry ofthe ozone layer that now can consi<strong>de</strong>r theeffect of main pollutants that are nitrogenoxi<strong>de</strong>s, carbon monoxi<strong>de</strong> and water vapour.Using this version of ARPEGE-Climat, simulationsfor the XX th and the XXI st centuries willbe ma<strong>de</strong> during 2008 to assess the impactof transport for next <strong>de</strong>ca<strong>de</strong>s.In addition, ozone distributions simulatedby ARPEGE-Climat will be compared to theMOCAGE mo<strong>de</strong>l which has s a more sophisticatedchemistry. This will be done for a 10year snapshots, representative of today’satmosphere and for the years 2025, 2050and 2100. 232007 was marked by the first <strong>de</strong>monstrationof ensemble air quality forecasts overEurope, a <strong>de</strong>cisive step towards providing anoperational pan-European core service.These activities take place within the projectsGEMS and PROMOTE (ESA), upon whichthe operational GMES Atmospheric Servicewill be built. Météo-<strong>France</strong> has a coordinatingrole together with its partners at Prév'Airat the European scale, and provi<strong>de</strong>s forecastswith the chemistry-transport mo<strong>de</strong>lMocage.Validated systems for assimilating and forecastingair quality over Europe with relativelyfine resolutions (less than 50 km) have nowemerged, particularly in <strong>France</strong> with the platformPrév'Air. It is interesting to take advantageof the dispersion between mo<strong>de</strong>ls to<strong>de</strong>velop better forecasts and to estimatetheir probabilities of occurrence. Since July2007 and in the context of PROMOTE, threeoperational mo<strong>de</strong>ls (CHIMERE, EURAD andMocage) are combined to offer the first<strong>de</strong>monstration of an ensemble Air Qualityservice to potential users. Within GEMS, animportant harmonization work has beenachieved on emissions, meteorological forcingsand chemical boundary conditions;with about ten mo<strong>de</strong>ls involved, activitiesfocus on the exploitation of uncertainties inthe chemistry-transport mo<strong>de</strong>l themselves,as well as on different possible methodologiesfor ensemble forecasting.At the same time, an unprece<strong>de</strong>nted effort ofconcentration in near-real-time of Air Qualityobservations in about fifteen European countrieshas been done, in collaboration withthe local, regional and national measurementnetworks. These (non-validated) dataare converted into the BUFR format and areused for forecasts’ verification and surfacechemical data assimilation. 2444 . Research and <strong>de</strong>velopment: annual report 2007
Mocage T21L60Fuel3 “Fuel” tracer distribution at level 250 hPa (correspondingto cruise altitu<strong>de</strong> for subsonic aircraft). Apart from main airports,main atmospheric corridors can be seen, as the Northern Atlanticone, linking Europe to America.Traceur fuel (ppbv)24Décembre 2001 A Simulated Observing System Experiment (OSSE)conducted with Mocage-Palm for CO over Europe.The assimilation of pseudo-observations built froma reference mo<strong>de</strong>l run (top) can effectively constraina simulation that starts with an erroneous initial state(low). In the case studied, it takes about 24 hoursto correct the initial error.23257,36 hPaOn the website of ECMWF, forecasts fromMocage are presented together with severalother individual forecasts from otherstate-of-the-art mo<strong>de</strong>ls. All contributeto the <strong>de</strong>monstration of a European air qualityensemble forecast service.257 aout 2007 - 0 h 7 aout 2007 - 3 h 7 aout 2007 - 6 h 8 aout 2007 - 0 hRéférenceGeo OSSECOppbv300280260240220200180160140120100806040200Preliminary studies for air quality observationfrom the geostationary orbitThe observation of air quality from space is achallenge, especially in the context of GMES.In addition to ground-based observations,satellite measurements would provi<strong>de</strong> a complementaryspatio-temporal coverage, as wellas some vertical information in the loweratmosphere. The French operational consortiumPrév'Air for Air Quality favours a geostationarysoun<strong>de</strong>rwhich can provi<strong>de</strong> the nee<strong>de</strong>dtemporal resolutions, given the fast diurnalvariations of target pollutants: ozone, NO 2 , COand aerosol optical <strong>de</strong>pth.The <strong>de</strong>velopment of a remote-sensing instrumentthat would be suitable for a geostatio-nary platform, and would allow sufficient precisionand sensitivity raises many questions.In collaboration with LA, LISA and EADS/Astrium, CNRM contributes by conductingOSSEs (Simulated Observing SystemExperiment). The Mocage chemistry-transportmo<strong>de</strong>l is used to simulate pseudo-observationsthat follow the potential characteristics(geometry, frequency, errors,…) of a geostationaryinstrument; then, we assimilate these"synthetic" observations in or<strong>de</strong>r to quantifytheir ability to constrain forecasts of air quality.Thus, OSSEs provi<strong>de</strong> an objective basis to<strong>de</strong>velop and optimize the instrument.We illustrate here results from an OSSE for COobservation over Europe. From a referencesimulation performed with Mocage, geostationaryCO pseudo-observations are built.Starting from an erroneous initial state, weassimilate these in the mo<strong>de</strong>l. Within 24 h,the CO assimilation run is progressively catchingup with the reference which is an indicationof the ability of the observing system toconstrain the simulation and to compensateerrors (here on the initial condition). This workis also performed in the context of many internationalcollaborations. 2545 . Research and <strong>de</strong>velopment: annual report 2007
Avalanches and snow cover studiesA new wind blows on the Nivôse networkSince the first station installed in 1981, thenetwork of high mountain automatic Nivôsestations has been becoming one of the maintools for the operational avalanche forecasting.The French Snow Studies <strong>Centre</strong> (CEN) isresponsible for the current <strong>de</strong>ployment of thethird generation of stations, which aims toimprove quality and reliability of measurements.This new station keeps a maximal mechaniccompatibility with existing infrastructures, inor<strong>de</strong>r to reduce replacement costs. For thesame reasons, the alimentation by batteriesand solar panels and the satellite transmission(using the Météosat system) have beenkept.The station is now equipped with the newCampbell datalogger CR1000. All the sensorshave been changed, using, for instance, anew Young anemometer (wind speed anddirection) not too much perturbed by icing,the new Campbell snow<strong>de</strong>pth sensor SR50A,an optimised ventilated air temperature sensor,…Particular attention has been paid toreduce the station consumption, which was amajor source of malfunctioning of the previousstation generation.Early 2006, 21 stations were initially<strong>de</strong>ployed in the Alps, the Pyrenees and theCorsica massifs. During the summer 2007, 15of them were replaced. Moreover, two newstations have been installed in southern Alps(Orcières in the Champsaur massif andMillefonts in the Mercantour massif), hencereaching a total number of 23 stations.Next summer this rejuvenating operation ofthe whole network will be continued andcompleted, in or<strong>de</strong>r to monitor high mountainconditions for years to come. 26The DOLMEN project : a successfully transferfrom research to operational environmentBegun in February 2004, the DOLMEN projectaimed at improving the <strong>de</strong>velopment of asecond version of the operational applicationsused by avalanche forecasters in each<strong>de</strong>partmental centre (CDM). The DOLMEN projectwhose aim was to improve the <strong>de</strong>velopmentof a second version of the operationalapplications used by avalanche forecasters ineach CDM started in February 2004.Its three major objectives were :• The implementation of the SAFRAN chain(meteorological analysis) / the Crocus chain(snow mo<strong>de</strong>l) / the Mepra chain (avalanchehazard assessment) in a 100 % operationalenvironment (Toulouse computing centre and<strong>de</strong>partmental servers). These chains, <strong>de</strong>velopedby CEN, have been operated in a semioperationalmo<strong>de</strong> for several years but only asmall part of the results was available for endusers.• The increasing of functionalities of the softwarenamed “Poste Nivologie" with anaccess to all the mo<strong>de</strong>lling results. Severalcomparison products between observationand mo<strong>de</strong>l were <strong>de</strong>veloped especially to<strong>de</strong>termine the relevance of mo<strong>de</strong>lling.• The adaptation to the new codification systemof snow-meteo data.The <strong>de</strong>ployment in December 2007 of the versionV2.3 which fulfilled all these objectives,marked the end of the project. This transfer,which reflects a strong integration of thesnow monitoring system in the technicalarchitecture of Météo-<strong>France</strong>, has also beenfollowed up by many training courses eitherfor users of these new tools in CDM or forcomputing regional units in charge of monitoringthese applications..Subsequent <strong>de</strong>velopments will be performedwithin METEO-FRANCE standard framework.CEN obviously stays in charge ofscientific mo<strong>de</strong>ls improvement, as well asthe technical and functional responsibility ofthe tool DOLMEN. 273D mo<strong>de</strong>llingof water vapor diffusionin snow frommicrotomographicimages: applicationto isothermaletamorphismSnow, when placed in isothermal conditionsand at negative temperatures, turns into abrittle material ma<strong>de</strong> of small roun<strong>de</strong>dbodies which are typical of microstructurescommonly obtained during the sintering ofceramics. This complete transformation isclassically consi<strong>de</strong>red as limited by the watervapour diffusion that occurs in the porespace of the snow structure. In or<strong>de</strong>r to validatethis hypothesis, the water vapour fieldfrom small snow samples was mo<strong>de</strong>lizedfrom tri-dimensional images obtained by X-ray microtomography.Thanks to already <strong>de</strong>veloped algorithms, thecurvature field is first estimated at the air-iceinterface. By using the Kelvin’s equation, onecan <strong>de</strong>fine the vapour pressure conditionsnear the interface. Then, the diffusion equationis numerically solved with an iterativemethod, which provi<strong>de</strong>s, after convergence,the water vapour field in the pore space (seeFigure). The local vapour gradient, which isestimated close to the interface, yields thegrowth rate at each point of the interface (seefigure).From these results, the water vapour diffusioncan be seen as a limiting mechanism for isothermaltransformation. However they do notinvalidate other mechanisms that could happeninsi<strong>de</strong> the snow, such as surface reactionphenomena or growth at grain boundaries.This mo<strong>de</strong>l, which can be used to simulate theevolution of small snow structures, is a firststep for future more precise comparisons betweendifferent mechanisms.2846 . Research and <strong>de</strong>velopment: annual report 2007
the new Nivôse station of la Meije,at 3 100 m a. s. l. in the Oisans massif.26“Poste Nivologie” software .Visualization of mo<strong>de</strong>lling results.Map of precipitations over FrenchAlps massifs.Chablais : Simulated snow <strong>de</strong>pthrepartition and snow profiles.27a28 ba - 2-D slice of the vapour pressuremap computed from a snow imageof a sample that has beenmetamorphosing during 12 days un<strong>de</strong>risothermal conditions. Image edges areabout 3 mm wi<strong>de</strong> (300 voxels).b - Map of the local growth ratescomputed from an image of naturalsnow assuming a vapor diffusion-limitedmechanism in the snow matrix.Image edges are about 3 mm wi<strong>de</strong>(300 voxels). Growth rates rangefrom –0.15 x 10 -10 m/s (green)to +0.15 x 10 -10 m/s (red).47 . Research and <strong>de</strong>velopment: annual report 2007
Instrumentationfor ResearchThe instrumental teams were mainly concerned in 2007 by the COPScampaign, which took place in the Vosges and Germany. In the meantime,the first European Summer School <strong>de</strong>dicated to airborne measurementsalso took place and was so successful that it has been<strong>de</strong>ci<strong>de</strong>d to renew the experiment in 2008. Meanwhile, the ADM-AEO-LUS project went well ahead.Aircraft instrumentationFirst EUFAR summer schoolThe 1 st EUFAR summer school, SERAI, was organizedby the Romanian <strong>National</strong> MeteorologicalAdministration on July 2007 and was basedat Iasi airport, Romania. It aimed at providing atheoretical background to boundary layerdynamics and associated physical processes.The aircraft operator (SAFIRE) also informedthe stu<strong>de</strong>nts about issues specific to airbornemeasurements, such as safety rules, flightplan <strong>de</strong>sign and constraints and instrumentcalibration and operation.Firstly, stu<strong>de</strong>nts atten<strong>de</strong>d lectures about airborneinstruments and their performanceduring different flight patterns as well as informationabout flight restrictions and other airbornerelated problems provi<strong>de</strong>d by SAFIRE.Then, each stu<strong>de</strong>nt had the opportunity to <strong>de</strong>signhis/her own experiments and perform aresearch flight on the SAFIRE instrumentedATR-42. The main achievements of each groupcan be summarised as:• before flight: preparing the flight scenario inaccordance to the gui<strong>de</strong>lines of lecturers andaircraft operators; presenting the objectivesand methods to all stu<strong>de</strong>nts, followed by a discussionwith pilots and lecturers,• during flight: carrying out the necessary inflightmodifications of the scenario,• after flight: preparing a report of the group activitiesincluding quick-look impressions of theacquired data; <strong>de</strong>briefing, including <strong>de</strong>scriptionof flight plans alteration, quick-look result presentationand difficulties encountered.The collected data were processed and analysedwith the support of experienced users ofairborne facilities. Then, the stu<strong>de</strong>nts wrote ashort scientific report and shared their experimentsand results with the whole group andlecturers. During each step, stu<strong>de</strong>nts were helpedby the lecturers and the SAFIRE crew. Thewhole flight preparation, execution and<strong>de</strong>briefing was interactive, thanks to directcontacts with pilots, aircraft operators, andscientific experts.This summer school was both a good trainingexperiments but also a great opportunityfor knowledge exchange and scientificdiscussions. 1SAFIRE participation to the COPS campaignCNRS, Météo-<strong>France</strong> and CNES jointly operate3 research aircrafts un<strong>de</strong>r the SAFIRE project(Service <strong>de</strong>s Avions Français Instrumentéspour la Recherche en Environnement). TwoSAFIRE aircrafts (an ATR42 and a Falcon 20)took part in July 2007 in the internationalresearch campaign COPS (Convective andOrographically–induced Precipitation Study)to study the convection above the Black-Forestand the Vosges.The Falcon 20 flew during 55 hours and wasequipped with a LEANDRE2 lidar (a powerfullaser operating in visual wave-length, <strong>de</strong>tectingatmospheric water vapour). The flightsplans above the studied area were following agrid, at high altitu<strong>de</strong>. The lidar, through adown-looking window, provi<strong>de</strong>d importantinformation on the status of the atmospherebefore the convection initiation. The Flaconalso launched about 20 dropson<strong>de</strong>s (sensorsun<strong>de</strong>r a parachute), which send in real time theinformation of pressure, temperature, humidityand wind of the crossed air.The ATR42 flew 10 hours in the stratiform cloudswhich subsist after convective events. Theflights were <strong>de</strong>dicated to inter-comparison ofthe measurements of super-cooled water dropletsbetween ground radars and the aircraft.In conclusion, the SAFIRE aircraft brought complementarydata to the international community(german, english, dutch…) which willcontribute to better un<strong>de</strong>rstand this region'sthun<strong>de</strong>rstorms, and thus, improve the localweather forecasts. 2Integration of the newCAROLS radiometer onthe ATR 42 aircraftSAFIRE is a joint unit of CNRS / Météo-<strong>France</strong> /CNES which operates 3 instrumented aircrafts,including Météo-<strong>France</strong>’s instrumentedATR 42. This ATR can be equipped with existingbut also with newly <strong>de</strong>veloped instruments,such as the CAROLS (CooperativeAirborne Radiometer for Ocean and LandStudies) radiometer. This radiometer will beused, in particular, during the preparatorycampaign of the satellite SMOS (Soil Moistureand Ocean Salinity, of ESA).This new L-band microwave radiometer (<strong>de</strong>velopedby CETP) has been installed for the firsttime on the ATR in September 2007. Two 1.5meters high antennas have been fixed on theATR fuselage. These very sensitive antennashad to be placed outsi<strong>de</strong> the fuselage in sucha way as not to impe<strong>de</strong> on the aircraftmanoeuvrability. One antenna pointed atNadir (to the ground) and the other one at 35°,giving a crossing of data. The radiometer canbe coupled or not with the "Storm" weatherradar. SAFIRE carried out the <strong>de</strong>sign of theradar integration insi<strong>de</strong> the aircraft as well asthe certification of the entire installation.CAROLS estimates ocean salinity and soilmoisture. In the coming years, the ATR will participateto many scientific campaigns with thisnew radiometer. In<strong>de</strong>ed, soil moisture contentis an important factor in the meteorologicalphenomena initiation whose study is thereforefundamental. 348 . Research and <strong>de</strong>velopment: annual report 2007
Stu<strong>de</strong>nts and lecturers together on Iasiairport (Romania), in July 2007, nearthe ATR42 aircraft from Meteo-<strong>France</strong>and operated by Safire.1The ATR42 and the Falcon 20 operated bySAFIRE on Ba<strong>de</strong>n Airpark airport, in July 2007,during the COPS campaign.23Agendaand plansfor MOZAICand IAGOS CAROLS’ installation in the ATR cabin (the antenna hasa temperature regulation provi<strong>de</strong>d by the yellow cover)4Infrastructure for routine observationof the atmospheric chemistry from civilian aircraftsIAGOS aims to monitor large scale troposphericchemistry using air-borne in situ observationsfrom civilian Airbus aircrafts. It relies onthe experience gained since 1994 from theMOZAIC research programme and preparesthe transition into a sustainable infrastructurewith enhanced measurement capabilities,global coverage, and real timetransmission. IAGOS is part of IGACO (WMOAtmospheric Chemistry monitoring) for the<strong>de</strong>tection of long term changes and it alsomeets the requirements of future regionalscale Air Quality forecasting centres steeredby the European initiative GMES (GlobalMonitoring for Environment and Security).CNRM and DSO (management of operationalobservation) <strong>de</strong>signed a real time data distributionsystem similar to the AMDAR one(Aircraft Meteorological Data Relay), whichcollects air-borne meteorological observationsfor weather forecasting. In 2007, it was<strong>de</strong>ci<strong>de</strong>d to <strong>de</strong>fined a new on-board equipmentto act as an interface between the chemistryinstruments (ozone, water vapour,nitrogen oxi<strong>de</strong>s, carbon monoxi<strong>de</strong> anddioxi<strong>de</strong>, droplets and aerosol) and the aircraft49 . Research and <strong>de</strong>velopment: annual report 2007communication systems. This apparatusmust be easily and cheaply fitted insi<strong>de</strong> differentkind of aircrafts and to be able to evolvewith a future air analyzing instrumentation.At the end of 2007, FP7 <strong>de</strong>ci<strong>de</strong>d to supportthe preparatory phase of IAGOS that will startin September 2008 and will <strong>de</strong>fine the legal,economical and technical structure of theinfrastructure. 4
On site instrumentation and tele<strong>de</strong>tectionRetrieval of the three-dimensional wind fieldfrom the French operational weather radarsin the frame of the FLYSAFE projectThe French ARAMIS network is currently beingupgra<strong>de</strong>d with Doppler capacities. Thisupgra<strong>de</strong> will equip all radars with Dopplercapacities in or<strong>de</strong>r to obtain radial velocitymeasurements at high-resolution (1 km²) inprecipitating areas as far as 250 km awayfrom the radars. The Doppler upgra<strong>de</strong> of the24 operational radars should be completedby the end of 2008. At the end of 2007, thenetwork was composed of 15 Dopplerradarswhose data are about to be assimilatedby the AROME mo<strong>de</strong>l. Several tests havealready <strong>de</strong>monstrated the positive impact ofthese measurements on the quality of forecasts.Doppler velocities are in general difficult tointerpret because radars only measure theprojection of the wind vector along the beamaxis. The values of radial velocities are therefore<strong>de</strong>pen<strong>de</strong>nt on the wind field characteristicsbut also pon the relative position of theradar and on the precipitation system. With anetwork of Doppler radars with overlappingareas, the wind vector (u,v,w) can be retrieved.In that context, a real-time <strong>de</strong>monstratorhas been implemented in northern <strong>France</strong>. Inthe frame of the FLYSAFE project, a mesoscaledomain (size: 320 x 320 km², horizontal resolution:2.5 km) has been <strong>de</strong>fined encompassingthe Orly and Charles-<strong>de</strong>-Gaulle airports.Doppler velocities from 6 radars (Trappes,Abbeville, Arcis, Falaise, Avesnes et Bourges)were concentrated, pre-processed and combinedin real-time every 15 minutes.Many different precipitation systems havebeen analysed (frontal and stratiform systems,squall lines, …).The results obtained in the frame of this workhave <strong>de</strong>monstrated that very consistent informationcould be got about the mesoscalestructure of the three-dimensional flow in precipitationareas. The reconstructed windfields have been evaluated by comparisonwith wind profilers and by numerical simulations,where the reference wind field is perfectlyknown.In that context, results from the real-time<strong>de</strong>monstrator have lead the Radar users’group of Météo-<strong>France</strong> to recommend theoperational implementation of a nationalthree-dimensional reflectivity and wind fieldmosaic (operational in 2009). 5Meteorologicalmeasurementsduring the CirenecampaignThe CIRENE campaign, implemented byLOCEAN in the Indian Ocean by 55° E-80° E,10° S-3° S, was launched to better un<strong>de</strong>rstandthe ocean-atmosphere coupling at intraseasonalscale and to explain sea surfacetemperature variability mechanisms, and itsinfluence on the atmospheric column.This variability influences the monsoon, andcan contribute to the formation of El Nino.Closely linked to the VASCO campaign thatimplemented Aeroclipper and pressurisedballoons from the Seychelles Island, theCIRENE campaign took place aboard theFrench Research Vessel Le Suroît in Januaryand February 2007. CNRM participated to thiscampaign together with CETP and DT/INSUfor the implementation of turbulent heat andlatent fluxes and precipitations measurementsaboard IFREMER research vessels. Thisinstrumentation was composed of turbulence,temperature, humidity, pressure, andradiatives fluxes measurements, usuallyduplicated to increase reliability. The set upwas the same as the one on the Frenchresearch vessel l’Atalante during the 2006AMMA/EGEE campaign, but it has beennecessary to set a special 11 metres mast tomeasure wind an radiative fluxes in goodconditions, thus reducing the vessel structureinfluence.In or<strong>de</strong>r to document atmospheric verticalstructure, CNRM ma<strong>de</strong> between 2 and 8radiosoundings; all transmitted in real time tothe Global Transmission System. This datasetwill contribute to a better un<strong>de</strong>rstanding ofatmospheric phenomena in this area.650 . Research and <strong>de</strong>velopment: annual report 2007
56 Horizontal and vertical cross-sections at 2 500 m obtainedby combining the data from Trappes, Arcis and Abbevilleon the 23 June 2005 at 1630 UTC during a severe convectiveepiso<strong>de</strong>. The domain, centered on Trappes, has an extensionof 160 x 160 km² and a resolution of 2.5 km. The reflectivityfield is shown in colors. The arrow-less areas correspondto precipitation-free areas where no velocity data are available.Despite the rather large distance between radars, it can beseen that convective scale structures can be recovered. The French research vessel Le Suroîtwith it the 11 metre mast in Victoria harbour(Seychelles islands). On the bow,an Aeroclipper gondola readyfor an instrumented mast inter comparison.51 . Research and <strong>de</strong>velopment: annual report 2007
Instrumentation duringthe COPS campaignThe German Research Foundation provi<strong>de</strong>s base funding for Quantitative PrecipitationForecast Researchs. One of the key action of this program was the Convective andOrographically induced Precipitation Study (COPS), an international field campaign. Thefield experiment was set in South-West Germany and South-East <strong>France</strong> (mainly Vosges andthe Black Forest) from June to August 2007. Several French laboratories took part in thiscampaign like Laboratoire d’Aérologie, Institut Pierre-Simon Laplace, IGN, LAMP, SAFIRE,CNRM/GMEI... Among other things, Météo-<strong>France</strong> <strong>de</strong>veloped a super-site instrumentation inMeistratzheim (20 km South of Strasbourg) in July 2007.This super-site was equipped with two surface flux stations recording ground temperatureand moisture, a scintillometer for measures of the surface sensible heat flux over a 3 kmlong horizontal path. To <strong>de</strong>scribe the lower layers, a modified ceilometer, a doppler sodarand an UHF wind profiler will be used during the IOP campaign, when 110 radioson<strong>de</strong>s havebeen launched and incorporated into the data assimilation system of the forecast mo<strong>de</strong>l.Every days, quicklooks of all of the instruments were sent to the operation centre in Ba<strong>de</strong>nBa<strong>de</strong>n, Germany, where a SYNERGIE station had been set. Forecasters of the inter-regionalservice of Météo-<strong>France</strong> (DIRNE from Strasbourg) also worked on forecasts for the researchersof the campaign and the pilots of aircrafts. This exchange between researchers andforecasters from different European countries happened to be a very fulfilling experience onboth si<strong>de</strong>s.7Preparationof the ADM-AEOLUSspace missionThe wind lidar ADM-AEOLUS space missionof the European Space Agency is in its finalstages of <strong>de</strong>velopment before the launchnow planned for mid-2009.In 2007, CNRM has continued its work in 3different activities related to the processorsof level 1b (dated and geo-referenced windsuncorrected from pressure and temperatureeffects), 2a (optical products) and 2b (windsthat weather forecasting systems can assimilate).The level 1b processor is now nearlycompleted. As far as level 2a is concerned,CNRM <strong>de</strong>livered two successive versions ofthe prototype processor. We also started anew activity on the in-flight radiometric calibrationof the instrument required by thelevel 2a processor. Lastly, the <strong>de</strong>velopmentof the level 2b processor has progressed incollaboration with the European <strong>Centre</strong> forMedium-range Weather Forecast, and theDutch weather service KNMI. Our contributionbore mainly on the <strong>de</strong>velopment of aportable version of the processor <strong>de</strong>dicatedto weather services that wish to assimilateADM data themselves.The A2D has passed several successfulsteps in 2007 thanks to the hard work of theDLR. Two ground-based campaigns were carriedout, as well as a first airborne campaign.A second airborne campaign isplanned for 2008.An announcement of opportunity was publishedby ESA for the in-flight calibration / validationof the instrument. The AO was basedon a requirement document to which wecontributed through reviews. CNRM submittedan answer based on the work plan proposedand supported by CNES. The answer isma<strong>de</strong> of 5 different proposals from 5 Frenchresearch institutes. CNRM is responsible fortheir coordination. 852 . Research and <strong>de</strong>velopment: annual report 2007
7 Radioson<strong>de</strong> balloon in Meistratzheim8Aeolus transmitter laser.The two amplifier units(the two rectangular blocks)each contain eight laser dio<strong>de</strong> stacks.53 . Research and <strong>de</strong>velopment: annual report 2007
Communicationand promotionCNRM communicates and promotes its activities in the field ofresearch. Two major events took place in 2007: the first one consistedin answering the numerous questions around climate changes, theother one was the creation ofCNRM scientific publications.an access free archive to promoteCommunicationStrengthening the general awarenessabout climate changeThe publication of the GIEC 4 th report, followedby the Nobel prize awar<strong>de</strong>d to climate experts,ma<strong>de</strong> the headlines in 2007. In this context,scientists from Météo-<strong>France</strong> were very muchsolicited.Many popular scientific magazines (Science &Avenir, Pour la Science, La Recherche, Science& Vie, …) released a special "climate change"issue in 2007. Papers written by CNRM orDCLIM scientists were systematically submittedand accepted by the editorial committeeof these magazines. The non-specializednational press, whether newspapers, televisionor radio, followed suit and numerousinterviews and reports were ma<strong>de</strong>. As anexample, let us cite notably the interventionsby S. Planton, by P. Delécluse or by E. Brun inseveral successful radio or television programs.(« Téléphone sonne » or « CO 2 monamour » on <strong>France</strong> Inter, « C dans l’Air » on<strong>France</strong> 5, special program at 20 h 50 on<strong>France</strong> 3, television and radio interviews onTF1, <strong>France</strong> 2, RTL, Europe 1, <strong>France</strong> Info, …).CNRM researchers also took part in about 80conferences on these themes, the <strong>de</strong>batesbeing sometimes either very scientific or,sometimes, for the general public.In term of internal communication, severalevents were organized on the site of theMétéopole : presentation of first GIEC workinggroup report at the CIC (250 persons), 5 CNRMseminaries on this topic (about 100 personsattending every session), talks following theprojections of the film « An Inconvenient Truth ».Efforts of internal training were also followedby the organization of 2 training sessionsabout "climate changes" in cooperation withENM.All these actions led to a better un<strong>de</strong>rstandingof the work carried by Météo-<strong>France</strong> on climate,and to make our fellow citizens sensitiveto planet warming. This step will go on in2008, with notably for the first time, an externaltraining course on the same topic. 1The new open access archive HAL Météo-<strong>France</strong>The open access archive HAL Météo-<strong>France</strong>has been implemented on the 3 rd October2007. This electronic repository of full-textMétéo-<strong>France</strong> scientific publications gatherstogether articles published in peer-reviewedjournals, PhD theses, “habilitations à diriger<strong>de</strong>s recherches” and conference proceedings.It is a subset of HAL, an interdisciplinaryonline archive initiated by the <strong>Centre</strong><strong>National</strong> <strong>de</strong> la Recherche Scientifique(CNRS). HAL Météo-<strong>France</strong> perpetuates thescientific production of Météo-<strong>France</strong> andincreases its value. With this creation,Météo-<strong>France</strong> is joining the internationalmovement for free access to scientificresearch results. As all other open archives,HAL Météo-<strong>France</strong> provi<strong>de</strong>s an easier accessto the most recent scientific literature forresearchers of the countries of the South.The documents are <strong>de</strong>posited by theirauthors, in respect of the publishers copyrightpolicies, with the support of Météo-<strong>France</strong> librarians. If full-text archiving is notauthorized by the publisher of a journal,only the bibliographic metadata are accessible.A set of explanations and helpresources are available on-line on theMétéo-<strong>France</strong> Intranet. The implementationof HAL Météo-<strong>France</strong> is the first step tomo<strong>de</strong>rnize the whole Météo-<strong>France</strong> scientificinformation system. 254 . Research and <strong>de</strong>velopment: annual report 2007
Serge Planton, Head of Climate Resarchat Météo-<strong>France</strong>, with Joël Collado (Météo-<strong>France</strong>/Radio-<strong>France</strong>), during a lectureabout climate changes during the jazz festival“ Jazz in Marciac “, in August 7 th 2007.Internet access toHAL Météo-<strong>France</strong>55 . Research and <strong>de</strong>velopment: annual report 2007
Appendix2007 scientific papers listPapers whose at least one author is evaluated by CNRM and is not secon<strong>de</strong>d appear in clear in the list below.Papers published in rank “ A “ journals (Impact factor > 1)Ahmadov R., C. Gerbig, R. Kretschmer, S. Koener, B.Neininger, A.J. Dolman, C. Sarrat, 2007 : Mesoscalecovariance of transport and CO 2 fluxes: evi<strong>de</strong>ncefrom observations and simulations using the WRF-VPRM coupled atmosphere-biosphere mo<strong>de</strong>l, J.Geophys. Res., 112, D22107, doi:10.1029/2007JD008552.An<strong>de</strong>rsson E, , Holm E, Bauer P., Bejaars A., KellyG.A., McNally A.P., Simmons A.J., Thepaut J.-N. andTompkins A. M., 2007 : Analysis and forecastimpact of the main humidity observing systems. QJ ROY METEOR SOC 133 (627): 1473-1485 Part BJUL 2007.Auer I., Boehm, R., Jurkovic, A., Lipa, W., Orlik, A.,…, Mestre, O., Moisselin, J-M, and al, 2007 : HIS-TALP - historical instrumental climatological surfacetime series of the Greater Alpine Region. INT J CLI-MATOL 27 (1): 17-46 JAN 2007.Auger L. and B. Legras, 2007 : Chemical segregationby heterogenous emissions. AtmosphericEnvironment, 41, 2303-2318.Auligné T, 2007. An objective approach to mo<strong>de</strong>llingradiances: application to AIRS biases in satelliteand AMSU-A. Q J ROY METEOR SOC 133 (628):1789-1801 Part A OCT 2007Auligné T, McNally A.P. and Dee D.P. , 2007 :Adaptive bias correction for satellite data in anumerical weather prediction system. Quart. J. R.Met. Soc., 133, 631-642.Auligné T. and McNally A.P., 2007 : Interaction betweenbias correction and quality control. Quart. J.R. Met. Soc., 133, 643-653.Baghdadi N., Aubert M., Cerdan O., FranchistéguyL., Viel C., Martin E., Zribi M. and Desprats J.-F.,2007 : Operational mapping of soil moisture usingsynthetic aperture radar data: application to Touchbasin (<strong>France</strong>). Sensors Journal, vol. 7, pp. 2458-2483.Baker B. and J.-L. Brenguier, 2007 : Radar and In-Situ Observations of Small Cumulus: PhysicalInterpretations of Radar Bragg Scatter, Quart. J. Roy.Meteorology, 133(628) : 1677 -1692.Baret F., O. Hagolle, B. Geiger, P. Bicheron, B. Miras,M. Huc, B. Berthelot, M. Weiss, O. Samain, J.-L.Roujean et M. Leroy, 2007 : LAI, fAPAR and fCoverCYCLOPES global products <strong>de</strong>rived from VEGETA-TION. Part 1 : Principles of the algorithm, RemoteSensing of Environment, 110, 275-286.Bergot T., E. Terra<strong>de</strong>llas, J. Cuxart, A. Mira, O. Liechti,M. Mueller and N. Woetmann Nielsen, 2007 :Intercomparison of single-column numericalmo<strong>de</strong>ls for the prediction of radiation fog. J. Appl.Meteorol., 46, 504-521.Bock O., F. Guichard, S. Janicot, J.-P. Lafore, M.-N.Bouin and B. Sultan, 2007 : Multiscale analysis ofprecipitable water vapor over Africa from GPS dataand ECMWF analyses, Geophys. Res. Lett., 34,L09705, doi : 10.1029/2006GL028039.Boé J., Terray L., Habets F., Martin E., 2007 : Statisticaland dynamical downscaling of the Seine basinclimate for hydrometeorological studies. InternationalJournal of Climatology, DOI:10.1002/joc.1602.Bormann N. and Thepaut J-N., 2007 : Assimilationof MIPAS limb radiances in the ECMWF system. I:Experiments observation with a 1-dimensionaloperator, Q J ROY METEOR SOC 133 (623): 309-327Part B JAN 2007.Bourras D., G. Reverdin, G. Caniaux and S. Belamari,2007 : A nonlinear statistical mo<strong>de</strong>l of turbulent airseafluxes. Mon. Wea. Rev., 135, (3), 1077-1089,doi : 10.1175/MWR3335.1.Bousquet O., Tabary P. et al., 2007 : On the value ofoperationally synthesized multiple-Doppler windfields - art. no. L22813, GEOPHYS RES LETT 34 (22):22813-22813 NOV 29 2007.Bousserez N., J.-L. Attié, V.-H. Peuch, M. Michou, G.Pfister, D. Edwards, M. Avery, G. Sachse, E. Browelland E. Ferrare, 2007 : Evaluation of MOCAGE chemistryand transport mo<strong>de</strong>l during the ICARTT/ITOPexperiment, J. Geophys. Res., 112 (D120S42), doi:10.1029/2006JD007595.Buizza R, Cardinali, C. Kelly, G, Thepaut J-N, 2007 :The value of observations. II: The value of observationslocated in singular-vector-based target areas.Q J ROY METEOR SOC 133 (628): 1817-1832 Part AOCT 2007.Burnet F. and Brenguier, J-L, 2007 : ObservationalStudy of the Entrainment-Mixing Process in WarmConvective Clouds, J. Atmos. Sci., 64, 1995-2011.Caballero Y., P. Chevallier, A. Boone, F. Habets andJ. Noilhan, 2007: Calibration of the InteractionSoil Biosphere land-surface scheme on a smalltropical high mountain basin (Cordillera Real,Bolivia). Wat. Res. Research, 43, doi:10.1029/2005WR004490.56 . Research and <strong>de</strong>velopment: annual report 2007Caballero Y., S. Voirin-Morel, F. Habets, J. Noilhan, P.LeMoigne, A. Lehenaff, A. Boone, 2007: Hydrologicalof the Adour-Garonne river basin to climatechange. Water Resources Research, 43, Doi: 101029/2005WR004192.Calvet J.-C., A. Gibelin, J. Roujean, E. Martin, P.LeMoigne, H. Douville and J. Noilhan, 2007 : "Pastand future scenarios of the effect of carbon dioxi<strong>de</strong> onplant growth and transpiration for three vegetationtypes of southwestern <strong>France</strong>", Atmos. Chem. Phys.Discuss., 7, 4761-4779.(http : //www.copernicus.org/EGU/acp/acpd/7/4761/acpd-7-4761.pdf).Cardinali C, , Buizza R, Kelly G., Shapiro M., Thepaut, J-N., 2007 : The value of observations. III: Influence ofweather regimes on targeting. Q J ROY METEOR SOC133 (628): 1833-1842 Part A OCT 2007.Cariolle D. and H. Teyssèdre, 2007 : a revised linearozone photochemistry parameterization for use intransport and general circulation mo<strong>de</strong>ls: multiannualsimulations.Atmospheric Chemistry andPhysics, Vol 7, Pages : 2183-2196.Catry B., J.-F. Geleyn, M. Tudor, P. Bénard and A.Trojakova, 2007 : Flux-conservative thermodynamicequations in a mass-weighted framework. Tellus,59A, pp. 71-79.Chaboureau J.-P., Tulet P., Mari C., 2007. Diurnalcycle of dust and cirrus over West Africa as seenfrom Meteosat Second Generation setellite and aregional forecast mo<strong>de</strong>l. Geophys. Res. Lett., 34,L02822, doi: 10.1029/2006GL027771.Chauvin F. and S. Denvil, 2007 : Changes in severeindices as simulated by two French coupled globalclimate mo<strong>de</strong>ls. Global and Planetary Change, 57(1-2), 96-117.Chen J., R. J. Griffin, A. Grini and P. Tulet, 2007 :Mo<strong>de</strong>ling secondary organic aerosol formationthrough cloud processing of organic compounds.Atmos. Chem. Phys., 7, 5343-5355.Chevalier A., F. Gheusi, R. Delmas, C. Ordóñez, C.Sarrat, R. Zbin<strong>de</strong>n, V. Thouret, G. Athier and J.-M.Cousin, 2007 : Influence of altitu<strong>de</strong> on ozone levelsand variability in the lower troposphere: a surfacemeasurementsbased study for western Europe overthe period 2001-2004. Atmos. Chem. Phys., 7, 4311-4326.Chevrot S., Sylvan<strong>de</strong>r M., Benahmed S., PonsollesC. Lefevre J.-M., Paradis D., 2007 : Source locationsof secondary microseisms in western Europe:
Evi<strong>de</strong>nce for both coastal and pelagic sources. JGEOPHYS RES-SOL EA 112 (B11): - NOV 1 2007Chosson F., J.-L. Brenguier and L. Schüller, 2007 : Entrainment-mixingand radiative transfer simulation inboundary-layer clouds. J. Atmos. Sci., 64, 2670-2682.Clark H.L., M.-L. Cathala, H. Teyssèdre, J.-P. Cammasand V.-H. Peuch, 2007 : Cross-tropopause fluxes ofozone using assimilation of MOZAIC observationsin a global CTM, Tellus, 59B, 39-49.Conil S., H. Douville, S. Tyteca, 2007, "The relativeroles of soil moisture and SST in climate variabilityexplored within ensembles of AMIP-type simulations".Climate Dyn., 28, 125-145, doi: 10.1007/s00382-006-0172-2.Courault D., Drobinski Ph., Brunet Y., Lacarrere P.,Talbot C., 2007 : Impact of surface heterogeneity ona buoyancy-driven convective boundary layer inlight winds, Boundary layer meteorology, doi:10.1007/s10546-007-9172-y.Couvreux F., F. Guichard, V. Masson and J.L.Re<strong>de</strong>lsperger, 2007 : Negative water vapour skewnessand dry tongues in the convective boundarylayer: observations and LES budget analysis. BoundaryLayer Meteorology, 123,269-294.Cuvelier C., P. Thunis, R. Vautard, M. Amann, B.Bessagnet, M. Bedogni, R. Berkowicz, F. Brocheton, P.Builtjes, C. Carnavale, A. Coppalle, B. Denby, G.Douros, A. Graf, O. Hellmuth, C. Honore, J. Jonson, A.Kerschbaumer, F. <strong>de</strong> Leeuw, E. Minguzzi, N.Moussiopoulos, C. Pertot, V.H. Peuch, G. Pirovano, L.Rouil, F. Sauter, M. Schaap, R. Stern, L. Tarrason, E.Vignati, L. Volta, L. White, P. Wind, A. Zuber, 2007 :CityDelta, a mo<strong>de</strong>l intercomparison study to explorethe impact of emission reductions in European citiesin 2010, Atmos. Env., ATMENV-D-06-00252R1, Atmos.Env., 41(1), 189-207.Decharme B. and H. Douville, 2007: "Global validationof the ISBA Sub-Grid Hydrology". Climate Dyn.,doi: 10.1007/s00382-006-0216-7.Delon C., C.E. Reeves, D.J. Stewart, D. Serça, R.Dupont, C. Mari, J.-P. Chaboureau and P. Tulet, 2007: Nitrogen Oxi<strong>de</strong> biogenic emissions from soils:impact on NOx and ozone formation in West Africaduring AMMA (African Monsoon Multidis-ciplinaryAnalysis). Atmos. Chem. Phys. Discuss., 7, 15155-15188.Descamps L. and O. Talagrand, 2007: On some aspectof the <strong>de</strong>finition of initial conditions for ensemble prediction.Mon. Wea. Rev., 135, 3260-3272.Descamps L., D. Ricard, A. Joly and P. Arbogast,2007 : "Is a Real Cyclogenesis Case Explained byGeneralized Linear Baroclinic Instability? ". J. Atm.Sci., 64, 4287-4308.Donlon C., Robinson I., Casey K., Vazquez-Cuervo J.,Armstrong E., Arino O., Gentemann C., May D.,LeBorgne P. and al, 2007 : The global ocean dataassimilation experiment high-resolution sea surfacetemperature pilot project. BAMS, Volume: 88Issue: 8 Pages: 1197-1213.Douville H., S. Conil, S. Tyteca, A. Voldoire, 2007 : Soilmoisture memory and West African monsoon predictability:artefact or reality? Climate Dyn., doi: 10.1007/s00382-006-0207-8.Drobinski Ph., P. Carlotti, JL. Re<strong>de</strong>lsperger, RM. Banta,V. Masson, RK. Newsom, 2007 : Numerical and experimentalinvestigation of the neutral atmosphericsurface layer. American Meteorological Society, 64,137-156, JAS doi: 10.1175/JAS3831.1.Drobinski Ph. , F. Said, G. Ancellet, J. Arteta, P.Augustin, S. Bastin, A. Brut, J.L. Caccia, B.Campistron, S. Cautenet, A. Colette, I. Coll, U.Corsmeier, B. Cros, A. Dabas, H. Delbarre, A. Dufour,P. Durand, V. Guénard, M. Hasel, N. Kalthoff, C.Kottmeier, F. Lasry, A. Lemonsu, F. Lohou, V. Masson,L. Menut, C. Moppert, V.H. Peuch, V. Puygrenier, O.Reitebuch, R. Vautard, 2007 : Regional transportand dilution during high pollution episo<strong>de</strong>s in southern<strong>France</strong>: Summary of findings from theESCOMPTE experiment. J. Geophys. Res., 112,D13105, doi: 10.1029/2006JD007494.Drobinski Ph. , R. Steinacker, H. Richner, K.Baumann-Stanzer, G. Beffrey, B. Benech, H. Berger,B. Chimani, A. Dabas, M. Dorninger, B. Dürr, C.Flamant, M. Frioud, M. Furger, I. Gröhn, S. Gubser, T.Gutermann, C. Häberli, E. Häller-Scharnhost, G.Jaubert, M. Lothon, V. Mitev, U. Pechinger, M.Piringer, M. Ratheiser, D. Ruffieux, G. Seiz, M.Spatzierer, S. Tschannett, S. Vogt, R. Werner, G.Zängl, 2007 : Föhn in the Rhine Valley during MAP: Areview of its multiscale dynamics in complex valleygeometry, 2007: Quart. J. Roy. Meteor. Soc. , 133,897-916 2007Errico RM., Bauer P. and Mahfouf J-F, 2007 : Issuesregarding the assimilation of cloud and precipitationdata, J ATMOS SCI 64 (11): 3785-3798.Escorihuela M.J., Y. Kerr, P. <strong>de</strong> Rosnay, J. P. Wigneron,J.-C. Calvet and F. Lemaître, 2007 : A Simple Mo<strong>de</strong>l ofthe Bare Soil Microwave Emission at L-Band, /IEEETrans. Geosc. //Remote Sens., Vol. 45, No. 7, pp.1978-1987.Escorihuela M.J., P. <strong>de</strong> Rosnay, Y. Kerr and J.-C. Calvet,2007 : Influence of bound water relaxation frequencyon soil moisture measurements, IEEE Trans.Geosc. RemoteSens. Vol. 45, No. 12, pp. 4067-4076.Fel<strong>de</strong>r M., P. Poli et J. Joiner, 2007 : Errors induced byozone field horizontal inhomogeneities into simulatednadir-viewing orbital backscatter UV measurements.Jour. Geophys. Res. (Atmospheres). Vol. 112,No. D1, D01303 10.1029/2005JD006769.Friedrich K., U. Germann, J. Gourley and P. Tabary,2007 : Effects of radar beam shielding on rainfallestimation for the polarimetric C-band radar. JATMOS OCEAN TECH 24 (11): 1839-1859 NOV 2007.Geer A.J., W.A. Lahoz, D.R. Jackson, D. Cariolle, J.PMcCormack, 2007 : Evaluation of linear ozone photochemistryparametrizations in a stratosphere-tropospheredata assimilation system. ATMOS CHEMPHYS 7: 939-959 FEB 21 2007.Gibert F., J. Cuesta, J.-I. Yano, N. Arnault and P.-H.Flamant, 2007 : On the correlation between convectiveplume up and downdrafts, lidar reflectivity and<strong>de</strong>polarization ratio. Boundary Layer Meteorol.,125(3) : 553-573, déc 2007.Gourley J.-J., P. Tabary, J. Parent du Chatelet, 2007:Empirical estimation of attenuation from differentialpropagation phase measurements at C-band, J.Appl. Meteor., 46, No. 3, 306 - 31757 . Research and <strong>de</strong>velopment: annual report 2007Gourley J.-J., P. Tabary, J. Parent du Chatelet, 2007:A fuzzy logic algorithm for the separation of precipitatingfrom non-precipitating echoes using polarimetricradar, J. Atmos. Oceanic Technol., Vol. 24,No. 8, 1439-1451.Guemas V., D. Salas-Mélia (2007) : Simulation of theAtlantic meridional overturning circulation in anatmosphere-ocean global coupled mo<strong>de</strong>l. Part I: amechanism governing the variability of ocean convectionin a preindustrial experiment, Climate Dynamics.doi: 10.1007/s00382-007-0336-8. (http://www.springerlink.com/content/b67l67835n0k7650).Guemas V., D. Salas-Mélia (2007) : Simulation of theAtlanticmeridionaloverturning circulation in an atmosphere-oceanglobal coupled mo<strong>de</strong>l. Part II : weakeningin a climate change experiment: a feedback mechanism,Climate Dynamics. doi: 10.1007/s00382-007-0328-8.(http://www.springerlink.com/content/6322236q88285k37)Hallegatte S., 2007 : The use of synthetic hurricanetracks in risk analysis and climate change damageassessment, J. Appl. Meteor. Clim., 46, 1956-1966.Hallegatte S., J.-C. Hourca<strong>de</strong> and P. Ambrosi, 2007a :Using climate analogues for assessing climatechange economic impacts, Climatic Change, 82, 47-60.Hallegatte S., J.-C. Hourca<strong>de</strong> and P. Dumas, 2007b :Why economic dynamics matter in assessing climatechange damages: illustration on extreme events,Ecological Economics, 62, 330-340.Haman K., S. Malinowski, M. Kurowski, H. Gerber,and J.-L.Brenguier, 2007 : Small scale mixing processesat the top of a marine stratocumulus – a casestudy. QJRMS, Volume: 133 Issue: 622 Pages: 213-226Part: A.Healy SB, JR Eyre, M. Hamrud and J.-N. Thepaut,2007 : Assimilating GPS radio occultation measurementswith two-dimensional bending angleobservation operators, Q J ROY METEOR SOC 133(626): 1213-1227 Part A JUL 2007Illingworth A.J., R.J. Hogan, E.J. O'Connor, D.Bouniol, M.E. Brooks, J. Delanoë, D.P. Donovan, J.D.Eastment, N. Gaussiat, J.W.F. Goddard, M.Haeffelin, H. Klein Baltink, O.A. Krasnov, J. Pelon, J.-M. Piriou, A. Protat, H.W.J. Russchenberg, A. Seifert,A.M. Tompkins, G.-J. Van Za<strong>de</strong>lhoff, F. Vinit, U.Willén, D.R. Wilson and C.L. Wrench, 2007 : CLOUD-NET, Continuous Evaluation of Cloud Profiles inSeven Operational Mo<strong>de</strong>ls Using Ground-BasedObservations. BAMS, 88 June 2007, doi:10.1175/BAMS-88-6-xxx.Jacob D., L. Bärring, O.B. Christensen, J.H. Christensen,M. <strong>de</strong> Castro, M. Déqué, F. Giorgi, S. Hagemann,M. Hirschi, R. Jones, E. Kjellström, G. Len<strong>de</strong>rink, B.Rockel, E.S. Sànchez, C. Schär, S.I. Seneviratne, S.Somot, A. Van Ul<strong>de</strong>n, B. Van Den Hurk, 2007 : Aninter-comparison of regional climate mo<strong>de</strong>ls forEurope: Design of the experiments and mo<strong>de</strong>l performance.Climatic Change 81, 31-52, suppl 1, may2007.Joiner J., G. Brin, A. da Silva, R. Treadon, J. Derber, P.Van Delst, J. Le Marshall, P. Poli, R.-M. Atlas, C. Cruzand D. Bungato, 2006 : Effects of data selection onthe assimilation of AIRS data. Quart. Jour. Roy.Meteor. Soc., 133 pp. 181-196.
Joly M., A. Voldoire, H. Douville, P. Terray and J.-F.Royer, 2007 : African monsoon teleconnec-tionswith tropical SSTs : validation and evolution in aset of IPCC4 simulations, Climate Dynamics, doi:10.1007/s00382-006-0215-8 URL :http://dx.doi.org/10.1007/s00382-006-0215-8Kelly G, JN Thepaut, R. Buizza and C. Cardinali,2007 : The value of observations. I: Data <strong>de</strong>nialexperiments for the Atlantic and the Pacific. Q J ROYMETEOR SOC 133 (628): 1803-1815 Part A Oct2007Lahoz W.A., A.J. Geer, S. Bekki, N. Bormann, S.Cec-cherini, H. Elbern, Q. Errera, H.J. Eskes, D.Fonteyn, D.R. Jackson, B. Khattatov, S. Massart, V.-H. Peuch, S. Rharmili, M. Ridolfi, A. Segers, O.Talagrand, H.E. Thornton, A.F. Vik et T. VonClarman, 2007 : The Assimilation of Envisat data(ASSET) project, Atmos. Chem. Phys., 7, 1773-1796.(http ://www.copernicus.org/EGU/acp/acp/recent_papers.html).Legrand M., S. Preunkert, M. Schock, M.Cerqueira, A. Kasper-Giebl, J. Afonso, C. Pio, A.Gelencsér and I. Dombrowski-Etchevers, 2007 :Major 20th century changes of carbonaceousaerosol components (EC, WinOC, DOC, HULIS, carboxylicacids, and cellulose) <strong>de</strong>rived from Alpineice cores, J. Geophys. Res., 112, D23S11,doi:10.1029/2006JD00808.Lejeune Y., P. Wagnon, L. Bouilloud, P. Chevallier, P.Etchevers, E. Martin, E. Sicart, F. Habets, 2007 :Melting of snow cover in a tropical mountain environmentin Bolivia: Processes and mo<strong>de</strong>lling, J. ofHydrometeorology, 8 (4), 922-937.Lemonsu A., V. Masson and E. Berthier, 2007 :Improvement of the hydrological component of anurban soil-vegetation-atmosphere transfer mo<strong>de</strong>l.Hydrological processes, 21, 2100-2111.Lothon M., F. Couvreux, S. Donier, F. Guichard, P.Lacarrère, J. Noilhan, F. Said, 2007 : Organised structuresin the sahelian boundary layer during the drydown season : Impact on flux estimates by aircraftmeasurements. Boundary Layer Meteorology,124,425-447, doi: 10.1007/s10546-007-9182-9.Lovejoy S. and Schertzer, D., 2007 : Scaling andmultifractal fields in the solid earth and topography.Nonlinear processes in geophysics, 14(4):465-502.Lovejoy S., Tuck, A. F., Hov<strong>de</strong>, S. J. and Schertzer, D,2007 : Is isotropic turbulence relevant in the atmosphere?- art. no. L15802. Geophys. Res. Lett.,34(15):15802-15802.Malinowski S., C. Haman, H. Gerber and J. L. Brenguier,2007 : Small scale mixing processes at thetop of a marine stratocumulus - a case study. Quart.J. Roy. Meteorology, 133, 622, 213-226.Montmerle T., F. Rabier and C. Fischer, 2007 : Respectiveimpact of polar-orbiting and geostationarysatellites observations in the Aladin/<strong>France</strong> numericalweather prediction system. Quart. J. Roy.Meteor. Soc., 133,.655-671.Muñoz Sabater J., L. Jarlan, J.-C. Calvet, F. Bouyssel,P. De Rosnay, 2007 : From near-surface to root-zonesoil moisture using different assimilation techniques”,/J. Hydrometeorol/., Vol. 8, No 2, pp. 194-206.Paci A., G. Caniaux, H. Giordani, M. Lévy, L. Prieurand G. Reverdin, 2007 : A high resolution simulationof the ocean during the POMME experiment:Mesoscale variability and near surface processes. J.Geophys. Res., 112, doi : 10.1029/2005JC003389.Pannekoucke O., L. Berre, G. Desroziers, 2007 :Filtering properties of wavelets for local background-errorcorrelations. Quarterly Journal of theRoyal Meteorological Society. Volume 133, Issue623 , Pages 363 - 379.Peyrillé Ph., J.-P. Lafore, J.-L. Re<strong>de</strong>lsperger, 2007 : Ani<strong>de</strong>alized two-dimensional framework to study theWest African Monsoon. Part I: validation and keycontrolling factors', Journal of Atmospheric Sciences.Vol. 64, No. 8, p2765-2782.Peyrillé Ph. and J.-P. Lafore, 2007 : An I<strong>de</strong>alizedTwo-Dimensional Framework to Study the WestAfrican Monsoon, Part II: Role of Large Scale Forcingsand Characterization of the Diurnal Cycle. J.Atmos. Sci., Vol. 64, No. 8, p2783-2803.Pigeon G., D. Legain, P. Durand, V. Masson, 2007 :Anthropogenic heat release in old European cityToulouse (<strong>France</strong>), International Journal of Climatology,doi: 10.1002/joc.1530.Pigeon G., A. Lemonsu, CS. Grimond, P. Durand, V.Masson, 2007 : Turbulent fluxes divergences in thesurface layer: case of a coastal city. Boundary LayerMeteorology, 124,269-290.Piriou J.-M., J.-L. Re<strong>de</strong>lsperger, J.-F. Geleyn, J.-P.Lafore and F. Guichard, 2007 : "An approach forconvective parameterization with memory: separatingmicrophysics and transport in grid-scale equations",Journal of Atmospheric Sciences, vol. 64, n° 11,p. 4131-4143.Poli P., P. Moll, F. Rabier, G. Desroziers, B. Chapnik,L. Berre, S.B. Healy, E. An<strong>de</strong>rsson, F.-Z. El Guelai,2007 : Forecast Impact Studies of Zenith Total DelayData from European Near Real-Time GPS Stations inMeteo <strong>France</strong> 4DVAR, J. Geophys. Res., 112,D06114, doi: 10.1029/2006JD007430.Preunkert S., M. Legrand, B. Jourdain and I.Dombrowski-Etchevers, 2007 : Acidic gases (HCOOH,CH 3 COOH, HNO 3 , HCl and SO 2 ) and related aerosolspecies at a high mountain Alpine site (4360 m elevation)in Europe, J. Geophys. Res., 112, D23S12,doi: 10.1029/2006JD008225.Radkevich A., Lovejoy, S., Strawbridge, K., Schertzer,D., 2007 : The elliptical dimension of space-timeatmospheric stratification of passive admixturesusing lidar data. Physica A - Statistical mechanicsand its applications 382 (2): 597-615 Aug 152007.Rauber R.M., Bjorn Stevens, H.T. Ochs III, C. Knight, B.A.Albrecht, A.M. Blyth, C.W. FairallJ.B. Jensen,S.G. Lasher-Trapp, O.L. Mayol-Bracero, G. Vali, J.R. An<strong>de</strong>rson, B.A.Baker, A.R. Bandy, F. Burnet, J-L. Brenguier,W.A. Brewer,P.R.A. Brown, P. Chuang, W.R. Cotton, L. Di Girolamo, B.Geerts, H. Gerber, S. Göke, L. Gomes, B.G. Heikes, J.G.Hudson, P. Kollias, R.P. Lawson, S.K. Krueger, D.H.Lenschow, L. Nuijens, D.W. O'Sullivan, R.A. Rilling, D.C.Rogers, A.P. Siebesma, E. Snodgrass, J.L. Stith, D.C.Thornton, S. Tucker, C.H. Twohy, P. Zui<strong>de</strong>ma, 2007 :Rain in (Shallow) Cumulus over the Ocean-The RICOCampaign, Bulletin of the American MeteorologicalSociety, 88, N° 12, 1912-1928.58 . Research and <strong>de</strong>velopment: annual report 2007Reverdin G., P. Blouch, J. Boutin, P.P. Niiler, J.Rolland, W. Scuba, A. Lorenco and F. Rios, 2007 :Surface Salinity Measurements-COSMOS 2005Experiment in the Bay of Biscay. Journal of Atmosphericand Oceanic Technology, Vol. 24, N° 9,1643-1654.Rey G., E. Jougla, A. Fouillet, G. Pavillon, P. Bessemoulin,P. Frayssinet, J. Clavel, D. Hémon, 2007 :The impact of major heat waves on all-cause andcause-specific mortality in <strong>France</strong> from 1971 to2003. Int. Arch. Occup. Environ. Health, 80(7) :615-26.Ricaud P., B. Barret, J.-L. Attié, E. Le Flochmoën, E.Motte, H. Teyssèdre, V.-H. Peuch, N. Livesey and J.-P.Pommereau, 2007 : Impact of continental convectionon the transport of long-lived species to thetop of the Tropical Tropopause Layer, Atmos.Chem.Phys., 7, 5639-5657.Rinne, J., T. Douffet, Y. Prigent and P. Durand, 2007 :Field comparison of disjunct and conventional eddycovariance techniques for trace gas flux measurements.Journal of Environmental Pollution, doi:10.1016/j.envpol.2007.06.063.Rivière G, and I. Orlanski, 2007 : Characteristics ofthe Atlantic storm-track eddy activity and its relationwith the North Atlantic Oscillation. J. Atmos.Sci., 64, 241-266.Saleh K., J.-P. Wigneron, P. Waldteufel, P. <strong>de</strong> Rosnay,M. Schwank, J.-C. Calvet, Y. Kerr, 2007 : Estimates ofsurface soil moisture un<strong>de</strong>r grass covers using L-band radiometry, /Remote Sens. Env/., Vol. 109,pp. 42-53, 2007.Sarrat C., J. Noilhan, P. Lacarrère, S. Donier, C. Lac,J.-C. Calvet, H. Dolman, C. Gerbig, B. Neininger, P.Ciais, J.D. Paris, F. Boumard, M. Ramonet, A.Butet, 2007 : Atmospheric CO 2 mo<strong>de</strong>ling at theregional scale: application to the CarboEuropeRegional Experiment (Ceres), J. GeophysicalResearch, Vol. 112, D12105, doi: 10.1029/2006JD008107.Sarrat C. , J. Noilhan, A. Dolman, C. Gerbig, R.Ahmadov, L. Toll, A. Mesters, R. Hutjes, M. Helbert,G. Pere-Landa, S. Donier, 2007 : Atmospheric CO 2mo<strong>de</strong>ling at the regional scale: An intercomparisonof 5 meso-scale atmospheric mo<strong>de</strong>ls, Biogeosciences,4, 1923-1952, 2007.Saun<strong>de</strong>rs R., P. Rayer, P. Brunel, A. Von Engeln, N.Bormann, L. Strow, S. Hannon, S. Heilliette, Liu Xu,F. Miskolczi, Y. Han, G. Masiello, J.-L. Moncet, UyminGennady, V. Sherlock, D.S. Turner, 2007 : A comparisonof radiative transfer mo<strong>de</strong>ls for simulatingAtmospheric Infrared Soun<strong>de</strong>r (AIRS) radiances, J.Geophys. Res., 112, D01S90,doi:10.1029/2006JD007088.Semane N., V.-H. Peuch, L. El Amraoui, H. Bencherif,S. Massart, D. Cariolle, R. Abida and J.-L. Attié, 2007 :An observed and analysed stratospheric ozoneintrusion over the high Canadian Arctic UTLS regionin July 2003, /Q. J. R. Meteorol. Soc./, 133(S2),171-178, doi:10.1002/qj.141.Stockli, R., Vidale P-L., Boone, A. and C. Schar,2007 : Impact of scale and aggregation on the terrestrialwater exchange: integrating land surfacemo<strong>de</strong>ls and Rhone catchment observations. J.Hydrometeorol./, 8(5), 1002-1015.
Swingedouw D, P. Braconnot, P. Delecluse, E.Guilyardi and O. Marti, 2007 : Quantifying theAMOC feedbacks during a 2xCO(2) stabilizationexperiment with land-ice melting. CLIM DYNAM 29(5): 521-534 OCT 2007.Swingedouw D, P. Braconnot, P. Delecluse, E.Guilyardi and O. Marti, 2007 : The impact of globalfreshwater forcing on the thermohaline circulation:adjustment of North Atlantic convection sites in aCGCM. CLIM DYNAM 28 (2-3): 291-305 FEB 2007Tabary P., 2007 : The new French radar rainfall product.Part I: methodology, Wea. Forecasting, Vol.22, N° 3, 393 - 408.Tabary P., J. Desplats, K. Do Khac, F. Ei<strong>de</strong>liman, C.Gueguen and J.-C. Heinrich, 2007 : The new Frenchradar rainfall product. Part II: Validation, Wea.Forecasting, Vol. 22, No. 3, 409 - 427.Terray P., F. Chauvin, H. Douville, 2007 : Impact ofsoutheast Indian Ocean sea surface temperatureanomalies on monsoon-ENSO-dipole variability ina coupled ocean-atmosphere mo<strong>de</strong>l. Climate Dyn.,28, 553-580, doi: 10.1007/s00382-006-0192.Teyssèdre H., M. Michou, H. Clark, B. Josse, F.Karcher, D. Olivié, V.-H. Peuch, D. Saint-Martin, D.Cariolle, J.-L. Attié, P. Nédélec, P. Ricaud, V. Thouret,R.J. Van Der, A. Volz-Thomas et F. Chéroux, 2007 : Anew chemistry-climate tropospheric and stratosphericmo<strong>de</strong>l MOCAGE-Climat: evaluation of thepresent-day climatology and sensitivity to surfaceprocesses, Atmos. Chem. Phys., 5815-5860.Voldoire A., B. Heickhout, M. Schaeffer, J.-F. Royer,F. Chauvin, 2007 : Climate simulation of the twentyfirstcentury with interactive land-use changes.Clim. Dyn., 29(2-3) : 177-193, doi: 10.1007/s00382-007-0228-y.Wigneron J.-P., Y. Kerr, P. Waldteufel, K. Saleh, M.J.Escorihuela, P. Richaume, P. Ferrazzoli, P. DeRosnay, R. Gurney, J.-C. Calvet, J.P. Grant, M.Guglielmetti, B. Hornbuckle, C. Mätzler, T. Pellarin,M. Schwank, 2007 : L-band Microwave Emission ofthe Biosphere (L-MEB) Mo<strong>de</strong>l : <strong>de</strong>scription andcalibration against experimental data sets overcrop fields”, /Remote Sens. Env/, Vol. 107, pp.639-655.Other scientific papersAndré J-C, G De Marsily, H. Douville, 2007 : Lesimpacts <strong>de</strong>s changements climatiques sur le cyclehydrologique. Annales <strong>de</strong>s Mines-série : Responsabilitéet Environnement, 47 (2007) 49-53.Ardhuin F, L Bertotti, J-R Bidlot, L. Cavaleri, V. Filipetto,J-M Lefevre and Wittmann, P, 2007 : Comparison ofwind and wave measurements and mo<strong>de</strong>ls in theWestern Mediterranean Sea. OCEAN ENG 34 (3-4):526-541 MAR 2007.Artinyan E., F. Habets, J. Noilhan, E. Ledoux, D.Dimitrov, E. Martin and P. Le Moigne (2007) :Mo<strong>de</strong>lling the water budget and the river flows ofthe Maritsa basin in Bulgaria. Hydrol. Earth Syst.Sci. Discuss., 4, 475-521.Bencherif H., L. El Amraoui, B. Morel, N. Semane,S. Massart, D.V. Acharyulu, A. Hauchecorne, V.-H.Peuch, 2007 : Examination of the 2002 major warmingin the SH using ground-based andOdin/SMR assimilated data: stratospheric ozonedistributions and tropic/mid-latitu<strong>de</strong> exchange,Can. J. Phys., 85, 1287-1300, doi:10.1139/P07-143.Bergot T., 2007 : Quality assessment of the cobelIsba numerical forecast system of fog an low clouds.Journal of Pure and Applied Geophysics, specialissue on fog and low clouds. 164, 1265-1282.Bourlès B., P. Brandt, G. Caniaux, M. Dengler, Y.Gouriou, E. Key, R. Lumpkin, F. Marin, R.L.Molinariand C. Schmid, 2007 : African Monsoon MultidisciplinaryAnalysis (AMMA) : special measurementsin the Tropical Atlantic. CLIVAR NewsletterExchanges, 41, (12), 2, 7-9.Bouttier F., 2007 : Arome, avenir <strong>de</strong> la prévisionrégionale, La Météorologie, 8 e série, n° 58, pp. 12-20.Chauvin F. et J-F. Royer, 2007 : L'intensité <strong>de</strong>scyclones augmente- t' elle ? Pour la Science, dossierspécial « Climat, comment éviter la surchauffe », n°54, 34-38.Déqué M., 2007 : Réchauffement climatique : lesprojections, série trimestrielle <strong>de</strong>s Annales <strong>de</strong>sMines, Responsabilité et Environnement, n° 47,pages 18-26.Déqué M. et L. Li, 2007 : La prévision climatique -régionalisation et extrêmes, La Météorologie, n° 57,pp28-30.Douville H., J.-C. André, G. De Marsily, 2007 : Lesimpacts <strong>de</strong>s changements climatiques sur le cyclehydrologique, série trimestrielle <strong>de</strong>s Annales <strong>de</strong>sMines, Responsabilité et Environnement, n° 47,pages 49-53.Douville H. et P. Terray, 2007 : Réponse du cyclehydrologique aux forçages anthropiques « Que nousapprennent les <strong>de</strong>rnières simulations du GIEC ? » LaMétéorologie, n° 57, pp31-36.Fouillet A., G. Rey, E. Jougla, P. Frayssinet, P.Bessemoulin and D. Hemon, 2007 : A predictivemo<strong>de</strong>l relating daily fluctuations in summer temperaturesand mortality rates, BMC Public Health, 7: 114(19 June 2007).Guidard V. and D. Tzanos, 2007 : Analysis of fogprobability from a combination of satellite andground observation data. Pure and AppliedGeophysics, 164, p 1207-1220.Gusdorf F. and S. Hallegatte, 2007 : Compact orSpread-Out Cities: Urban Planning, Taxation andthe Vulnerability to Transportation Shocks, EnergyPolicy, 35 (2007) 4826-4838, doi:10.1016/j.enpol. 2007.04.017.Gusdorf F. and S. Hallegatte, 2007 : Behaviors andhousing inertia are key factors in <strong>de</strong>termining theconsequences of a shock in transportation costs,Energy Policy, 35 (6), pp. 3483-3495.Hallegatte S. et D. Théry, 2007 : Les impacts économiquesfuturs du changement climatique sont-ilssous-estimés ?, La Revue d'Économie Politique,117(4), 507-52259 . Research and <strong>de</strong>velopment: annual report 2007Hourca<strong>de</strong> J.-C, P. Ambrosi et S. Hallegatte,2007 :Faut-il agir ? Les raisons <strong>de</strong> l'urgence, Pour laScience n° 54, Climat : comment éviter la surchauffe?, 2007, 58-62.Kopf S., S. Hallegatte et M. Ha Duong, 2007 :L'évolution climatique <strong>de</strong>s villes européennes,Pour la Science n° 54 ' Climat : Comment éviter lasurchauffe ?, 2007, 48-51.Lejeune Y., Y. L'Hôte, P. Etchevers, P. Wagnon, J.-P.Chazarin, P. Chevallier, 2006 : Constitution d'unebase <strong>de</strong> données météorologiques sur un site andin<strong>de</strong> haute altitu<strong>de</strong> : le site du Charquini, 4 795 m. IAHSPublication n° 318, 173-185.Leroy A., J.-P. Céron, 2007 : Un défi <strong>de</strong> la prévisionsaisonnière : la <strong>de</strong>scente d'échelle, La Météorologie,8 e série, n° 58, pp. 36-44.Lovejoy S and D. Schertzer, 2007 : Scale, scalingand multifractals in geophysics: Twenty years on.Nonlinear dynamics in geosciences : 311-337,2007Macor J, D. Schertzer and S. Lovejoy, 2007 : Multifractalmethods applied to rain forecast usingradar data. La Houille Blanche. (4) : 92-98.Manach J., E. Bertrand et J. Bi<strong>de</strong>t, 2007 :Assistance météorologique à la prévention et à lalutte contre les feux <strong>de</strong> forêts en zone méditerranéenne.La Météorologie, 8 e série, n° 56, février2007, pp 22-26.Martin E., V. Ducrocq, A. Joly, B. Joly, O. Nuissier, P.Quintana Seguí, D. Ricard, Sevault F., Somot S., P.Drobinsky, 2007 : La Méditerranée, région témoin: <strong>de</strong> Cyprim à Hymex, La Houille Blanche, N° 6 -2007, 90-96.Massart S., A. Piacentini, D. Cariolle, L. El Amraoui,N. Semane, 2007 : Assessment of the quality of theozone measurements from the Odin/SMR instrumentusing mo<strong>de</strong>l assimilation. Can. J. Phys., 85,1209-1223, doi:10.1139/P07-124.
Moisselin J.-M. et S. Jourdain, 2007 : Long-term datarescue and use. La Houille Blanche (1) : 33-38 2007.Navarre J-P. J. Meyssonnier and A. Vagnon, 2007 :3D numerical mo<strong>de</strong>l of snow <strong>de</strong>formation withoutfailure and its application to cold room mechanicaltests, Cold Regions Science and Technology,Vol 50 (2007) 3-12.Planton S., 2007 : Réchauffement climatique : attributionet recherche <strong>de</strong>s causes, série trimestrielle<strong>de</strong>s Annales <strong>de</strong>s Mines, Responsabilité et Environnement,n° 47, pages 12-17.Planton S. et L. Terray, 2007 : Détection et attributionà l'échelle régionale : le cas <strong>de</strong> la <strong>France</strong>, LaMétéorologie, 8 e série, n° 58, pp25-29.Roquelaure S. and T. Bergot, 2007 : Seasonal sensitivityon COBEL-ISBA local forecast system for fog andlow clouds. Journal of Pure and Applied Geophysics,special issue on fog and low clouds. 164.Royer J.-F., H. Douville, 2007 : le forçage climatique- cause naturelle et cause anthropique, hors-série<strong>de</strong> Sciences et Avenir, n° 150, pp 73-76.Sacre C, JM Moisselin, M. Sabre, J.-P. Flori and B.Dubuisson, 2007 : A new statistical approach toextreme wind speeds in <strong>France</strong>. J WIND ENG INDAEROD 95 (9-11): 1415-1423 OCT 2007.Salas-Mélia D., C. Genthon, O. Arzel, C. Cassou, V.Guemas, G. Krinner, M. Minvielle et D. Swingedouw,2007 : Régions polaires, cryosphère et circulationthermohaline. Que nous ont appris lessimulations du 4 e rapport d'évaluation du GIEC ?,La Météorologie, 8 e série, n° 56, fév. 2007, pp 33-39.Tchiguirinskaia I., D. Schertzer, S. Lovejoy and J.-M.Veysseire, 2007 : Wind extremes and scales: Multifractalinsights and empirical evi<strong>de</strong>nce. WindEnergy : 99-104.Wagner W., P. Pampaloni, G. Blöschl, J.-C. Calvet, B.Bizzarri, J.-P. Wigneron, Y. Kerr, 2007 : OperationalReadiness of Microwave Remote Sensing of SoilMoisture for Hydrologic applications. NordicHydrology, Vol. 1, N° 1, pp. 1-20.Contribution to books or reportsAlcamo, J., J.M. Moreno, B. Novaky, M. Bindi, R.Corobov, R.J.N. Devoy, C. Giannakopoulos, E. Martin,J.E. Olesen, A. Shvi<strong>de</strong>nko, 2007 : Climate Change2007: Impacts, Adaptation and Vulnerability.Contribution of Working Group II to the FourthAssessment Report of the Intergovernmental Panelon Climate Change, M.L. Parry, O.F. Canziani, J.P.Palutikof, C.E. Hanson, P.J. van <strong>de</strong>r Lin<strong>de</strong>n, Eds.,Cambridge University Press, Cambridge.Apicella, L., F. Tallet, S. Hallegatte, F. Nadaud, 2007,Aléas climatiques, aléas économiques : les effets duclimat sur l'activité économique en <strong>France</strong>, dossier<strong>de</strong> la Note <strong>de</strong> Conjoncture <strong>de</strong> l'INSEE, juillet 2007.Cerveny, R., V.D. Belitskaya, P. Bessemoulin, M.Cortez, C. Landsea and T.C. Peterson, 2007: A NewWestern Hemisphere 24-Hour Rainfall Record. WMOBulletin, 56(3), 212-215, July 2007.Faure G., S. Westrelin, 2007 : A new Météo-<strong>France</strong>NWP system over the southwest Indian ocean. WGNEBlue Book.Le Borgne P, A. Marsouin, F. Orain, H. Roquet, A. Coatand Y. Guichoux, 2007 : Implementation of a finescale SST analysis over the Atlantic Ocean , MERSEA-WP02-MF-STR-002-1A, 41p.Lavanant L., 2007 : Radiance spatial distribution inIASI soun<strong>de</strong>r for analysis. Rapport CNES CalVal IASIlevel1 phaseA.Papers are available at the following address ( http://intramet.meteo.fr/bibliotheque/ )using the item "documentations scientifiques et techniques".60 . Research and <strong>de</strong>velopment: annual report 2007
Theses <strong>de</strong>fen<strong>de</strong>d in 2007Auligné T., 2007 : Assimilation variationnelle <strong>de</strong>sobservations <strong>de</strong> son<strong>de</strong>urs infrarouges hyperspectraux: correction <strong>de</strong> biais et détection nuageuse,thèse <strong>de</strong> doctorat <strong>de</strong> l'université Paul-Sabatier, disciplineOcéan Atmosphère et Environnement, soutenuele 8 juin 2007.Caumont O., 2007 : Simulation et assimilation <strong>de</strong>données radar pour la prévision <strong>de</strong> la convectionprofon<strong>de</strong> à fine échelle, thèse <strong>de</strong> doctorat <strong>de</strong> l'universitéPaul-Sabatier, discipline Océan Atmosphèreet Environnement, soutenue le 4 décembre 2007.Descamps L., 2007 : Définition <strong>de</strong>s conditions initiales<strong>de</strong>s prévisions d'ensemble. Liens avec l'assimilation<strong>de</strong> données, thèse <strong>de</strong> doctorat <strong>de</strong>l'université Paris VI, discipline Sciences <strong>de</strong> l'environnementd'Île <strong>de</strong> <strong>France</strong>, soutenue le 29 octobre2007.Geoffroy O., 2007 : Modélisation LES <strong>de</strong>s précipitationsdans les nuages <strong>de</strong> couche limite et paramétrisationpour les modèles <strong>de</strong> circulation générale,thèse <strong>de</strong> doctorat <strong>de</strong> l'université Paul-Sabatier, disciplineOcéan Atmosphère et Environnement, soutenuele 22 mai 2007.Gibelin A-L, 2007 : Cycle du carbone dans un modèle<strong>de</strong> surface continentale : Modélisation, validation etmise en œuvre à l'échelle globale, thèse <strong>de</strong> doctorat<strong>de</strong> l'université Paul-Sabatier, discipline OcéanAtmosphère et Environnement, soutenue le 9 mai2007.Guidard V, 2007 : Assimilation multi-échelle dans unmodèle météorologique régional, thèse <strong>de</strong> doctorat<strong>de</strong> l'université Paul-Sabatier, discipline OcéanAtmosphère et Environnement, soutenue le 23 octobre2007.Lebeaupin C., 2007 : Étu<strong>de</strong> du couplage océnaatmosphèreassocié aux épiso<strong>de</strong>s <strong>de</strong> pluie intenseen région méditerranéenne, thèse <strong>de</strong> doctorat <strong>de</strong>l'université Paul-Sabatier, discipline Océan Atmosphèreet Environnement, soutenue le 19 décembre2007.Munoz-Sabater J., 2007 : Assimilation <strong>de</strong> données<strong>de</strong> télédétection pour le suivi <strong>de</strong>s surfaces continentales: Mise en œuvre sur un site experimental, thèse<strong>de</strong> doctorat <strong>de</strong> l'université Paul-Sabatier, disciplineOcéan Atmosphère et Environnement, soutenue le13 avril 2007.Pigeon G., 2007 : Les échanges surface-atmosphèreen zone urbaine - projets CLU-ESCOMPTE et CAPI-TOUL, thèse <strong>de</strong> doctorat <strong>de</strong> l'université Paul-Sabatier,discipline Océan Atmosphère et Environnement,soutenue le 29 mai 2007.Rivière O., 2007 : Prévisibilité <strong>de</strong> l'écoulement atmosphériqueaux échelles synoptiques : influence <strong>de</strong>snon-linéarités et <strong>de</strong> l'humidité, thèse <strong>de</strong> doctorat <strong>de</strong>l' École nationale <strong>de</strong>s Ponts et Chaussées, disciplineMathématique informatiques, soutenue le 19 décembre2007.Roquelaure S., 2007 : Prévision d'ensemble locale<strong>de</strong>s brouillards et nuages bas à l'aéroport international<strong>de</strong> Roissy - Charles-De-Gaulle, thèse <strong>de</strong> doctorat<strong>de</strong> l'université Paul-Sabatier, discipline OcéanAtmosphère et Environnement, soutenue le 3 décembre2007.Rousset F., 2007 : Modélisation <strong>de</strong>s bilans <strong>de</strong> surfaceet <strong>de</strong>s débits sur la <strong>France</strong>, application à la prévision<strong>de</strong>s débits, thèse <strong>de</strong> doctorat <strong>de</strong> l'universitéPaul-Sabatier, discipline Océan Atmosphère etEnvironnement, soutenue le 6 juillet 2007.Sandu I., 2007, Impact <strong>de</strong> l'aérosol sur le cycle <strong>de</strong> vie<strong>de</strong>s nuages <strong>de</strong> couche limite, thèse <strong>de</strong> doctorat <strong>de</strong>l'université Paul-Sabatier, discipline OcéanAtmosphère et Environnement, soutenue le 8novembre 2007.Sohne N., 2007 : Validation <strong>de</strong>s prévisions <strong>de</strong>nuages et <strong>de</strong> précipitations à mésoéchelle par l'observationsatellite, thèse <strong>de</strong> doctorat <strong>de</strong> l'universitéPaul-Sabatier, discipline Océan Atmosphère etEnvironnement, soutenue le 23 novembre 2007.Tomas S., 2007 : Modélisation et étu<strong>de</strong> expérimentale<strong>de</strong> la turbulence au sein <strong>de</strong>s couches limitesatmosphériques, thèse <strong>de</strong> doctorat <strong>de</strong> l'universitéPaul-Sabatier, discipline Océan Atmosphère etEnvironnement, soutenue le 30 janvier 2007.Zaïri E.-P., 2007 : Cycle <strong>de</strong> l'eau <strong>de</strong>s systèmesconvectifs Ouest Africains : préparation à l'exploitation<strong>de</strong>s mesures radar Xport dans AMMA par simulation,thèse <strong>de</strong> doctorat <strong>de</strong> l'universitéPaul-Sabatier, discipline Océan Atmosphère etEnvironnement, soutenue le 29 janvier 2007.« Habilitation à diriger <strong>de</strong>s recherches » <strong>de</strong>fen<strong>de</strong>d in 2007Desroziers G., 2007 : mise en œuvre, diagnostic etoptimisation <strong>de</strong>s schémas d'assimilation <strong>de</strong> données,habilitation à diriger <strong>de</strong>s recherches auprès <strong>de</strong>l’Université Toulouse III, discipline Physique <strong>de</strong>l'Atmosphère, soutenue le 11 mai 2007.61 . Research and <strong>de</strong>velopment: annual report 2007
GlossaryOrganismsAASQA Associations Agréées <strong>de</strong> Surveillance <strong>de</strong> la Qualité <strong>de</strong> l'AirCEDRE <strong>Centre</strong> <strong>de</strong> Documentation, <strong>de</strong> Recherche et d'Expérimentationssur les pollutions acci<strong>de</strong>ntelles <strong>de</strong>s eauxCEPMMT <strong>Centre</strong> Européen pour les Prévisions Météorologiques à Moyen TermeCEREA <strong>Centre</strong> d'Enseignement et <strong>de</strong> Recherche en EnvironnementAtmosphériqueCERFACS <strong>Centre</strong> Européen <strong>de</strong> Recherche et <strong>de</strong> Formation Avancée en CalculScientifiqueCESBIO <strong>Centre</strong> d' Etu<strong>de</strong>s Spatiales <strong>de</strong> la BIOsphèreCNES <strong>Centre</strong> <strong>National</strong> d'Etu<strong>de</strong>s SpatialesCNRS <strong>Centre</strong> <strong>National</strong> <strong>de</strong> la Recherche ScientifiqueDLR Deutsche zentrum fur Luft und RaumfahrtESA European Space Agency (Agence Spatiale Européenne)EUMETNET EUropean METeorological NETworkEUMETSAT EUropean organisation for the exploitation of METeorological SATellitesHADLEY CENTER <strong>Centre</strong> Britannique <strong>de</strong> Recherche sur le Changement ClimatiqueIFREMER Institut Français <strong>de</strong> Recherche pour l'Exploitation <strong>de</strong> la MERIGN Institut Géographique <strong>National</strong>IMFT Institut <strong>de</strong> Mécanique <strong>de</strong>s Flui<strong>de</strong>s <strong>de</strong> ToulouseINSU Institut <strong>National</strong> <strong>de</strong>s Sciences <strong>de</strong> l'UniversKNMI Koninklijk Ne<strong>de</strong>rlands Meteorologisch Instituut (Institutroyal météorologique<strong>de</strong>s Pays-Bas)MEDAD Ministère <strong>de</strong> l'Ecologie, du Développement et <strong>de</strong> l'Aménagement DurableMERCATOR Océan GIP visant à la mise en œuvre d'un système opérationnel <strong>de</strong> prévisionocéanographique globalNCEP <strong>National</strong> Centers for Environmental PredictionOMM Organisation Météorologique MondialeONERA Office <strong>National</strong> d'Etu<strong>de</strong>s et <strong>de</strong> <strong>Recherches</strong> AérospatialesSPOT Satellite Pour l'Observation <strong>de</strong> la TerreUKMO (MetOffice) United Kingdom Meterological OfficeLaboratories or research/<strong>de</strong>velopment teamsCEN <strong>Centre</strong> d'Etu<strong>de</strong>s <strong>de</strong> la NeigeCETP <strong>Centre</strong> d'Étu<strong>de</strong> <strong>de</strong>s environnements Terrestre et PlanétaireCMM <strong>Centre</strong> <strong>de</strong> Météorologie MarineCMS <strong>Centre</strong> Météorologie SpatialeCNRM <strong>Centre</strong> <strong>National</strong> <strong>de</strong> <strong>Recherches</strong> MétéorologiquesENM/UFR Ecole <strong>National</strong>e <strong>de</strong> la Météorologie/Unité <strong>de</strong> Formation et <strong>de</strong> RechercheGAME Groupe d'étu<strong>de</strong>s <strong>de</strong> l'Atmosphère MétéorologiquEIPSL Institut Pierre-Simon-LaplaceLA Laboratoire d'AérologieLaMP Laboratoire <strong>de</strong> Météorologie PhysiqueLCPC Laboratoire Central <strong>de</strong>s Ponts et ChausséesLISA Laboratoire Interuniversitaire <strong>de</strong>s Systèmes AtmosphériquesLOCEAN Laboratoire d'Océanographie et du Climat : Expérimentations etApproches NumériquesNASA <strong>National</strong> Aeronautics and Space AdministrationSAFIRE Service <strong>de</strong>s Avions Français Instrumentés pour la Recherche enEnvironnementSPEA Simulation Physique <strong>de</strong>s Ecoulements Atmosphériques<strong>National</strong> or european programms or projects<strong>National</strong> programs or projectsANR Agence <strong>National</strong>e <strong>de</strong> la RechercheCOPS Convective and Orographically-induced Precipitation StudyCYPRIM CYclogénèse et PRécipitations Intenses en région MéditerranéenneIRCAAM Influence Réciproque <strong>de</strong>s Climats d'Afrique <strong>de</strong> l'ouest, du sud <strong>de</strong> l'Asieet du bassin MéditerranéenPERLE Programme d'Evaluation <strong>de</strong>s Rejets Locaux d'EffluentsInternational programmes or projectsCERES CarboEurope Regional Experiment StrategyCIRCE Climate change and impact research : mediterranean environment (FP6)CIRENE Projet d'observation <strong>de</strong> l'océan indien tropicalENSEMBLES Ensemble-based predictions of climate changes and their impacts (FP6)EUCOS EUmetnet Composit Observing SystemEUFAR EUropean Fleet for Airborne Research (FP6)FLUXNET Programme international sur les mesures <strong>de</strong> flux <strong>de</strong> carbone dans lesécosystèmes terrestresFLYSAFE Système <strong>de</strong> vol intégré pour l'amélioration <strong>de</strong> la sécurité, la protectioncontre les imprévus, et les opérations tout tempsGEMS Global and regional Earth-system Monitoring using Satellite and in-situdata (initiative du CEPMMT)GICC Gestion et Impacts du Changement Climatique (programme du ministère<strong>de</strong> l'écologie)GIEC Groupe Inter-gouvernemental d'Experts sur le changement Climatique(IPCC)GMES Global Monitoring for Environment and Security (Système Globald'Observation <strong>de</strong> l'Environnement pour la Sécurité, programme <strong>de</strong>l'Union européenne)HIRLAM HIgh Resolution Limited Area Mo<strong>de</strong>l (modélisation)HyMeX Hydrlogical cycle in the Mediterrannean EXperimentIMFREX IMpact sur la Fréquence <strong>de</strong>s EXtrêmesIPCC Intergovernmental Panel on Climate Change (GIEC)MERSEA Marine EnviRonment and Security for the European AreaMISSTERRE Modélisation Intégrée du SyStème TERRE (projet LEFE)MOZAIC Measurement of OZone by Airbus In service airCraftMyOCEAN Successeur du projet MERSEA, visant à sa consolidation, piloté parMercator OceanPROMOTE PROtocal MOniToring for the GMES service Element for atmosphereprojectQUANTIFY QUANTIFYing the climate impact of global and european transportsystems (FP6)SAF Satellite Application FacilitySAMM Sea Atmosphere Mediterranean Mo<strong>de</strong>l (modéle couplé régional)THORPEX THe Observing Research and Predictability EXperiment (programmemondial du GARP sous l'égi<strong>de</strong> <strong>de</strong> l'OMM)TIGGE THORPEX International Grand Global EnsembleCampaignsAMMA Approche Multidisciplinaire <strong>de</strong> la Mousson AfricaineCOPS Convective and Orographically-induced Precipitation StudyAtmosphérique et <strong>de</strong> Transports d'EmissionsEGEE Volet océanographique <strong>de</strong> la campagne AMMA (golfe <strong>de</strong> Guinée)PARIS-FOG Campagne <strong>de</strong> mesures pour l'étu<strong>de</strong> du cycle <strong>de</strong> vie du brouillard(Palaiseau 2006)SMOSMANIA Soil Moisture Observing System : Meteorological Automatic NetworkIntegrated ApplicationVASCO Campagne intensive d'observations atmosphériques et <strong>de</strong>s échangesocéan-atmosphèreOthersADM-AEOLUS Atmospheric Dynamics Mission (satellite d'observation <strong>de</strong> la dynamique<strong>de</strong> l'atmosphère terrestre, mis en œuvre par l'ESA)ADP Aéroports De ParisALADIN Aire Limitée, Adaptation dynamique, Développement Inter<strong>National</strong>ALADIN-Climat ALADIN-ClimatALBATROS Autoflux Linked Base for TRansfer at Ocean SurfaceAMDAR Aircraft Meteorological Data Acquisition and RelayAMSR Advanced Microwave Scanning RadiometerAMSR-E AMSR for Earth observing systemAMSU-A Advanced Microwave Sounding Unit - AAQUA Satellite du Earth observing system <strong>de</strong> la NASAAQUARIUS Satellite <strong>de</strong> mesure <strong>de</strong> la salinité <strong>de</strong> la surface <strong>de</strong> la merAR-4 Annual Report 4 (4ème rapport annuel du GIEC)ARAMIS Application RAdar à la Météorologie Infra-SynoptiqueAROME Application <strong>de</strong> la Recherche à l'Opérationnel à Méso-EchelleARPEGE Applications <strong>de</strong> la Recherche Petite Echelle Gran<strong>de</strong> Echelle (modèleglobal <strong>de</strong> prévision numérique opérationnel <strong>de</strong> Météo-<strong>France</strong>)ARPEGE-Climat Modèle <strong>de</strong> simulation climatique global du CNRMARPEGE-SCM SAFRAN-CROCUS-MEPRAARGOS Advanced Research and Global Observation SatelliteASAP Automated Shipboard Aerological ProgrammeASCAT Advanced SCATterometer62 . Rapport recherche et développement 2007
ATE Analyse <strong>de</strong>s Terres Émergées (SAF Eumetsat)ATOVS Advanced Tiros Operational Vertical Soun<strong>de</strong>rATR Avion <strong>de</strong> Transport RégionalAURA/MLS AURA (satellite)/Microwave Limb Soun<strong>de</strong>rBUFR Binary Universal Form for the Representation of meteorological dataCALIPSO Cloud Aerosol Lidar and Infrared Pathfin<strong>de</strong>r Satellite ObservationsCAPE Convective Available Potential EnergyCARIBOU Cartographie <strong>de</strong>s Analyses du RIsque <strong>de</strong> Brume et brOUillardCAROLS Cooperative Airbone Radiometer for Ocean and Land StudiesCHAMP CHAllenging Minisatellite PayloadCHIMERE Modèle <strong>de</strong> prévision <strong>de</strong> la qualité <strong>de</strong> l'air du CNRS et <strong>de</strong> l'INERISCIC <strong>Centre</strong> International <strong>de</strong> ConférencesCLOUDSAT CLOUD SATellite (satellite d'observation <strong>de</strong> la NASA)CMRS <strong>Centre</strong> Météorologique Régional SpécialiséCNRM-CM3.1 CNRM - Climate Mo<strong>de</strong>l Version 3.1CNRM-CM3.2 CNRM - Climate Mo<strong>de</strong>l Version 3.2CNRM/GMEI <strong>Centre</strong> <strong>National</strong> <strong>de</strong> <strong>Recherches</strong> Météorologiques/Groupe <strong>de</strong> MétéorologieExpérimentale InstrumentaleCNP <strong>Centre</strong> <strong>National</strong> <strong>de</strong> PrévisionCOBEL Co<strong>de</strong> <strong>de</strong> Brouillard à l'Echelle LocaleCOSMIC Constellation Observing System for Meteorology, Ionosphere and ClimateCROCUS Modèle d'évolution du manteau neigeuxCYCOFOS Prévision pour la Méditerranée (plate-forme Chypre)DCLIM Direction <strong>de</strong> la CLIMatologieDGT Direction Générale ToulouseDIAGPACK DIAGnostic PACKageDIREN Direction InterRégionale Nord-EstDIRIC Direction InterRégionale Ile-<strong>de</strong>-france <strong>Centre</strong>DOLMEN Développement OpérationneL <strong>de</strong>s Moyens d'Expertise NivologiqueDT/DSO/CMR Direction Technique/Direction <strong>de</strong>s Systèmes d'Observation/<strong>Centre</strong> <strong>de</strong>Météorologie RadarECOCLIMAP Base <strong>de</strong> données <strong>de</strong> paramètres <strong>de</strong> surfaceECUME Exchange Coefficients from Unified Multi-campaigns EstimatesEPI Evénements Précipitants IntensesEPS Ensemble Prediction SystemEQM Erreur Quadratique MoyenneERA40 Réanalyse (sur 40 ans) du CEPMMTERS European Remote Sensing satelliteERS-SCAT ERS SCATterometerEURAD EURopäisches Ausbreitungs- und Depositionsmo<strong>de</strong>llFM13-SHIP Message utilisé en météorologie marineFM18-BUOY Message utilisé en météorologie marineFORMOSAT Satellite operated by Taiwan's <strong>National</strong> Space OrganizationGELATO Modèle d'évolution <strong>de</strong> la banquise développé au CNRMGLC2000 Global Land Cover 2000GMAP Groupe Météorologique d'Assimilation Prévision (CNRM)GML Geography Markup LanguageGNSS Global Navigation Satellite SystemGPS Global Positionning SystemGRACE GRAvity recovery and Climate ExperimentGRAS GNSS Reiver for Atmospheric SoundingGT1 Groupe <strong>de</strong> Travail 1 (du GIEC)GUR Groupe <strong>de</strong>s Utilisateurs RadarHADISST HADley centre global sea Ice and Sea Surface TemperatureHAL Hyper Article en LigneHIRS High resolution Infrared Radiation Soun<strong>de</strong>rIAGOS Integration of routine Aircraft measurements into a Global ObservingSystemIASI Interféromètre Atmosphérique <strong>de</strong> Sondage InfrarougeIFS Integrated Forecasting SystemIGACO Integrated Global Atmospheric Chemistry ObservationsIOP Intensive Observation Period (IOP)IPY International Polar YearIRIDIUM Satellite en orbite polaireISBA Interaction between Soil, Biosphere and AtmosphereISBA-CC ISBA-Cycle du CarboneKFS Métho<strong>de</strong> <strong>de</strong> réduction d'entropie KFSLEANDRE2 Instrument Lidar aéroportéLEF Langue d'Eau Froi<strong>de</strong>LES Large Eddy SimulationL-EPS Prévision d'ensemble sur un domaine limitéLIDAR Light Induced Detection And RangingMedSlik Modèle <strong>de</strong> dispersion <strong>de</strong> polluantsMEPRA Modèle Expert <strong>de</strong> Prévision du Risque d'AvalancheMERCATOR Projet d'océanographie opérationnelle <strong>de</strong> prévision <strong>de</strong>s caractéristiquesphysiques <strong>de</strong> l'océanMESO-NH modèle numérique à MESO-échelle Non-HydrostatiqueMETOP METeorological Operationnal Polar satellitesMFS Meteorological Forecasting SystemMHS Microwave Humidity Soun<strong>de</strong>rMOCAGE MOdèle <strong>de</strong> Chimie Atmosphérique à Gran<strong>de</strong> EchelleMODCOU MODèle hydrologique COUplé surface-souterrainMODIS MODerate resolution Imaging SpectroradiometerMOTHY Modèle Océanique <strong>de</strong> Transport d'HYdrocarburesMSG Meteosat Secon<strong>de</strong> GénérationNAO North Atlantic OscillationNH Non HydrostatiqueNIVOSE Station automatique <strong>de</strong> mesure en haute montagneOD3D Modèle <strong>de</strong> météorologie marineOPA Océan PAralléliséOPAMED Océan Parallélisé/MEDiterranéeORCHIDEE ORganizing Carbon and Hydrology In Dynamic EcosystEmsOSSE Observing System Simulation ExperimentsOTICE Organisation du Traité d'Interdiction Complète <strong>de</strong>s Essais nucléairesPALM Projet d'Assimilation par Logiciel Multi-métho<strong>de</strong>sPANTHERE Programme Aramis Nouvelles Technologies HydrométéorologieExtension et REnouvellementPCRD Programme Cadre <strong>de</strong> Recherche et DéveloppementPEARP Prévision d'Ensemble ARPègePrév'Air Simulations déterministes <strong>de</strong> la qualité <strong>de</strong> l'air en <strong>France</strong> et en EuropeRADOME Réseau d'Acquisition <strong>de</strong> Données et d'Observations MétéorologiquesÉtenduRALI Système RAdar-LIdarRASTA Radar Aéroporté et Sol <strong>de</strong> Télédétection AtmosphériqueROC Relative Operating CharacteristicsSAFRAN Système d'Analyse Fournissant <strong>de</strong>s Renseignements Atmosphériquesà la NeigeSAF-NWC Satellite Application Facility - NoWCastingSBD Short Burst Data (bouées)SIGMA Système d'I<strong>de</strong>ntification du Givrage en Météorologie AéronautiqueSIM Safran-Isba-ModcouSIR Safran-prévision/Isba-RouteSMOS Soil Moisture and Ocean SalinitySMT Système Mondial <strong>de</strong> TransmissionSOP Special Observation PeriodSST Sea Surface TemperatureSURFEX SURFace EXternaliséeSVP-B Surface Velocity Program (océanographie)SYMPHONIE Modèle 3D aux équations primitives développé par le Laboratoired'AérologieTRIP Total Runoff Integrating PathwayTSM Température <strong>de</strong> Surface <strong>de</strong> la MerUHF Ultra High FrequencyUTC Universal Time Coordonnated (TU)VEGETATIONB Module du satellite SPOTVHF Very High FrequencyWIMS-Cb Weather InforMation Systems on Cumulonimbus3D-Var Assimilation variationnelle tridimensionnelle4D-Var Assimilation variationnelle quadridimensionnelle63 . Rapport recherche et développement 2007
Management structure<strong>National</strong> meteorological researchs centreHead : Éric BrunDeputy Head - Toulouse : Joël PoitevinScientific Dep. Head - Toulouse : Jean PailleuxDeputy Head - Paris : Pascale DelécluseGENERAL SERVICESParis & ToulouseMETEOROLOGICAL AVIATION CENTRE<strong>Centre</strong> head : Marc PontaudCAM - ToulouseSNOW RESEARCH CENTRE<strong>Centre</strong> head : Pierre EtcheversCEN - GrenobleMARINE METEOROLOGY CENTRE<strong>Centre</strong> head : Jean RollandCMM - BrestMODELLING FOR ASSIMILATION AND FORECASTING GROUPGroup head : François BouttierGMAP - ToulouseEXPERIMENTAL AND INSTRUMENTAL METEOROLOGY GROUPGroup head : Jean-Louis BrenguierGMEI - ToulouseCLIMATE AND LARGE SCALE MODELLING GROUPGroup head : Serge PlantonGMGEC - ToulouseMESO-SCALE MODELLING GROUPGroup head : Joël NoilhanGMME - ToulouseSTUDIES DANS INTERNAL KNOWLEDGE TRANSFERS GROUPGroup head : Christine DrevetonRETIC - Toulouse64 . Research and <strong>de</strong>velopment: annual report 2007
<strong>Centre</strong> national <strong>de</strong> recherches météorologiques42, avenue Gaspard-Coriolis 31057 Toulouse Ce<strong>de</strong>x 1 <strong>France</strong> - Tél. : (33) 5 61 07 93 70 - Fax : (33) 5 61 07 96 00http: //www.cnrm.meteo.fr - Mail : contact@cnrm.meteo.frEdition Météo-<strong>France</strong>Direction commerciale et <strong>de</strong> la communication.Imprimé sur du papier écologique, sur les presses <strong>de</strong> l’imprimerie <strong>de</strong> Météo-<strong>France</strong> D2C/IMP, labelisée Impri’vert ® .Conception, réalisation et impression D2C/IMP TrappesMaquette <strong>de</strong> couverture www.eurorscg.fr
Researchand<strong>de</strong>velopment:annual report2007© Yann Arthus-Bertrand/Altitu<strong>de</strong> - www.yannarthusbertrand.org – www.goodplanet.org • Edition août 2008Météo-<strong>France</strong>1, quai Branly75340 Paris Ce<strong>de</strong>x 7<strong>France</strong>Tel.: +33 1 45 56 71 71Fax: +33 1 45 56 71 11www.meteofrance.comMétéo-<strong>France</strong> is certifiedISO 9001-2000 by BVQI© Météo-<strong>France</strong> 2008Dépôt légal août 2008ISSN 1166-732 X